2015
Publication Year
2020-03-07T10:56:36Z
Acceptance in OA@INAF
þÿApplication of the MST clustering to the high energy ³-ray sky. I New possible
þÿdetection of high-energy ³-ray emission associated with BL Lac objects
Title
CAMPANA, RICCARDO; Massaro, E.; Bernieri, E.; D'Amato, Q.
Authors
10.1007/s10509-015-2570-6
DOI
http://hdl.handle.net/20.500.12386/23158
Handle
ASTROPHYSICS AND SPACE SCIENCE
Journal
360
Number
Application of the MST clustering to the high energy
γ-ray sky.
I - New possible detection of high-energy
γ-ray emission
associated with BL Lac objects
R. Campana •E. Massaro • E. Bernieri•Q. D’Amato
Abstract In this paper we show an application of the Minimum Spanning Tree (MST) clustering method to the high-energy γ-ray sky observed at energies higher than 10 GeV in 6.3 years by the Fermi -Large Area Tele-scope. We report the detection of 19 new high-energy γ-ray clusters with good selection parameters whose cen-troid coordinates were found matching the positions of known BL Lac objects in the 5th Edition of the Roma-BZCAT catalogue. A brief summary of the properties of these sources is presented.
Keywords gamma rays: general gamma rays: galax-ies galaxgalax-ies: active: BL Lac objects methods: data analysis
1 Introduction
Observational γ-ray astronomy in the GeV range is a new window on the universe opened by the Fermi -Large Area Telescope (LAT) mission. The number of photons having energies higher than a few GeV collected by this instrument in more than six years since August 2008
R. Campana
INAF–IASF-Bologna, via Piero Gobetti 101, I-40129, Bologna, Italy
E. Massaro
INAF–IAPS, via del Fosso del Cavaliere 100, I-00133, Roma, Italy
and
In Unam Sapientiam, Roma, Italy E. Bernieri
INFN–Sezione di Roma Tre, via della Vasca Navale 84, I-00146 Roma, Italy
Q. D’Amato
Dipartimento di Matematica e Fisica, Universit`a di Roma Tre, via della Vasca Navale 84, I-00146 Roma, Italy
is large enough to allow the detection of many Galac-tic and extragalacGalac-tic sources. The first catalogue of sources detected above 10 GeV in the first three years of the Fermi mission (1FHL, Ackermann et al. 2013b) contains 514 objects, of which 393 are associated with Active Galactic Nuclei (AGNs) with a large dominance of BL Lac objects (259 sources, about 50% of the entire catalogue). A previous catalogue at even higher ener-gies (>100 GeV) was realized by Neronov et al. (2011). In previous works (Campana et al. 2008, 2013; Bernieri et al. 2013) we adapted a clustering method based on the Minimum Spanning Tree (hereafter MST) topometric algorithm for detecting photon concentra-tions in LAT γ-ray images of the sky, and developed some useful indicators to select clusters having a signif-icance high enough to be genuine. This method works well in not very dense photon fields with a rather uni-form background and has a good peruni-formance in ex-tracting weak sources appearing as quite compact clus-ters of four or five photons. MST was already applied in preparing the 1FHL and the 1FGL (Abdo et al. 2010) and 2FGL (Nolan et al. 2012) catalogues of the Fermi-LAT collaboration. Other clustering methods have been applied to γray source searches in the Fermi -LAT sky images such that by Neronov et al. (2011), and DBSCAN by Tramacere and Vecchio (2013).
In this paper we show an example of MST appli-cation to the high-energy (>10 GeV) Fermi -LAT sky. Several new rather faint clusters were found very close to the position of known BL Lac objects reported in the 5th Edition of the Multifrequency Blazar Catalogue Roma-BZCAT (Massaro et al. 2014, 2015, hereafter 5BZCAT) and having all the characteristics of genuine γ-ray emitters. In the following Sections we describe the main properties of these sources which are interest-ing to bridge GeV and TeV astronomy.
2 γ-ray source detection by means of the MST algorithm
We first present a short review our method based on MST: for a more complete description see Campana et al. (2008, 2013).
Given a set of N points (nodes) in a 2-dimensional space, we can compute the set {λi} of weighted edges
connecting them. For a set of points in a Carte-sian frame, the edges are the lines joining the nodes, weighted by their length. The MST is a graph without closed loops (tree) connecting all the nodes with the minimum total weight, min[Σiλi].
We divided the LAT sky in several regions to take into account the presence of the Galactic emission and considered the photon arrival directions as nodes in a graph, with the angular distance between them as the edge weight. Once the MST was computed for each region, a set of subtrees corresponding to clusters of photons was extracted by means of the following oper-ations: i) separation: by removing all the edges having a length λ > Λcut, the separation value, a set of
discon-nected sub-trees is obtained; ii) elimination: by remov-ing all the sub-trees havremov-ing a number of nodes n≤ Ncut
to eliminate very small casual clusters of photons, only the clusters having a size above this threshold are left. The separation value is usually defined in units of the mean edge length Λm = (Σiλi)/N in the MST.
The remaining set of sub-trees provides a first list of candidate γ-ray sources and a secondary selection must be done to select the most robust candidates, remov-ing the greatest number of spurious/random clusters. Campana et al. (2013) proposed a useful indicator for this selection, the so-called magnitude of the cluster, defined as:
Mk = nkgk (1)
where nk is the number of nodes in the cluster k and
gk is the clustering parameter :
gk= Λm/λm,k (2)
that is the ratio between the mean edge length over the entire tree and the mean edge length of the k-th cluster. The magnitude M quantifies the trade-off between the number of photons (n) and their “clumpiness” (g): a small tree in terms of photons can be highly clus-tered and therefore significant. M was shown to be a good parameter for evaluating the “goodness” of the accepted clusters. On the basis of tests performed in simulated and real Fermi -LAT fields, Campana et al. (2013) verifed that √M has a high linear correlation
with other statistical significance parameters, derived from a wavelet based algorithm and from maximum likelihood analysis, and that it can be used as a good estimator of statistical significance of MST detections. In particular, threshold values of M above 15–17 are shown (Campana et al. 2013) to reject the large major-ity of spurious (low significance) clusters.
Another useful parameter is the median radius Rm,
i.e. the radius of the circle centred at the cluster cen-troid and containing the 50% of photons in the cluster, that for a cluster that can be associated with a genuine pointlike γ-ray source should be smaller than or compa-rable to the 68% containment radius of the instrumen-tal Point Spread Function (PSF). For Fermi -LAT1, this
radius varies from 0.◦35≡ 210 at 3 GeV to 0.◦2 ≡ 120 at
10 GeV (see also Ackermann et al. 2013a). Moreover, we also expect that the angular distance between the positions of the cluster centroid and the possible optical counterpart are lower than the latter value.
3 Detection of γ-ray emission associated with BL Lac objects
LAT data (Pass 7 reprocessed v15, event class 2) above 10 GeV, covering the whole sky in the∼6.3 years time range from the start of mission (2008 August 04) up to 2014 December 04, were downloaded from the FSSC archive2. Standard cuts on the zenith angle (100◦) and
data quality were applied.
The sky far from the Galactic plane (|b| ≥ 20◦) was
then divided in several broad regions to take into ac-count the Galactic latitude dependence of the back-ground level and consequently of the S/N ratio. In each region the MST was computed and clusters were ob-tained using a cut length Λcut= 0.75 Λm and a
thresh-old number Ncutof 4 photons in a cluster. Then a
sec-ondary selection was performed limiting the M value to be higher than 15. The large majority of selected clus-ters resulted in a very good positional agreement with the corresponding 3FGL (Acero et al. 2015) and 1FHL sources. As an example, on the explored extra-Galactic sky the 1FHL catalogue reports 268 sources. Within a matching distance equal to the 95% containment ra-dius (0.◦5
≡ 300) from them we found 258 corresponding
MST clusters passing the primary selection. Almost all of these clusters (∼99%) have a magnitude M > 15, thus passing also the secondary selection.
1http://www.slac.stanford.edu/exp/glast/groups/canda/
lat Performance.htm
We also found several clusters not reported as sources in these catalogues. We searched for associ-ations of the unreported clusters with the 5BZCAT (Massaro et al. 2014, 2015), that contains 3561 sources classified as classical BL Lac objects (BZB), galaxy-dominated blazars (BZG), flat-spectrum radio quasars (BZQ) and blazars of uncertain type (BZU). We did not perform any a priori selection criteria on the radio flux.3 The matching radius for the association is 0.◦1
≡ 60, smaller than the PSF radius at the considered
energies. This value can be justified looking at Fig-ure 1, that shows the angular separation between the 467 MST cluster centroids that have a correspondence with 3FGL sources within a 300 matching distance, and
the safe 5BZCAT counterpart (thus with a very pre-cise optical and radio location) to which the latter ones were associated. The large majority (∼90%) of these sources, even for weaker clusters (red histogram in Fig-ure 1, corresponding to clusters with a number of nodes n≤ 12) have a separation smaller than 60.
We found 19 high-energy photon clusters, without any correspondence with the 3FGL and 1FHL cata-logues, having thus a position very close to the accurate optical and radio ones of BL Lac objects. Twelve of them have M > 18 and, according to the simulations by Campana et al. (2013) their probability to be spu-rious, based on this parameter alone, is expected to be lower than 2%.
One must be aware that the finding of a cluster is ba-sically an indication of the presence of a small region in which the photons are denser than in the surroundings, and it does not necessarily correspond to an actual γ-ray source with the expected properties according to the instrumental response. This can be estabilished only by a further analysis that takes into account these proper-ties. In practice, we verified in the entire extragalactic sky (|b| > 15◦) that all clusters at energies above 10
GeV having M > 32 and about one third of those with 15 < M < 20 have a firm 3FGL counterpart.
Under this respect cluster analysis is important for investigating the population of sources with a photon number too low for obtaining a significant matching with the PSF profile.
Figure 2 presents a map of a large sky region illus-trating this result: it contains 30 γ-ray MST clusters of which 25 are coincident with 3FGL sources (12 also 3The fact that some sources are faint in the radio is typical of
HBL objects. The 3LAC catalogue, for instance, includes 48 sources with a radio flux at 1.4 GHz lower than 10 mJy (about all of HSP type). Considering the fact that we are searching for faint gamma-ray sources (the bright ones are already in the 3FGL catalogue!) it reasonable to assume they could be also faint in the radio band.
with 1FHL sources), while 3 of the 5 unassociated clus-ters match the position of BL Lac objects.
0 5 10 15 20 25 30 Separation [arcmin] 0 20 40 60 80 100 120 140 Sour ces/bin
Fig. 1 Histogram of the angular separation between the lo-cations of the 5BZCAT counterparts of the identified 3FGL sources with respect to the MST cluster centroid. The black line refers to all the clusters, the red line to the clusters hav-ing n ≤ 12.
Table 1 lists the main properties of the newly found clusters and their associated BL Lac objects. In this table the coordinates of cluster centroids and the rel-evant MST parameters are reported, with some astro-physical data, like optical magnitudes, redshift, and the Log Φxr, the normalised ratio between the X-ray to the
radio flux: Φxr= 10
2F
X/S1.4∆ν (3)
where FX is in the band 0.1–2.4 keV in units of 10−12
erg cm−2 s−1 and S
1.4 is the radio flux density at
1.4 GHz in mJy with a bandwidth ∆ν of 1 GHz. This dimensionless parameter (Massaro et al. 2012) can be used as a simple indicator if a BL Lac object would be classified HBL (High Energy peaked BL Lacs) or LBL (Low Energy peaked BL Lacs) depending if its decimal logarithm is higher or lower than 0.25.
Note that the median radius Rm is within the 68%
containment PSF radius and that the highest angular separation is 5.07, smaller than the 50% of this radius,
confirming the robustness of the spatial association. Assuming a prevailing uniform random origin of the diffuse background (far from the Galactic plane) the significance of a cluster detection can be estimated by means of the probability to find a cluster having the similar N , g and M in a large set of randomly dis-tributed photons. We generated 10000 simulated ran-dom fields with 50, 125 and 200 points, reflecting the typical number of photons in the 20 different 6◦
180 190 200 210 220 230 240
Galactic longitude [deg]
20 25 30 35 40 45 50 55 60
Galactic
latitude
[deg]
Fig. 2 A large region of the sky in Galactic coordinates (60◦×40◦
) showing the MST γ-ray source detections at energies higher than 10 GeV (red circles), superposed to BL Lac objects in the 5th Edition of the Roma-BZCAT (black crosses) and to the 3FGL and 1FHL γ-ray source catalogues (blue and orange squares, respectively). Note the excellent positional agreement between MST and 3FGL counterparts. Two MST clusters are unassociated and three other correspond to BL Lac objects but not to 3FGL catalogue sources (black triangles).
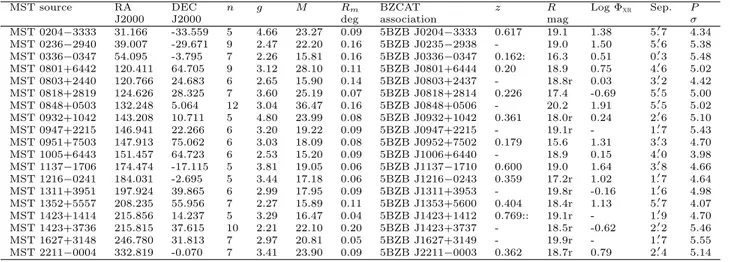
Table 1 New MST sources observed at E > 10 GeV and their 5BZCAT associations. Columns 2–7 report the MST
parameters of the MST cluster. Source data in columns 8–11 are from 5BZCAT. Magnitudes with the r code are from SDSS DR10; the symbols : and :: indicate uncertain and very uncertain data. Column 12 shows the angular separation between the cluster centroid and the 5BZB source. The last column reports the detection significance in equivalent Gaussian standard deviations, see text for details.
MST source RA DEC n g M Rm BZCAT z R Log Φxr Sep. P
J2000 J2000 deg association mag σ MST 0204−3333 31.166 -33.559 5 4.66 23.27 0.09 5BZB J0204−3333 0.617 19.1 1.38 5.07 4.34 MST 0236−2940 39.007 -29.671 9 2.47 22.20 0.16 5BZB J0235−2938 - 19.0 1.50 5.06 5.38 MST 0336−0347 54.095 -3.795 7 2.26 15.81 0.16 5BZB J0336−0347 0.162: 16.3 0.51 0.03 5.48 MST 0801+6442 120.411 64.705 9 3.12 28.10 0.11 5BZB J0801+6444 0.20 18.9 0.75 4.06 5.02 MST 0803+2440 120.766 24.683 6 2.65 15.90 0.14 5BZB J0803+2437 - 18.8r 0.03 3.02 4.42 MST 0818+2819 124.626 28.325 7 3.60 25.19 0.07 5BZB J0818+2814 0.226 17.4 -0.69 5.05 5.00 MST 0848+0503 132.248 5.064 12 3.04 36.47 0.16 5BZB J0848+0506 - 20.2 1.91 5.05 5.02 MST 0932+1042 143.208 10.711 5 4.80 23.99 0.08 5BZB J0932+1042 0.361 18.0r 0.24 2.06 5.10 MST 0947+2215 146.941 22.266 6 3.20 19.22 0.09 5BZB J0947+2215 - 19.1r - 1.07 5.43 MST 0951+7503 147.913 75.062 6 3.03 18.09 0.08 5BZB J0952+7502 0.179 15.6 1.31 3.03 4.70 MST 1005+6443 151.457 64.723 6 2.53 15.20 0.09 5BZB J1006+6440 - 18.9 0.15 4.00 3.98 MST 1137−1706 174.474 -17.115 5 3.81 19.05 0.06 5BZB J1137−1710 0.600 19.0 1.64 3.08 4.66 MST 1216−0241 184.031 -2.695 5 3.44 17.18 0.06 5BZB J1216−0243 0.359 17.2r 1.02 1.07 4.64 MST 1311+3951 197.924 39.865 6 2.99 17.95 0.09 5BZB J1311+3953 - 19.8r -0.16 1.06 4.98 MST 1352+5557 208.235 55.956 7 2.27 15.89 0.11 5BZB J1353+5600 0.404 18.4r 1.13 5.07 4.07 MST 1423+1414 215.856 14.237 5 3.29 16.47 0.04 5BZB J1423+1412 0.769:: 19.1r - 1.09 4.70 MST 1423+3736 215.815 37.615 10 2.21 22.10 0.20 5BZB J1423+3737 - 18.5r -0.62 2.02 5.46 MST 1627+3148 246.780 31.813 7 2.97 20.81 0.05 5BZB J1627+3149 - 19.9r - 1.07 5.55 MST 2211−0004 332.819 -0.070 7 3.41 23.90 0.09 5BZB J2211−0003 0.362 18.7r 0.79 2.04 5.14
fields used for verifying the detection significance. As-suming that Ns, gs and Msare the values of these
pa-rameters for a particular source, the number of ran-dom generated clusters with N ≥ Ns, g ≥ gs and
M ≥ Ms, divided by the total number of random
clus-ters, provides the upper limit to the probability that the source is of spurious origin. Moreover, one has to evaluate the probability that the found cluster is lo-cated at a short angular distance from a BL Lac ob-ject not already associated with a γ-ray source. Sim-ple estimates for these probabilities can be obtained as the ratio between the solid angle of a circle having the radius equal to the angular separation between the BL Lac objects and the cluster centroids, to the solid angle covered by the 6◦×6◦ regions used for verifying
the detection significance, eventually multiplied for the number of known BL Lac objects inside the field, with the exclusion of those already associated with known γ-ray sources. These ratios range from 6.2· 10−5 for
5BZB J1311+3953 to 7.9· 10−4for 5BZB J0204
−3333, the source with the largest angular separation. Com-bining these two independent probabilities we obtain the final significance of a detection, expressed as the probability P in equivalent Gaussian standard devia-tions, for a chance coincidence of a spurious cluster with a known BL Lac object (Table 1). For all clusters these combined significances are above 3.98σ, while for more than half of them it is in excess of 5σ.
Fifteen of the 19 sources reported in Table 1 do not have another 5BZCAT source associated within a 0.◦5
≡ 300 radius. For three of the remaining 4 sources,
the other possible associations are much weaker than the proposed ones, being sufficiently far away (more than 150 distant). The last source, and some of the
other associations between 5BZCAT blazars and MST clusters, will be discussed in the following Section. Re-garding the possibility to have a counterpart to these clusters different from a BL Lac object, in general in the same search radius there are only few weak radio sources (e.g. reported by the NVSS4 and FIRST5
cat-alogues) usually without a safe optical counterpart, or for MST 1423+1414 a faint optical (SDSS) quasar un-detected in the radio band. Other possible associations as narrow-line Seyfert 1 objects or classified radio galax-ies are not found. The association with 5BZCAT ob-jects appears therefore much more robust than for other sources.
To increase the confidence on these detections we performed a MST cluster search in rather small regions centered at the cluster position and having a size of 4http://www.cv.nrao.edu/nvss/
5http://sundog.stsci.edu/first/catalogs/readme.html
about 6◦
× 6◦. All clusters upon consideration were
confirmed and they were the only unassociated sources with M > 15. The only exception was a cluster in the field of MST 1423+3736 at about 2.◦4. Furthermore,
we performed a similar check considering also photon energies higher than 3 GeV and again the candidate se-lections were found, with similar MST cluster parame-ters, with the only exception of MST 0951+7503, that was undetected.
We extracted also aperture photometry light curves for all the 19 candidate sources in various energy bands. With the exception of MST 1423+3736 (see Sect. 4.8) there is no evidence of variable activity or flares for the other sources.
3.1 Results from likelihood analysis
We performed also a standard unbinned likelihood anal-ysis for each MST cluster. A Region of Interest (ROI) of 10◦ radius was selected centered at the MST
clus-ter centroid, and standard screening criclus-teria were ap-plied to the Fermi -LAT data above 3 GeV. The likeli-hood analysis was performed considering all the 3FGL sources within 20◦ from the cluster centroid, as well as
the Galactic and extragalactic diffuse emission. A fur-ther source with a power-law spectral distribution was assumed at the MST coordinates. The normalization and spectral index of all the 3FGL sources within the ROI was allowed to vary in the fitting, while the pa-rameters of the sources between 10◦ and 30◦ from the
center of the field of view were fixed to their catalogue values. From this analysis, we derived the likelihood Test Statistics (T S) and fluxes in the two 3–300 and 10–300 GeV bands. The results are reported in Table 2. Eight of the 19 MST clusters are significant from a like-lihood analysis standpoint (T S > 25) and therefore can be considered confirmed γ-ray sources; other six clus-ters have a T S value between 16 and 25, while only four have T S < 16. For MST 0848+0503 no significant re-sult was obtained because of a confusion problem with a another close blazar (see the discussion on Section 4.5). Fluxes above 3 and 10 GeV between a few 10−10–10−11
ph cm−2s−1 are obtained for the safe sources whereas
for those having a T S value below the conventional sig-nificance threshold (T S = 25, corresponding to 5σ) up-per limits were computed. Note that three of the four clusters with the lowest significance have also low M values (15.81, 15.90, 17.95) while only MST 0801+6442 has a magnitude of 28.10, that is due to the relatively high number of photons in the cluster. This particular case will be discussed in more detail in Sect. 4.2.
192 193 194 195 196 197 Galactic longitude [deg] 28 29 30 31 32 33 Galactic latitude [deg] 5BZB J0818+2814 221.0 221.5 222.0 222.5 223.0 223.5 224.0
Galactic longitude [deg] 27.0 27.5 28.0 28.5 29.0 29.5 30.0 Galactic latitude [deg] 5BZB J0848+0506
Fig. 4 γ-ray sky maps in Galactic coordinates of the regions centered around the BL Lac objects 5BZB J0818+2814 (left
panel) and 5BZB J0848+0506 (right panel), both having a rather close BL Lac object. Orange circles mark the photon coordinates at energies higher than 3 GeV and the black ones at energies higher than 10 GeV; black crosses corresponds to the optical coordinates of BL Lac objects in the 5BZCAT, blue open squares are the 3FGL sources, the open red circles
are the MST cluster positions in the 10 GeV field, while the magenta diamonds are the positions of sources in the D3PO
catalogue.
133 134 135 136 137 138 139
Galactic longitude [deg] 34 35 36 37 38 39 40 Galactic latitude [deg] 5BZB J0952+7502 58 59 60 61 62 63 64
Galactic longitude [deg] −46 −45 −44 −43 −42 −41 −40 Galactic latitude [deg] 5BZB J2211−0003
Fig. 5 Photon sky maps in Galactic coordinates of the regions around the BL Lac objects 5BZB J0952+7502 (left panel)
and BZB J2211−0003 (right panel). The longitude scale has been multiplied by the cosine of the mean latitude for a better imaging of angular distances. Orange circles mark the photon coordinates at energies higher than 3 GeV, magenta circles at energies higher than 6 GeV and the black ones at energies higher than 10 GeV; black crosses correspond to the optical coordinates of BL Lac objects in the 5Roma-BZCAT while black x-symbols are blazars of other type, blue open squares are the 3FGL sources, the open red circles are the MST cluster positions in the 10 GeV field and the open turquoise circle
64 65 66 67 68 69 70 Galactic longitude [deg] 65 66 67 68 69 70 71 Galactic latitude [deg] 5BZB J1423+3737 0.0 0.2 0.4 0.6 0.8 1.0 1.2 1.4 E ≥ 100 MeV 54500 55000 55500 56000 56500 57000 Time [MJD] 0.00 0.01 0.02 0.03 0.04 Flux [× 10 − 7ph cm − 1s − 1] E ≥ 3 GeV
Fig. 6 Photon sky map in Galactic coordinates of the region around the BL Lac objects 5BZB 1437+3737 (left panel),
and aperture photometry light curve (right panel). The longitude scale has been multiplied by the cosine of the mean latitude for a better imaging of angular distances. Orange circles mark the photon coordinates at energies higher than 3 GeV, magenta circles at energies higher than 6 GeV and the black ones at energies higher than 10 GeV; black crosses correspond to the optical coordinates of BL Lac objects in the 5Roma-BZCAT while black x-symbols are blazars of other type, blue open squares are the 3FGL sources, the open red circles are the MST cluster positions in the 10 GeV field and
the open turquoise circle at energies above 3 GeV, while the magenta diamonds are the positions of sources in the D3PO
catalogue. The two gray circles indicate the locations of the two galaxy clusters A 1902 and A 1914.
4 Comments on individual sources
Many of the newly associated BL Lac objects (10 over 19) have a value of Log Φxr typical of HBL. SDSS
DR10 photometric data are available for four of the other six sources with an LBL value and their u− r colours are smaller than 1.4, that according to Massaro et al. (2012) can be taken as the discriminating value between BL Lacs having a nucleus or galaxy dominated emission.
In the following we discuss in more detail some clus-tering properties of a few sources of the sample. 4.1 5BZB J0204−3333
The association of the MST photon cluster MST 0204−3333 with 5BZB J0204−3333 should be con-sidered not safely confirmed, since at a separation of 50 from the cluster centroid the rather bright
flat spectrum radio source PKS J0204−3328 (AT20G J020428−332849) is present, for which an indication for a galaxy type counterpart of magnitude B = 23.1 is reported (Titov and Malkin 2009). MST analysis in the same field at energies higher than 5 GeV gives a more conspicuous cluster (N = 10, M = 31.9) but fails to solve the positional ambiguity because photons are distributed around both sources.
4.2 5BZB J0801+6444
As already noticed above the association of the cluster MST 080166442 with BZB J0801+6444 appears some-what unsafe because the likelyhood analysis gives a low √
T S= 3.3, despite the high M value. A further anal-ysis with the lower Λcut = 0.7 reduces the number of
photons in the cluster from 9 to 6 but increases the clustering factor g to 3.50 giving again a rather robust M = 20.99. Moreover, the centroid of the new cluster is at an angular seperation from the possible counterpart of only 2.04, reducing the chance association
probabil-ity. This result could be an indication that the cluster can be affected by some photons of the local background that is reduced using a stronger cut length. MST search at energies higher than 3 GeV in a 10◦×10◦region gives
a more robust detection of a 15 photon cluster with M = 38.00 and centroid coordinates at a very small separation (1.03) from the BL Lac object.
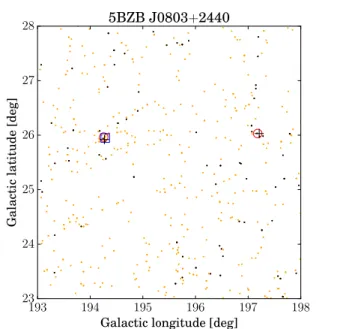
4.3 5BZB J0803+2440
This blazar and 5BZB J1352+5557 are associated with the two clusters having the lowest M values in the sam-ple, but while the latter appears nearly validated by the ML analysis, the results on a possible γ-ray source close
Table 2 Standard unbinned likelihood analysis of the Fermi -LAT data, see text for details. The last two columns
report photon fluxes in units of 10−11 ph cm−2s−1. For
sources below the usual significance threshold (T S = 25) only upper limits are given.
MST cluster √T S Flux Flux
3–300 GeV 10–300 GeV MST 0204−3333 4.0 ≤ 6.7 ≤ 1.0 MST 0236−2940 4.6 ≤ 7.2 ≤ 1.3 MST 0336−0347 3.9 ≤ 5.5 ≤ 1.4 MST 0801+6442 3.3 ≤ 4.0 ≤ 0.4 MST 0803+2440 3.5 ≤ 4.1 ≤ 0.8 MST 0818+2819 5.0 6.9 ± 2.4 2.3 ± 1.1 MST 0848+0503 — — — MST 0932+1042 5.4 7.9 ± 2.7 2.1 ± 1.1 MST 0947+2215 5.8 9.5 ± 2.9 2.2 ± 1.1 MST 0951+7503 4.6 ≤ 4.2 ≤ 1.6 MST 1005+6443 5.0 6.3 ± 2.1 1.5 ± 0.8 MST 1137−1706 6.7 14.0 ± 3.4 2.5 ± 1.1 MST 1216−0241 5.0 6.4 ± 2.5 2.4 ± 1.2 MST 1311+3951 2.9 ≤ 3.6 ≤ 2.5 MST 1352+5557 4.8 ≤ 7.9 ≤ 4.8 MST 1423+1414 4.4 ≤ 5.2 ≤ 1.4 MST 1423+3736 12.1 22.8 ± 3.7 4.3 ± 1.5 MST 1627+3148 7.0 10.3 ± 2.9 2.4 ± 1.2 MST 2211−0004 4.6 ≤ 7.6 ≤ 1.6
to 5BZB J0803+2440 give a rather poor significance (see Table 2). Nevertheless, there is some indication for a safer detection and a more robust association of the cluster with 5BZB J0803+2440. When selecting a smaller region of about 5◦× 5◦ and applying a stronger
cut with Λcut = 0.5 in order to reduce possbile the
background contribution from distant photons we found above 10 GeV only two clusters (see Figure 3): one with 5 photons and M = 18.93 nearly coincident with the previous one (RA = 120.760, DEC = 24.567) at the closer angular distance of 1.096 from the blazar; and
an-other cluster with only 4 photons and a lower clustering parameter (M = 13.92) that corresponds to the 3FGL J0758.9+2705 source which is very close to the other blazar 5BZG J0758+2705. When considering energies higher than 3 GeV the latter cluster is much richer and has a very significant M = 60.9, while MST 0803+2440 is found with a very low M because it disappears in the stronger background. This could be an explanation of why at these energies ML results are poor. It is there-fore possible that 5BZB J0803+2440 has a quite hard γ-ray spectrum that makes it detectable only at high energies and for this reason one can consider the as-sociation of the cluster with the BL Lac object as an interesting indication.
193 194 195 196 197 198
Galactic longitude [deg] 23 24 25 26 27 28 Galactic latitude [deg] 5BZB J0803+2440
Fig. 3 γ-ray sky maps in Galactic coordinates
of the regions centered around the BL Lac objects 5BZB J0803+2440. Black circles mark the photon coordi-nates at energies higher than 10 GeV and orange ones above 3 GeV; black crosses corresponds to the optical coordinates of BL Lac objects in the 5BZCAT, blue open squares are the 3FGL sources, the open red circles are the MST cluster positions in the 10 GeV field.
4.4 5BZB J0818+2814
This BL Lac object is located at angular distance of about 290 to 5BZB J0819+2747, which is associated
with the known γ-ray source 3FGL J0818.8+2751. The sky map in Figure 4 (left panel) clearly shows a pho-ton cluster around 5BZB J0819+2747 at energies higher than 3 GeV. Photons above 10 GeV are densely located only around the position of 5BZB J0818+2814, while none is found close to the position of the other source. Consider also that the cluster has a quite high g and a corresponding median radius of about only 40, that corresponds to about 15% of the separation between sources. It appears, therefore, unlikely that photons in the MST cluster could be originated by a distant source without any concentration at the expected position.
A source at an intermediate position between our source and that of 3FGL J0818.8+2751 (see Figure 4) is also reported in the D3PO catalogue6 (Selig et al.
2014), without indication of a possibile counterpart. 6The Denoised, Deconvolved, and Decomposed Fermi γ-ray Sky,
4.5 5BZB J0848+0506
A photon cluster is found at the angular separation of 12.02 from the gamma-ray source 3FGL J0849.3+0458,
which is in the 2FGL and 2LAC catalogues and is reported as the counterpart to the BL Lac object 5BZB J0849+0455. This source is also in the D3PO
catalogue, while there is no high-energy MST detec-tion at these coordinates. However, at energies higher than 10 GeV, this angular separation between the cen-troid coordinates and the blazar results quite higher than the mean association distance (see Sect. 3 and Fig. 1) and therefore the connection between the clus-ter and the BL Lac object is rather weak. The clusclus-ter centroid is at a separation of 5.05 from another BL Lac
object, 5BZB J0848+0506, that is not yet detected at γ-ray energies. The map in Figure 4 (right panel) illus-trates this situation: a high concentration photon clus-ter is located very close to 5BZB J0848+0506 and not at the position of 5BZB J0849+0455. A significant clus-ter (M = 33) is also found by MST at energies higher than 30 GeV, where the mean spatial density of pho-tons in the region is very low. On the other hand, when repeating the MST analysis in the LAT field above 3 GeV we find a unique rich cluster with a very high MST magnitude (M = 88) and very precisely located at the 5BZB J0849+0455 coordinates.
In these conditions it is hard to obtain a safe estimate the actual significance of the cluster MST 0848+0503 and its association with 5BZB J0848+0506 because there is no way to exclude photons from the other close bright BL Lac object that can accidentally be found in the MST cluster, the richest in the present sam-ple. Note also that in Table 1 this BL Lac has the highest value of Log ΦXR, while no X-ray detection
of 5BZB J0849+0455 is reported in the 5BZCAT. One can infer that the former source is a HBL object, and consequently with a particularly hard γ-ray spectrum, while the latter might be an LBL object with a possible high energy cut-off. In the 3FGL catalogue there are 14 sources associated with BL Lac objects with a radio flux density at 1.4 GHz lower than 10 mJy but detected in the X rays, as expected for HBL objects. Therefore, our association is not in contrast with previous results on γ-ray emission from this class of sources.
We can conclude, therefore, that both BL Lac ob-jects are high energy emitters but their spectra are very different.
4.6 5BZB J0952+7502
The sky map of the region around 5BZB J0952+7502 has a higher density of photons but a relative low num-ber of γ-ray sources (Figure 5, left panel). There are
only two MST cluster detections above 10 GeV. The first corresponds to a 3FGL and D3PO source very close
to the blazar 5BZU J1031+7441, while the second clus-ter is detected only at energies higher than 10 GeV. Ex-cluding the farthest photon from the cluster, the new g and M are increased and also the positional matching improves, making stronger the association with this BL Lac object. Finally, the spectrum of this source must be rather peculiar with a possible turn off at low ener-gies because it is undetected when enerener-gies higher than 3 GeV are considered.
4.7 5BZB J1311+3953
The detection of the cluster MST 1311+3951 is rather critical because it presents three close photons sur-rounded by a few other photons which could be back-ground events. A cluster of 7 photons is found at ener-gies higher than 6 GeV in a 10◦× 10◦ region, but with
a rather low g, whereas there is no detection when a lower energy threshold of 3 GeV is considered. This explain the quite low√T S= 2.9 value found from the ML analysis. It is interesting to note that the D3PO
catalogue reports a source (1DF002707) with a photon flux of about 5.0 10−11 ph/(cm2 s) and Galactic
coor-dinates l = 105.◦811, b = 76.◦446. The angular distance
to the centroid of MST 1311+3951 is 8.07, too large for
a firm association, but small enough for suggesting a region with a possible extended emission or source con-fusion.
At energies higher than 10 GeV in a 6◦ size
re-gion MST analysis confirmed this cluster (M = 19.48) and found only one very significant cluster at the posi-tion of 5BZB J1309+4305 (3FGL J1309.3+4304). In a wider 10◦size region there are three other blazars listed
in the Roma-BZCAT, two of them associated with 3FGL sources: 5BZB J1305+3855, 5BZQ J1308+3546 (3FGL J1308.7+3545) and 5BZB J1309+4305 (3FGL J1309.3+4304). We found at energies higher than 3 GeV again only one very significant cluster correspond-ing to the last one, in any case these blazars are well separated from MST 1311+3951 to produce any confu-sion.
We can conclude that there are some interesting indications for an high energy emission related to 5BZB J1311+3953, although it is quite difficult to ob-tain an entirely satisfactory statistical significance. 4.8 5BZB J1423+3737
This source is the brightest in the sample and above 3 GeV its position correspond to a high density and rich cluster (Figure 6, left panel) In the same field there
are two 3FGL sources (3FGL J1411.1+3717 and 3FGL J1419.8+3819) at a separation higher than 1◦ and two
D3PO sources, one of which corresponding to the
lat-ter object and the other close to 5BZG J1424+3705, but none of them associated with this BL Lac object. Note that this object was already reported as a possible counterpart to 3EG J1424+3734 in the Third EGRET catalogue (Hartman et al. 1999), although at a distance of about 210. It was also present in 1FGL and 1LAC
(Abdo et al. 2010) catalogues, but disappeared in the subsequent versions. The EGRET source was also asso-ciated by Colafrancesco (2002) with the nearby galaxy clusters A 1902 and A 1914, whose locations are marked in the map of Figure 6 by two gray circles.
Two light curves of the events at energies above 0.1 and 3 GeV from a circular region of radius 0.◦3 centered at the source position (see Figure 6, right panel) were extracted. A flare in which the count rate increased by a factor of about 5, reaching >100 MeV fluxes around 10−7 photons cm−2 s−1 (
∼3·10−9 photons cm−2 s−1
above 3 GeV) and having a duration of∼3 months is clearly apparent in the period from MJD 56550 to 56650 (2013 September–December), making more robust the identification of this 5BZB J1423+3737 as the counter-part to the γ-ray source. Moreover, this variability and the finding that no high energy photons are observed from the two near galaxy clusters seems to discount the possibility that these objects are powerful emitters of high energy γ-rays.
4.9 5BZB J2211−0003
This is one of the most crowded field of blazars con-taining four BL Lac objects and two other type blazars (possibly FSRQ, Figure 5, right panel) There is only one 3FGL source which corresponds to the unique D3PO
source and is associated with 5BZB J2206−0031. MST analysis above 3 GeV gives three significant clusters (open turquoise circles): one corresponding to this source, another related to a high concentration of a small number of photons at l = 62.77, b =−49.93, and the third one very close to 5BZB J2211−0003. The last cluster is the only significant one found at energies higher than 10 GeV.
About the unassociated source we found an interest-ing possible radio counterpart, NVSS J223510−033332, at an angular separation of 6.750with a radio flux
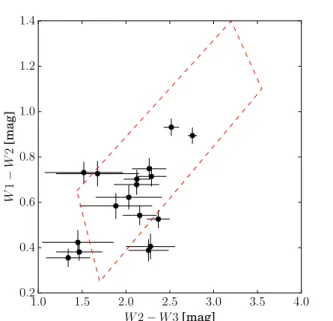
den-sity at 1.4 GHz of 93 mJy. It corresponds in SDSS DR10 to a starlike object with r = 19.45 mag and u−r = 0.90, typical of many HBL objects detected in the γ-ray band (Massaro et al. 2012). 1.0 1.5 2.0 2.5 3.0 3.5 4.0 W 2− W 3 [mag] 0.2 0.4 0.6 0.8 1.0 1.2 1.4 W 1 − W 2 [mag]
Fig. 7 Plot of the infrared colours of the MST-selected BL Lac objects from the AllWISE catalogue. The dashed line define the region where the WISE Blazar strip is located according to the recent analysis by D’Abrusco et al. (2014). The majority of our sources lie within the strip and those outside the boudaries are generally affected by large errors making possible their location inside the γ-ray loud region.
5 Discussion
The new detections of γ-ray clusters closely associ-ated with BL Lac objects at energies higher than 10 GeV confirm the high sensitivity of MST method in extracting small photon concentrations from a sparse background. This fact makes the method particularly able in detecting weak sources that, when observed at lower energies, could be confused with the back-ground. We are confident that our detections are ro-bust, not only for their high M values but also be-cause the chance probabilities for such a good positional correspondence are indeed quite low. The two sources 5BZB J0801+6444 and 5BZB J1216−0243 are reported in the 5BZCAT as BL Lac candidates because their op-tical spectra are unpublished. Clearly our detection support their identification as genuine blazars.
We obtained also the significance of these clusters by evaluating their test statistics applying the stan-dard LAT maximum likelihood method at energies higher than 3 GeV in ROI of 10◦ radius: for 14
clus-ters we obtained values of T S higher than 16 (8 of which with T S > 25). For only 5BZB J0848+0506 we failed to obtain convergence because of the proximity of 5BZB J0849+0455. These results provide a practi-cal validation of the minimal spanning tree clustering method to select candidate sources.
We also verified if the infrared colors of the reported BL Lac objects are compatible with the WISE blazar strip, discovered by Massaro et al. (2011, 2012) where the majority of γ-ray loud sources of this type are lo-cated. We obtained three band infrared photometric data from the AllWISE catalogue (Cutri and et al. 2014, data at 22 µm are available only for three sources) and computed the W 1−W 2 and W 2−W 3 colours with-out reddening correction because all the sources have a Galactic latitude higher than 25◦. Figure 7 shows that
the majority of these newly observed BL Lacs above 10 GeV are really aligned along the strip, whose approxi-mate countour is marked by the red dashed line on the basis of the most recent plots given by D’Abrusco et al. (2014) (WIBRaLS catalogue). Sources outside the strip have photometric uncertainties large enough that they are also compatible generally within one standard de-viation. Note, however, that only 5BZB 1437+3737 is reported in the WIBRaLS catalogue as class C object because it is one of the three sources detected in the 22 µm WISE bandpass.
We acknowledge use of archival Fermi data. We made large use of the online version of the Roma-BZCAT and of the scientific tools developed at the ASI Science Data Center (ASDC), of the Sloan Digi-tal Sky Survey (SDSS) archive, of the NED database and other astronomical catalogues distributed in digi-tal form (Vizier and Simbad) at Centre de Dates as-tronomiques de Strasbourg (CDS) at the Louis Pasteur University.
References
Abdo, A.A., Ackermann, M., Ajello, M., Allafort, A., An-tolini, E., Atwood, W.B., Axelsson, M., Baldini, L., et al.: Astrophys. J. 715, 429 (2010)
Acero, F., Ackermann, M., Ajello, M., Albert, A., Atwood, W.B., Axelsson, M., Baldini, L., Ballet, J., et al.: Astro-phys. J. Suppl. Ser. 218, 23 (2015)
Ackermann, M., Ajello, M., Allafort, A., Asano, K., At-wood, W.B., Baldini, L., Ballet, J., Barbiellini, G., et al.: Astrophys. J. 765, 54 (2013a)
Ackermann, M., Ajello, M., Allafort, A., Atwood, W.B., Baldini, L., Ballet, J., Barbiellini, G., Bastieri, D., et al.: Astrophys. J. Suppl. Ser. 209, 34 (2013b)
Bernieri, E., Campana, R., Massaro, E., Paggi, A., Tra-macere, A.: Astron. Astrophys. 551, 5 (2013)
Campana, R., Massaro, E., Gasparrini, D., Cutini, S., Tra-macere, A.: Mon. Not. R. Astron. Soc. 383, 1166 (2008) Campana, R., Bernieri, E., Massaro, E., Tinebra, F., Tosti,
G.: Astrophys. Space Sci. 347, 169 (2013)
Colafrancesco, S.: Astron. Astrophys. 396, 31 (2002) Cutri, R.M., et al.: VizieR Online Data Catalog 2328, 0
(2014)
D’Abrusco, R., Massaro, F., Paggi, A., Smith, H.A., Masetti, N., Landoni, M., Tosti, G.: Astrophys. J. Suppl. Ser. 215, 14 (2014)
Hartman, R.C., Bertsch, D.L., Bloom, S.D., Chen, A.W., Deines-Jones, P., Esposito, J.A., Fichtel, C.E., Friedlan-der, D.P., et al.: Astrophys. J. Suppl. Ser. 123, 79 (1999) Massaro, E., Nesci, R., Piranomonte, S.: Mon. Not. R.
As-tron. Soc. 422, 2322 (2012)
Massaro, E., Maselli, A., Leto, C., et al.: Multifrequency Catalogue of Blazars, 5th edn. Aracne Editrice, Rome (2014)
Massaro, E., Maselli, A., Leto, C., Marchegiani, P., Perri, M., Giommi, P., Piranomonte, S.: Astrophys. Space Sci. 357, 75 (2015)
Massaro, F., D’Abrusco, R., Ajello, M., Grindlay, J.E., Smith, H.A.: Astrophys. J. Lett. 740, 48 (2011)
Massaro, F., D’Abrusco, R., Tosti, G., Ajello, M., Gaspar-rini, D., Grindlay, J.E., Smith, H.A.: Astrophys. J. 750, 138 (2012)
Neronov, A., Semikoz, D., Vovk, I.: Astron. Astrophys. 529, 59 (2011)
Nolan, P.L., Abdo, A.A., Ackermann, M., Ajello, M., Al-lafort, A., Antolini, E., Atwood, W.B., Axelsson, M., Bal-dini, L., Ballet, J., et al.: Astrophys. J. Suppl. Ser. 199, 31 (2012)
Selig, M., Vacca, V., Oppermann, N., Enßlin, T.A.: ArXiv e-prints (2014). 1410.4562
Titov, O., Malkin, Z.: Astron. Astrophys. 506, 1477 (2009). 0911.3221
Tramacere, A., Vecchio, C.: Astron. Astrophys. 549, 138 (2013)