Alma Mater Studiorum – Università di Bologna
DOTTORATO DI RICERCA IN
SCIENZE BIOMEDICHE E NEUROMOTORIE
Ciclo XXX
Settore Concorsuale di afferenza: 06/D6 – NEUROLOGIA Settore Scientifico disciplinare: MED/26 – NEUROLOGIA
TITOLO TESI
THE ROLE OF MITOCHONDRIAL GENOME
IN INHERITED OPTIC NEUROPATHIES
Presentata da: DOTT. LEONARDO CAPORALI
Coordinatore Dottorato
Relatore
PROF. LUCIO COCCO
PROF. VALERIO CARELLI
Esame finale anno 2018
ABSTRACT
Leber’s hereditary optic neuropathy (LHON) is due in 90% of cases to three common point mutations affecting complex I subunit genes encoded by the mitochondrial genome (mtDNA). Besides these common mutations, there is a long and complex list of other mutations involved at various levels in the pathogenesis of LHON. On this scenario, we here report for the first time on the existence of LHON associated with peculiar combinations of individually non-pathogenic missense mtDNA variants, affecting the MT-ND4, MT-ND4L and MT-ND6 subunit genes of Complex I. The pathogenic potential of these mtDNA haplotypes is supported by multiple evidences: first, the LHON phenotype is strictly inherited along the maternal line in one very large family; second, the combinations of mtDNA variants are unique to the maternal lineages characterized by the recurrence of LHON; third, the Complex I-dependent respiratory and oxidative phosphorylation defect is co-transferred from the proband’s fibroblasts into the cybrid cell model. Finally, all but one of these missense mtDNA variants clustered along the same predicted fourth E-channel deputed to proton translocation within the transmembrane domain of Complex I, involving the ND1, ND4L and ND6 subunits. Hence, the definition of the pathogenic role of a specific mtDNA mutation becomes blurrier than ever and only an accurate evaluation of mitogenome sequence variation data from the general population, combined with functional analyses using the cybrid cell model, may lead to final validation. Our study conclusively shows that even in the absence of a clearly established LHON primary mutation, unprecedented combinations of missense mtDNA variants, individually known as polymorphisms, may lead to reduced OXPHOS efficiency sufficient to trigger LHON.With this complexity in mind, mtDNA genetic variation itself may play a modifying role in LHON. Many studies reported the association of LHON and a specific mitochondrial haplogroup classified as J. Here we present the largest sequence survey of the entire mtDNA ever performed assessing 119 independent probands from all Europe carrying the m.14484T>C/MT-ND6 mutation. Besides the occasional finding of double mutants, we confirm the association with the haplogroup J root, but not with its more recent sub-clades. The phylogenetic analysis suggests a possible double role of this haplogroup: it may act as predisposing factor to mutagenesis at m.14484T position, or preserving the pathogenic
mutation during evolution. On the clinical ground, the penetrance of LHON due to m.14484T>C/MT-ND6 mutation increases on the haplogroup J background, especially in females, and multiple founder haplogroup J events can be recognized in our cohort.
Considering the strong association of mtDNA haplogroups with LHON, we also investigated if a similar association may act on Dominant Optic Atrophy (DOA). This is another inherited optic neuropathy similar to LHON, caused by mutations in the OPA1 gene, which encodes for a protein essential for mitochondrial fusion and mitochondrial homeostasis. Our results indicated that the relationship of DOA with mtDNA genetic variation is complex: no specific haplogroups resulted strongly associated with DOA, neither clearly modified its clinical outcome. We only documented a minor effect of the mitogenome variation in DOA, in particular when compared with what it seems a definitely stronger role as modifier played by nDNA.
INDEX
INTRODUCTION 1 Mitochondria: origin, structure and functions 1 Oxidative Phosphorylation 2 Morphology 3 The mitochondrial genome: mtDNA 5 Mitochondrial genetics 8 Mitochondrial haplogroups 8 Leber’s hereditary optic neuropathy (LHON) 10 Dominant optic atrophy (DOA) 13 AIMS 15 RESULTS 17 PART 1 - Peculiar combinations of individually non-pathogenic missense mitochondrial DNA variants cause low penetrance Leber’s hereditary optic neuropathy 17 Pedigrees investigated 17Skeletal muscle investigations reveal normal activity of respiratory chain
complexes but increased mitochondrial biogenesis 18 Molecular investigations, protein conservation, frequency, and phylogenetic analyses of the identified variants 19 Cybrid studies 28 Modeling of the identified variants on the ovine Complex I structure 30 PART 2 - Mitochondrial DNA variability in Leber’s hereditary optic neuropathy 32 Mitochondrial genome sequencing and haplogroup affiliation 32 Evaluation of private missense variants 38 Phylogenetic analysis 40 Penetrance evaluation on available pedigree 42 PART III - Mitochondrial DNA variability in Dominant Optic Atrophy (DOA) with mutation in OPA1 gene 44 Mitochondrial genome sequencing and haplogroup affiliation 44 Private missense variants as phenotype modifiers 47 Mitochondrial haplogroups as phenotype modifier 50 DISCUSSION 54
Peculiar combinations of individually non-pathogenic missense mitochondrial
DNA variants cause low penetrance Leber’s hereditary optic neuropathy 56 Mitochondrial DNA variability in Leber’s hereditary optic neuropathy 61 Mitochondrial DNA variability in Dominant Optic Atrophy (DOA) with OPA1
mutations 63 Common features between LHON and DOA 65 CONCLUSIONS 66 MATERIALS AND METHODS 66 Patients 69 Sanger mtDNA sequencing 71 NGS mtDNA sequencing 73 Protein conservation analysis and homology modelling 73
mtDNA copy number quantification 73 Skeletal muscle investigation 74 Generation and maintenance of cybrids 75 Cell viability assessment 75 Oxygen consumption rate 75 ATP synthesis 76 Reactive oxygen species (ROS) assessment 76 Statistical analyses 76 BIBLIOGRAPHY 78
1
INTRODUCTION
Mitochondria: origin, structure and functions Mitochondria are unusual organelles. They primarily act as the powerhouse of the cell, but they are also involved in programmed cell death, calcium homeostasis and several biosynthetic pathways. They are wrapped by two membranes, they have their own genome, an independent protein synthesis apparatus, and can change their shape to adapt to the different metabolic needs of the cell, from discrete isolated organelles to a large network. Their origin, according to the endosymbiotic theory, was due to the increasingly oxygen-rich atmosphere and the primordial eukaryotic cell, unable to metabolize oxygen, acquired bacteria much better adapted to oxygen (Sagan, 1967; DiMauro et al., 2013).The mitochondrial genome (mtDNA) is present in multiple copies and codes for a few fundamental protein components of the oxidative phosphorylation (OXPHOS) (Anderson et al., 1981).
The mitochondrial double-membrane is composed by the outer (OM) and inner (IM) membranes, this latter separating the inner membrane space (IMS) from the internal matrix. The OM has similar composition to the cell membrane; many transport channels (porin) are present and make the OM permeable to molecules of 5000 dalton or less (ions and small proteins). Differently, the IM contains high levels of cardiolipin, making it especially impermeable to ions, and selective transport proteins are needed to transport the molecules necessary to matrix enzymes or their metabolites. This membrane is fundamental for maintenance of an electrochemical gradient between the matrix and the IMS (Frey and Mannella, 2000). The IM is also organized in cristae, which can shift from tubular to lamellar structures, depending on the conformational state (Frey and Mannella, 2000). All cristae connect to the inner boundary membrane via a tubular structure, named crista junctions, that limits diffusion between the intracristal space and the intermembrane space (Frey and Mannella, 2000; Rampelt et al., 2017). Cristae are the specialized compartment for the respiratory chain complexes and the ATP synthase (Rampelt et al., 2017).
The fundamental mitochondrial function is energy conservation, in the form of ATP molecule, synthetized by the OXPHOS metabolism. Furthermore, other pathways take place in mitochondria: partial synthesis of steroids, heme-groups synthesis, Ca++ intracellular
2 homeostasis, reactive oxygen species (ROS) production and detoxification and apoptosis regulation.
Oxidative Phosphorylation
OXPHOS is the final step of cellular respiration and is a two-phases biochemical process: electron transport chain, with NADH and FADH2 redox to generate a proton gradient, and ATP
synthesis, exploiting the proton gradient. The OXPHOS uses the electrons flow that are transported through a series of protein complexes, which are embedded in the lipid bilayer of the mitochondrial IM, to provide most of cellular energy in the form of ATP (Balaban, 1990; Friedman and Nunnari, 2014). The OXPHOS system is composed of five multimeric enzymatic complexes (CI-V) and consists of 87 subunits, 13 directly encoded by the mitochondrial DNA (mtDNA) (Figure 1). Figure 1. Mitochondrial respiratory chain (Schon et al., 2012) All complexes are integrated in the lipid bilayer of the mitochondrial IM and together with two mobile electron carriers, ubiquinone (CoQ) and cytochrome c (cyt c), they make up the electron transport chain. The electron transport is coupled to the generation of a proton gradient across the IM and this is used by complex V to synthesize ATP from ADP (Mitchell, 1961). The electron carriers, nicotinamide adenine dinucleotide (NADH) and flavin adenine dinucleotide (FADH2), are reduced during the Krebs cycle or the β-oxidation of fatty acids. CI is the largest respiratory complexes, comprising 45 subunits, only seven mitochondrially encoded (Fiedorczuk et al., 2016). It’s a L-shape structure protein, with two major domains: the hydrophilic matrix arm comprises flavin, involved in electron transfer, and the membrane arm, involved in proton translocation (Fiedorczuk et al., 2016). The electrons are transported
3 via iron/sulphur clusters to CoQ, reduced to CoQH2 (Fiedorczuk et al., 2016), with the
simultaneous translocation of four protons across the IM into the inner membrane space. CII is formed by four subunits, completely encoded by the nucleus, and catalyzes the oxidation of succinate to fumarate. Reduced CoQ can move and transport the electrons to CIII (ubiquinone-cytochrome c oxidoreductase) (Lancaster and Kröger, 2000). CIII is a functional dimer and transfers electrons from CoQH2 to cytochorme c, that donates electrons to complex
IV through IMS (Darrouzet et al., 2001; Dibrova et al., 2013).
CIV is the terminal enzyme of the respiratory chain, composed of 13 subunits, of which three are encoded by the mtDNA. This complex reduces O2 to H2O, translocating protons from
matrix to IMS. During the electron transfer, the energy released enables the proton pumping against gradient from the matrix to the IMS. The proton transfer occurs only in CI, III and IV. The electrochemical gradient, positive outside and negative inside the IM, is used by complex V (ATP synthase) to synthesize ATP. CV consists of two major functional domains, a large extra-membranous portion (F1) sector and a membrane-intrinsic portion (F0) sector joined together by central and peripheral stalks (Walker, 2013). CV has two subunits encoded by mtDNA (MT-ATP6 and MT-ATP8), which take part to the membrane-bound portion (F0) of the complex, and about 13 other subunits
encoded by nDNA (Abrahams et al., 1994). Protons from the intermembrane space enter CV through the F0 complex leading to the rotation of the catalytic complex. The rotational energy
of the motor is transmitted to the catalytic domain by the central stalk, which is attached directly to the rotary motor, and then used for ATP synthesis (Walker, 2013). ATP formation requires a sufficient supply of ADP and phosphate, and specific carriers transport both substrates across the mitochondrial membranes: the adenine nucleotide translocator (ANT) and the phosphate carrier (Seelert and Dencher, 2011). Morphology Mitochondria appear as a dynamic network in balance between the processes of fusion and fission of both OM and IM (Chan, 2012; Liu et al., 2009). During fusion the membranes of two discrete mitochondria merge, uniting and mixing their content. Opposite, during fission a single mitochondrion splits into two organelles. Continuous rounds of fusion and fission are necessary to maintain mitochondrial homeostasis (Chan, 2012), in particular to meet the
4 energetic needs (Gomes et al., 2011; Mishra et al., 2014). A wide mitochondrial network is present in metabolically active cells and acts electrically as a unique system able to transmit mitochondrial membrane potential, allowing energy distribution and dissipation (Skulachev, 2001). A “mitochondria-shaping” machinery, including both pro-fusion and pro-fission proteins, is involved in a dynamic control of the mitochondrial network, to efficiently maintain the mitochondrial population. During mitochondrial fission, the dynamin protein Drp1 is recruited from cytosol to the mitochondrial surface, self-assembles into ring-like oligomeric structures that encircle and pinch the outer mitochondrial membrane at sites of fission (Lee et al., 2017). Drp1 is essential for mitochondrial fission provoked by events like mitosis or stress, and for development of the nervous system (Ishihara et al., 2009; Wakabayashi et al., 2009). Drp1 is recruited at the mitochondrial surface by integral OM proteins (Fis1, Mff, MiD49 and MiD51). In mammals Fis1 can directly bind Drp1, although in yeast the recruitment requires Fis1 and the two WD40-containing adaptors (Griffin et al., 2005; Wells et al., 2007). Moreover, in mammals three other receptor proteins involved in fission events are reported: Mff, MiD49 and MiD51 (Losón et al., 2013; Otera et al., 2005). Mitochondrial fission plays a key role in both cell life and death. Fission occurs in the programmed cell death pathway (apoptosis), before the release of cytochrome c and caspase activation (Youle and Karbowski, 2005), and in cellular division, for correct distribution of mitochondria to daughter cells (Kashatus et al., 2011). Fission carries out a key role in mitophagy, because interruption of fission reduces the efficiency of mitophagy, suggesting that fission segregates mitochondria with loss of membrane potential (Frank et al., 2012; Stotland and Gottlieb, 2015).
Fusion is the reverse process of fission, when the inner and outer membranes of one mitochondrion melt with the respective membranes of another organelle. First, the OMs fuse, allowing the IMs to come into proximity for their fusion. In mammals, three proteins carry out this event: the mitofusins MFN1 and MFN2 for the OM fusion and OPA1 for the IM fusion (Chan, 2012). These proteins belong to the dynamin-like protein superfamily and contain GTPase activity essential for their functions (Praefcke and McMahon, 2004). MFN1 is essential to induce OM fusion, whereas the role of MFN2 is less defined. MFN2 can form hetero-oligomers with MFN1 and is suggested to participate in later steps of mitochondrial fusion (Ishihara et al., 2004; Koshiba et al., 2004). MFN2 has been shown to be involved also in
5 endoplasmic reticulum interactions, bridging the two organelles close at the level of mitochondrial associated membranes (MAMs), and the levels of MFN2 correlate with the oxidative metabolism of skeletal muscle (Bach et al., 2003; de Brito and Scorrano, 2008). OPA1 is essential for IM fusion, but it is also involved in shaping the cristae morphology, OXPHOS efficiency, and mtDNA maintenance (Belenguer and Pellegrini, 2013; Vidoni et al., 2013). OPA1 oligomerization, tightening cristae junctions, also controls the propensity to apoptosis by sequestering cytochrome c within the cristae and regulating its release in the IMS (Dotto et al., 2017; Frezza et al., 2006; Olichon et al., 2003). Fusion is important also for mitochondrial calcium homeostasis (Szabadkai et al., 2006), embryonic development (Chen et al., 2003), spermatogenesis and mtDNA maintenance (Chen et al., 2007). The mitochondrial genome: mtDNA The human mitochondrial genome (mtDNA) is a circular double-stranded molecule of about 16.6 kb, localized in the mitochondrial matrix, and represents 0,5-1% of the entire human genome. The mtDNA is present in multiple copies, ranging from tens to thousand per cell, according to the cell type. The two strands of mtDNA can be distinguished into ‘heavy strand’ (H-strand) and ‘light strand’ (L-strand), based on their nucleotide (GC) content (Fernández-Silva et al., 2003). The mtDNA is very compact, having none or only a few noncoding bases between genes and lacking in many cases the termination codons; termination is post-transcriptionally induced by polyadenylation of mRNAs (Anderson et al., 1981; Andrews et al., 1999). The mtDNA encodes for 37 genes: 24 genes (22 tRNAs and 2 rRNAs, 12S and 16S) are necessary for transcription of 13 OXPHOS subunits, 7 for complex I (MT-ND1, MT-ND2, MT-ND3, MT- ND4, MT-ND4L, MT-ND5, MT-ND6), 1 for complex III (MT-CYB), 3 for complex IV (MT-CO1, MT-CO2, MT-CO3) and 2 for complex V (MT-ATP6, MT-ATP8) (Anderson et al., 1981) (Figure 2).
6 Figure 2. Map of mitochondrial DNA (Taylor and Turnbull, 2005) Genes are distributed asymmetrically between the two strands: H-strand encodes for most genes, both rRNAs, 14 tRNAs and 12 mRNAs of 13 subunits, but ND6 and 8 tRNAs are in L-strand (Attardi and Schatz, 1988). Furthermore, two non-coding regions (NCR) are present in the mtDNA. D-loop (Displacement Loop) is a triple-stranded region found in the major NCR of many mitochondrial genomes, and is formed by stable incorporation of a third, short DNA strand known as 7S DNA (Nicholls and Minczuk, 2014). D-loop is involved in many function, especially in mtDNA replication and translation, but also in mtDNA topology, mtDNA recombination, membrane association and dNTPs metabolism (Nicholls and Minczuk, 2014). The second NCR contains the origin of L-strand replication (OL) and is located in a cluster of
five tRNA genes (MT-TA, MT-TN, MT-TC, MT-TY) on L-strand, between nucleotides 5512 and 5903, around two thirds of the mtDNA length from the OH
(Anderson et al., 1981; Fernandez-Silva et al., 2003).
Similar to bacterial chromosomes, mitochondrial DNA is organized into tightly-packed nucleoprotein complexes called nucleoids. Nucleoids are found associated with the inner mitochondrial membrane, but can also freely diffuse through the mitochondrial network
(Albring et al., 1977; Brown et al., 2011; Nicholls and Minczuk, 2014). The most thoroughly characterized nucleoid protein is the high-mobility group box protein TFAM (Parisi and Clayton, 1991).
7 The mtDNA replicates according to the strand-displacement model, with an asynchronous and asymmetric modality. DNA synthesis occurs continuously on both strands without Okazaki fragments (Clayton, 1991). There are two specific origins of DNA replication, one for each strand, the H-strand origin (OH) and the L-strand origin (OL). This is necessary to ensure correct
DNA synthesis for both strands. Replication starts at OH, and DNA synthesis proceeds in 5’-3’ direction to produce a new H-strand. During the synthesis of the new H-strand, mtSSB covers the displaced, parental H-strand and blocks POLRMT transcription (Miralles Fusté et al., 2014). When the replication machinery exceeds OL , it becomes single-stranded and folds into a stem-loop structure. The stem inhibits mtSSB binding and leaves the single-stranded loop region accessible for POLRMT, which initiates primer synthesis from a poly-T stretch (Fusté et al., 2010; Miralles Fusté et al., 2014). After about 25 nucleotides of primer synthesis, POLRMT is replaced by POLγ, and L-strand DNA synthesis begins. The replication of the two strands is interconnected because H-strand synthesis is required for the initiation of L-strand synthesis. Once initiated, H- and L-strand synthesis proceed continuously in opposite directions until the two events reach a full circle (Gustafsson et al., 2016).
Besides the replication origin of H-strand, D-loop contains a dedicated promoter for the transcription of each strand of mtDNA, the L-strand promoter (LSP) and the H-strand promoter (HSP). Transcription initiation at LSP or HSP produces near-genome-length polycistronic transcripts that encompass all of the coding information on each strand. The primary transcripts are processed to release the individual RNA molecules. The steady-state levels of the longer unprocessed transcripts are low and, therefore, processing is likely to occur co-transcriptionally. According to the “tRNA punctuation model” model, tRNAs are specifically recognized and cleaved in the polycistronic transcripts, thus leading to the release of tRNAs, mRNAs, and rRNAs (Anderson et al., 1981; Ojala et al., 1981), which subsequently undergo further maturation by, for example, base modifications, CCA addition, and polyadenylation (Hällberg and Larsson, 2014). In mammalian mitochondria, the 5ʹ ends of tRNAs are cleaved in the polycistronic transcript by an all-protein version of ribonuclease (RNase) P, consisting of three subunits (MRPP1–3), whereas the 3ʹ ends of tRNAs are processed by RNase Z (ELAC2) (Hällberg and Larsson, 2014).
8 Mitochondrial genetics The mitochondrial genome differs from the nuclear one (nDNA) in many respects. First, the mtDNA genetic code uses only two stop codons: AGA and AGG (Temperley et al., 2010) (compared with UAA, UGA and UAG in nDNA), conversely UGA encodes tryptophan. To compensate for this UAA codons have to be introduced at the post-transcriptional level. In addition, AUA, isoleucine in nDNA, encodes for methionine in mtDNA (Chinnery and Hudson, 2013).
Second, mtDNA is maternally inherited. The prevailing theory of an “active elimination model” for paternal mtDNA suggests that sperm mitochondria are ubiquitinated and removed through different routes, such as proteosomal, lysosomal pathways or mitophagy (Carelli, 2015; Rojansky et al., 2016; Sato and Sato, 2013; Sutovsky et al., 1999). Moreover, autophagy has been recently highlighted as the mechanism for paternal mtDNA elimination in Caenorhabditis elegans (Al Rawi et al., 2011; Sato and Sato, 2011). Finally, a passive “dilution model” due to disproportionate amount of paternal versus maternal mtDNAs in mammals has been proposed. This was observed in mice (Luo et al., 2013), but not confirmed in humans (Pyle et al., 2015). Occurrence of paternal mtDNA transmission has also been documented in human (Schwartz and Vissing, 2002), and more often in animals (Dokianakis and Ladoukakis, 2014; Gyllensten et al., 1991; Zhao et al., 2004). Finally, mtDNA variants may be present in homoplasmy or heteroplasmy, not in homozygosity or heterozygosity. Homoplasmy occurs when the sequence of multiple mtDNA copies are identical. However, heteroplasmy arises when a variant co-exists with its wild-type counterpart in various proportions, due to the polyploid nature of mtDNA (Chinnery and Hudson, 2013; Payne et al., 2013). A heteroplasmic variant can be inherit from mother to child and segregate in different tissue with varying loads, according to the ‘mitochondrial bottleneck theory’. During oogenesis and meiosis, cells incur to mtDNA reduction and amplification, leading to a purportedly random shift in mtDNA mutational load between cells (Chinnery and Hudson, 2013; Schon et al., 2012).
Mitochondrial haplogroups
The rate of evolution of the mitochondrial genome appears 10-fold higher than nuclear genome, mostly due to an elevated mutation rate of mtDNA (Brown et al., 1979). Due to the
9 high rate of evolution, mtDNA is an extremely useful molecule to exploit for high-resolution analysis in a wide range of fields, including evolutionary anthropology and population history, medical genetics, as well as forensic science (van Oven and Kayser, 2009). Thus, the mtDNA sequence evolved as a result of the sequential accumulation of mutations along maternally inherited lineages. All mtDNA types in the human gene pool can ultimately be traced back to a common matrilineal ancestor that lived approximately 200,000 years ago in Africa (Behar et al., 2008; Macaulay et al., 2005; Mishmar et al., 2003; van Oven and Kayser, 2009) and by migration colonized the world (Kivisild, 2015). Haplogroups are used to represent the major branch points on the mitochondrial phylogenetic tree and the migrations (Figure 3). Figure 3 mtDNA haplogroup tree and distribution map (Kivisild, 2015). The European population origins from the African haplogroup L3, followed by emergence of the major out-of-Africa haplogroups M and N (and N’s descendants, R) in the vicinity of a putative “Gulf oasis” (Richards et al., 2016), subsequently followed by haplogroup R divergence (Pinhasi et al., 2012).
In the last decades, the possible role of mtDNA haplogroups in modulating mitochondrial function and pathology has been massively investigated. Interestingly, many studies have shown the associations of haplogroups with IQ (Skuder et al., 1995), sperm motility (Ruiz-Pesini et al., 2000), ability to adapt to climatic conditions (Ruiz-Pesini et al., 2004), body fat mass (Yang et al., 2011) and longevity (Cai et al., 2009; Santoro et al., 2006). Furthermore, this
10
association of mitochondrial haplogroups has been noticed in some pathologies, such as psychosis in bipolar disorder (Frye et al., 2017), motor function in long-term HIV-1 infected individuals (Azar et al., 2017), autism spectrum disorders (Chalkia et al., 2017), cardiomyopathy (Shin et al., 2000), multiple sclerosis (Kalman et al., 1999), Parkinson's disease (Ghezzi et al., 2005), Alzheimer's disease (Krüger et al., 2010; van der Walt et al., 2004), Friedreich's disease (Giacchetti et al., 2004), Amyotrophic Lateral Sclerosis (Mancuso et al., 2004) and Leber’s Hereditary Optic Neuropathy (LHON) (Carelli et al., 2006; Hudson et al., 2007). Leber’s hereditary optic neuropathy (LHON) LHON (OMIM #535000) is a blinding disorder, maternally inherited, characterized by acute or subacute loss of central vision, which affects predominantly young males, and is now recognized as the most frequent mitochondrial disease (Carelli et al., 2004, 2016; Yu-Wai-Man et al., 2011). The prevalence of LHON mutations in the population may vary from 1:10,000 in North East of England to 1:50,000 in Finland (Man et al., 2003; Puomila et al., 2007).
Clinically, LHON is characterized by painless, rapid loss of central vision in one eye, followed by a similar involvement of the other eye, usually in a short time laps, associated with dyschromatopsia (Carelli et al., 2004). In the acute phase, axonal loss in the papillo-macular bundle leads to temporal atrophy of the optic nerve, and the endpoint of the disease is generally a full optic atrophy with permanent severe loss of central vision, but with relative preservation of the peripheral visual field and pupillary light responses (Carelli et al., 2004). However, patients show occasionally a spontaneous recovery of visual acuity (Carelli et al., 2004; Mackey and Howell, 1992; Pezzi et al., 1998; Stone et al., 1992). The peculiar feature of LHON is the selective degeneration of a single cell type, the retinal ganglion cells (RGCs). Thus, RGCs display somehow a unique sensibility to the mitochondrial energy defect generated by LHON pathogenic mutations. The 1.2 million axons that form the optic nerve originate from the RGCs in the inner retina (Carelli et al., 2004). These axons do not present a saltatory conduction of action potential until past the lamina cribrosa, due to absence of the myelin sheet, in order to maintain the optical transparency and consequently a good visual resolution (Howell et al., 2002). Thus, the high energy dependence of these cells
11 on mitochondrial OXPHOS may explain the particular sensitivity of RGCs and the related visual loss due to mitochondrial dysfunction (Carelli et al., 2004). LHON is maternally inherited, due to the presence of point mutations on mtDNA. The most common pathogenic mutations are m.11778G>A/MT-ND4, m.3460G>A/MT-ND1, and m.14484T>C/MT-ND6, characterizing about 90% of LHON cases (Howell et al., 1991; Mackey and Howell, 1992; Wallace et al., 1988; Yu-Wai-Man et al., 2011). These “primary” pathogenic mutations are usually established as homoplasmic over multiple generations in LHON maternal lineages. However, two further features remain peculiar in LHON, i.e. the incomplete penetrance and the male prevalence (Caporali et al., 2017). Mitochondrial biogenesis, which is boosted in females by estrogens (Giordano et al., 2011), seems a major compensatory mechanism that determines incomplete penetrance (Giordano et al., 2014). On this, environmental factors, such as tobacco smoke (Sadun et al., 2004), and genetic modifiers, both in nDNA and mtDNA, are assumed to play a further role (Caporali et al., 2017).
Besides the 3 common “primary” LHON mutations, several other rarer pathogenic mutations have also been reported in single cases or families (Achilli et al., 2012). Moreover, additional recurrent polymorphic mtDNA variants were also associated with LHON and called “secondary” mutations (Brown et al., 1992; Johns and Berman, 1991; Johns and Neufeld, 1991). The role of these “secondary mutations”, widely debated (Mackey et al., 1996), was elucidated by firmly establishing these variants as mtDNA haplogroup-related polymorphic markers (Torroni et al., 1996). Thus, multiple research groups confirmed the association of some LHON “primary” mutations with a specific mtDNA haplogroup, haplogroup J, as penetrance enhancer: in particular, this association is observed with the LHON m.11778G>A/MT-ND4 and m.14484T>C/MT-ND6 mutations (Brown et al., 1997; Lamminen et al., 1997; Torroni et al., 1997). Over the years, this association was refined to specific clades of haplogroup J, the J1c and J2b clades characterized by accumulation of missense variants affecting both complex I and III (Carelli et al., 2006; Hudson et al., 2007). This association were validated in large cohorts of LHON patients of European descent, but a similar scenario seems to be confirmed also in LHON cohorts of Asian ancestry (Ji et al., 2008; Kaewsutthi et al., 2011). Furthermore, the complete sequence analysis of mtDNA carrying rare LHON mutation allowed to identifying private variants that may also act as genetic modifiers (Achilli et al., 2012). Multiple reports on Chinese LHON families indicated the occurrence of mtDNA backgrounds
12 characterized by an unusually high or even complete penetrance, frequently due to coexisting pathogenic mutations (Yang et al., 2009; Zhang et al., 2012). Opposite, in other maternal lineages it was observed an extremely reduced penetrance (Qu et al., 2009). Thus, different combinations including mtDNA haplotypes as defined by specific arrays of polymorphisms, private variants and co-existing mutations may all impinge on the pathogenic potential and, ultimately, on penetrance of LHON primary mutations. Remarkably, the role of the same mtDNA variant may vary drastically, for example, from adaptation at high altitudes, due to an environmental positive selection on the mtDNA sequence, to a pathogenic potential predisposing to LHON in different interacting environments (Caporali et al., 2017; Ji et al., 2008).
Interestingly, the pathogenic role of the m.14484T>C/MT-ND6 mutation was initially not recognized because of the low phylogenetic conservation of the affected amino acid (Howell et al., 1991; Mackey and Howell, 1992). Remarkably, the m.14484T>C/MT-ND6 change found on non-J mtDNA backgrounds displays a very low penetrance and has been occasionally reported in genetic surveys of control populations, thus behaving borderline and similarly to a polymorphic variant (A. Torroni, unpublished data) (Howell et al., 2003a; Palanichamy et al., 2004). Furthermore, different sets of two or more mtDNA variants have been postulated as modulators of penetrance, such as combinations of multiple private “weak” pathogenic mutations or combination of established LHON pathogenic mutations with variants, already known as markers of specific haplogroups, but detected outside the usual haplogroup background (La Morgia et al., 2008, 2014a).
A few studies tackled the issue of providing a functional evidence for the modifying role of the mtDNA haplotype and/or the private variants or co-existing mtDNA mutations. Initial studies based on MR-spectroscopy were unable to detect differences between LHON patients carrying the m.11778G>A/MT-ND4 mutation associated or not with the mtDNA haplogroup J (Lodi et al., 2000). Exploiting the cell model of transmitochondrial cytoplasmic hybrids, “cybrids”, it has been shown in vitro that different mtDNA haplogroups may have slight, but significant differences in bioenergetic efficiency, production of ROS and stability of respiratory complexes assembly (Carelli et al., 2002; Gómez-Durán et al., 2010, 2012; Pello et al., 2008), thus substantiating their possible role as modifiers for LHON penetrance. Controversial results
13 were instead provided by the few studies on cases of LHON carrying double primary mutations (Brown et al., 2001; Caporali et al., 2017; Cruz-Bermúdez et al., 2016; Jiang et al., 2016). Dominant optic atrophy (DOA) Dominant optic atrophy (DOA, OMIM#165500), also known as Kjer’s optic atrophy, is the most common amongst hereditary optic neuropathies, with an estimated disease prevalence varying from 1:10,000 to 1:30,000 (Lenaers et al., 2012). In year 2000, two independent groups identified pathogenic mutations in the OPA1 gene as causative for DOA (Alexander et al., 2000; Delettre et al., 2000). Nowadays, about 70% of DOA families have been linked to OPA1 mutations and more than 350 pathogenic mutations have been submitted to OPA1 databases, spread throughout the protein (Ferré et al., 2015; La Morgia et al., 2014b). The 50% of DOA patients carry stop-codon, frame-shift and deletion-insertion, leading to incomplete transcription and decreased protein content, with haploinsufficiency as the genetic mechanism. The remaining patients present missense mutations, which are thought to act through a dominant negative mechanism. In 2008, a particular group of missense mutations, affecting the GTPase domain, have been related to a syndromic form of DOA, associated with sensorineural deafness, ataxia, late-onset chronic progressive external ophthalmoplegia (CPEO) and mitochondrial myopathy with cytochrome c oxidase negative. This new phenotype was defined as DOA “plus” syndrome (Amati-Bonneau et al., 2008; Hudson et al., 2008; Yu-Wai-Man et al., 2010). Importantly, these patients harbored multiple deletions of mtDNA in their skeletal muscles, confirming the OPA1 function in mtDNA stability, as previously reported for its orthologue in Saccharomyces cerevisiae (Jones and Fangman, 1992; Guan et al., 1993). Thus, OPA1 has been added to the list of genes (ANT1, Twinkle, POLG, MFN2) associated with human disorders characterized by mtDNA deletions (CPEO syndromes) (DiMauro and Schon, 2008; Rouzier et al., 2012). Recently, other phenotypes have been reported within the frame of the DOA “plus” syndrome, including MS-like features (Yu-Wai-Man et al., 2016), Behr-like spastic paraparesis (Marelli et al., 2011), Parkinsonism and dementia (Carelli et al., 2015) and cases with absent or very mild ocular phenotype (Milone et al., 2009), thus expanding the spectrum of OPA1 spectrum.
As LHON, DOA is a hereditary neurodegenerative disorder, characterized by a tissue specificity, which is limited to RGCs and their axons forming the optic nerve, with a
14 preferential involvement of the small fibers belonging to the papillomacular bundle, which serve central vision. The main difference with LHON is slowly progressive course of bilateral visual loss, and as in LHON, DOA is usually symmetrical, associated with centrocaecal scotomas, impairment of color vision, temporal pallor of the optic disks and relative preservation of the pupillary reflex (Delettre et al., 2002; Lenaers et al., 2012; Yu-Wai-Man et al., 2010). The onset of DOA is usually during childhood, although the defect most frequently is diagnosed early in adult life. However, this optic atrophy shows wide variability in clinical expression between and within families, and visual impairment ranges from subclinical vision impairment to legal blindness (Barboni et al., 2014; Carelli et al., 2009; Yu-Wai-Man et al., 2010). Postmortem histologic studies showed diffuse atrophy of the ganglion cell layer in the retina, with loss of myelin and axons within the optic nerves (Johnston et al., 1979), similar to the histopathology of LHON (Kjer et al., 1983). Analysis of the retinal nerve fiber layer (RNFL) thickness in DOA patients with optical coherence tomography (OCT), a non-invasive technique used to obtain high-resolution images, revealed generalized loss of fibers, typically prevalent on the temporal sector, with a smaller average optic disk size compared to a control population (Barboni et al., 2011, 2014; Milea et al., 2010).
Due to the variable clinical severity and incomplete penetrance observed in DOA, similar to LHON, the possible role of mtDNA haplogroups was investigated in DOA patients carrying OPA1 mutations. The two studies currently published reached contrasting conclusions on the possibility that the mtDNA background may act as modifying factor for DOA penetrance (Han et al., 2006; Pierron et al., 2009). Both studies examined a limited series of patients (29 and 41 respectively) and the study design did not take into consideration that DOA is a dominant disorder where the mtDNA haplogroup may be co-inherited with the OPA1 mutation from the mother or, alternatively, may change when the OPA1 mutation is inherited from the father. As a consequence, a study design just considering the simple association of the mtDNA haplogroup with OPA1 mutations does not take into account for these intricacies. Thus, only further studies of large cohorts of patients, with multiple segregations, may lead to a properly supported conclusion on the possible role played by mtDNA haplogroups in OPA1-related DOA (Caporali et al., 2017).
15
AIMS
The two most common inherited optic neuropathies due to mitochondrial dysfunction, Leber’s Hereditary Optic Neuropathy (LHON) and Dominant Optic Atrophy (DOA), are both characterized by an incomplete penetrance and variable clinical severity, and in LHON there is also a clear-cut prevalence in males. These features remain poorly understood. LHON is genetically determined by missense point mutation in Complex I subunits genes encoded by the mitochondrial genome, whereas DOA is mostly due to heterozygous mutation in the OPA1 gene, encoding a mitochondrial fusion protein. In LHON, 90 % of patients carry one of three common primary mutations (m.11778G>A/MT-ND4, m.3460G>A/MT-ND1, and m.14484T>C/MT-ND6), the remaining 10% harbor a rarer mutation (Achilli et al., 2012). Since the identification of the first pathogenic mutation in mtDNA (Wallace et al., 1988), the role of the entire mitogenome has been investigated in many aspect of medicine, and particularly in LHON, suggesting a complex interaction between the pathogenic mutations, and the adaptive and private variants. The first aim of this study is to determine the molecular basis of optic neuropathy in four families, negative for the common LHON pathogenic mutations, but still characterized by a clinical phenotype undistinguishable from LHON, which is maternally inherited at low penetrance. We will carry out the sequence of the entire mitochondrial genome in each of the four probands and perform confirmatory functional studies by assessing mitochondrial bioenergetics, taking advantage of the cybrids cell model to isolate the mitogenome contribution to the pathogenesis.
The second aim of this study is a large-scale analysis of the entire mitogenome in a large European cohort of LHON patients previously diagnosed as carrying the m.14484T>C/MT-ND6 mutation, the less frequent of the primary mutations. This analysis is specifically carried out to dissect the modifier role of the mitogenome genetic variation. The association of the three primary LHON mutation with specific mitochondrial backgrounds is largely known (Carelli et al., 2006; Hudson et al., 2007), and this is particularly stringent for the m.14484T>C/MT-ND6 mutation, but only a few families have been analyzed to date, and never at the resolution level of the entire sequence of the mitogenome.
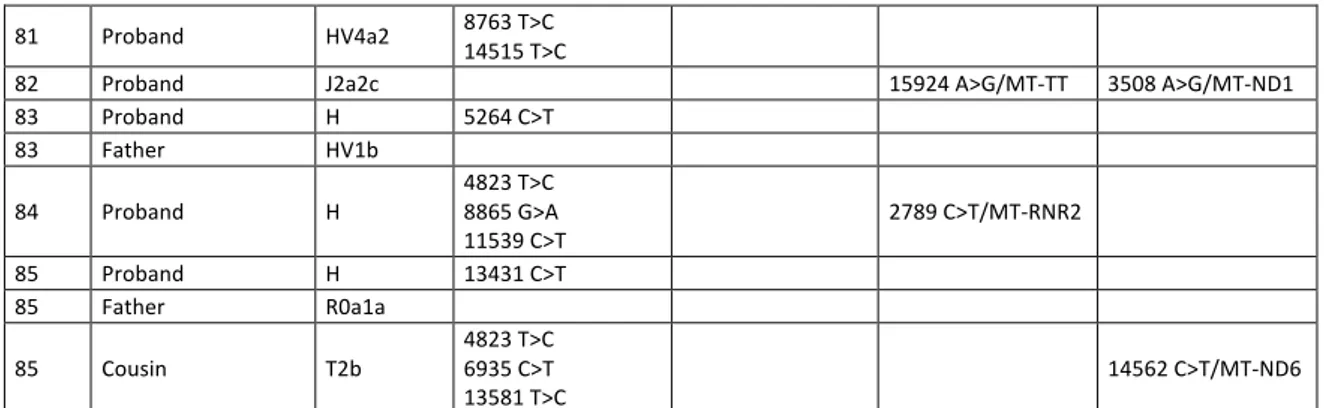
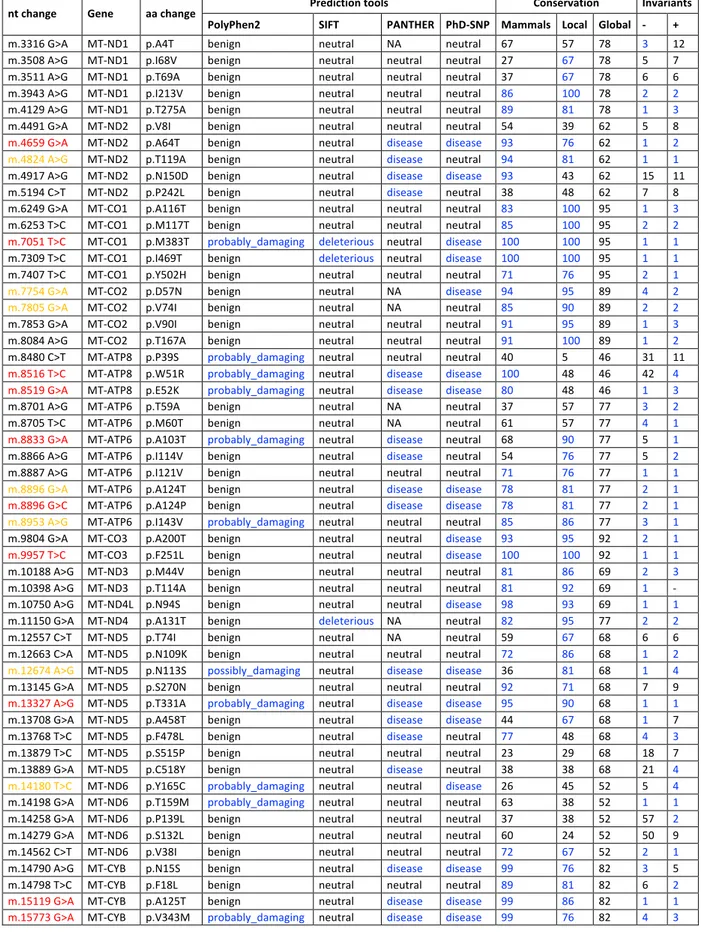
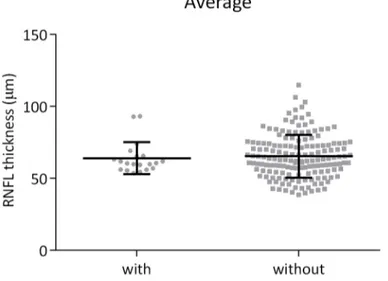
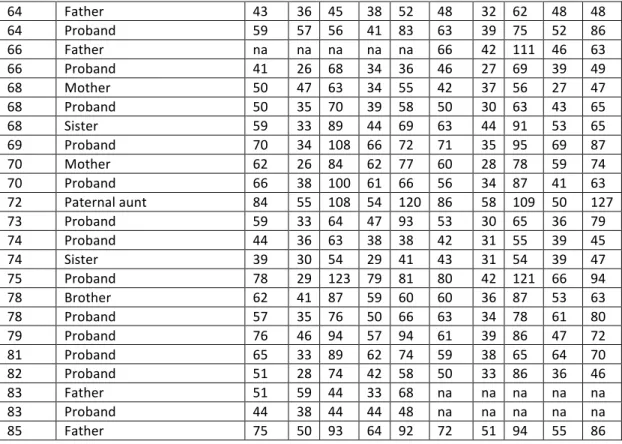
16 Finally, the last aim is the analysis of the mitochondrial genome variability in DOA patients carrying OPA1 mutations. It is well established that DOA patients present a wide clinical variability between and within families, without a clear genotype-phenotype correlation with the OPA1 mutations. In previous studies, the association with the mitogenome genetic variation was tested, but the results of these study were unclear due to a faulty design (Han et al., 2006; Pierron et al., 2009). Thus, we re-consider the mitogenome genetic variation as possible modifier of patients’ clinical outcome, measured as retinal nerve fibers layer (RNFL) thickness by OCT (optic coherence tomography). We will also investigate the possible relevance of coadaptation between the nuclear and mitochondrial genomes, by considering the mother-children segregations, where the mtDNA segregates with the OPA1 mutation, and father-children segregations, where the mtDNA does not segregate with the OPA1 mutation. For each mitogenome, we will define the mtDNA haplogroup, highlighting the private mutations, not belonging to the evolutionarily fixed changes, and predicting the effect by integration of conservation analysis and on-line prediction tools.
17
RESULTS
PART 1 - Peculiar combinations of individually non-pathogenic missense mitochondrial DNA variants cause low penetrance Leber’s hereditary optic neuropathy Pedigrees investigatedWe observed three multigenerational pedigrees (Families 1a, b, and c in Figure 4) with multiple affected individuals fitting the clinical diagnosis of LHON and with a clear maternal transmission of the phenotype. Noticeably, all three pedigrees were from the same geographical area of southern Italy (Campania region). Figure 4. Pedigree of Family 1 with the reconstructed genealogy (indicated by dashed lines) of its three branches (a, b, c). Affected individuals are indicated in black; probands are indicated by arrows. A fourth smaller pedigree (Family 2; Figure 5) from northern Italy (Emilia-Romagna region) was observed with a single affected individual obeying the LHON clinical diagnosis. All four families tested negative for the three common LHON mutations at positions m.11778G>A/MT-ND4, m.3460G>A/MT-ND1 and m.14484T>C/MT-ND6. Figure 5. Pedigree of Family 2. Affected individuals are indicated in black; proband is indicated by arrow. I:2 I:1
II:1 II:2 II:3 II:4 II:5 II:7 II:9 II:11 II:13
III:2 II:6 III:3 II:8 III:4 II:10 III:5 III:6 II:12 III:7 III:8 III:1 IV:1 IV:2
b
c
a
IV:6 III:5 III:1 III:2IV:1 IV:2IV:3IV:4IV:5 IV:8 IV:10 IV:12 IV:14 IV:16 II:1 II:2 III:4 IV:7 V:1 V:2V:3 IV:9 V:4 V:5V:6 IV:11 V:8 V:10V:11 V:7 VI:1 V:9 VI:2 IV:13 V:12V:13V:14V:15 IV:15 V:16V:17V:18V:19 III:3
IV:17IV:18IV:19IV:20 I:1 I:2
II:4 II:3
III:8 III:6 III:7 III:9
IV:5 I:1 I:2
II:2 II:3 II:5 II:6 II:7 II:8
III:13III:14III:15III:16
IV:6 IV:7 II:4
III:8III:9III:10III:11 III:12 II:1
III:2 III:4III:5 III:6III:7
IV:4 III:3
IV:2 IV:3 III:1
IV:1
II:2 II:3 II:4 II:5 II:6 II:7 II:9II:10II:11II:12 II:13
III:17 II:8
III:16 II:1
III:2 III:3 III:4 III:5 III:6 III:7 III:9 III:11 III:14 III:15
IV:12IV:13IV:14IV:15IV:16 III:1
IV:1 IV:2
III:8
IV:3 IV:4 IV:5 IV:6 III:10
IV:7 IV:8 IV:9 III:13 III:12
IV:10IV:11 I:1 I:2
18
Skeletal muscle investigations reveal normal activity of respiratory chain complexes but increased mitochondrial biogenesis
Histological analysis of skeletal muscle biopsies from the probands of Families 1a, 1b and 2 (Figures 4, 5) showed no overt signs of myopathy with minimal variability in fibers size, and histoenzymatic stain showed normal COX activity, but some increase of subsarcolemmal SDH reactivity (Figure 6A). Ultrastructure (TEM) analysis confirmed the presence of proliferated mitochondria under the sarcolemma and, occasionally, between fibers (Figure 6B). Mitochondrial DNA copy number and CS activity were both increased in skeletal muscles of patients as compared to controls (Figure 6C-D). Similarly, the specific oxidoreductase activities of Complex I, Complex II+III, Complex III and Complex IV were increased (Figure 6E), whereas when normalized on citrate synthase (CS) activity they were comparable to controls (Table 1). Taken together these data indicate the occurrence of an activated compensatory mitochondrial biogenesis, most likely due to a compensatory response caused by a mild mitochondrial defect, as previously reported (Giordano et al., 2014; Iommarini et al., 2012).
CI CII+III CIII CIV
Controls (mean ± SD) 31.7±20.0 20.3±18.5 197.94±119.8 54.6±23.6 Family 1a IV:1 48.10 29.32 202.63 85.23 Family 2 IV:2 31.93 35.83 281.37 68.25 Table 1. Respiratory chain enzyme activity on skeletal muscle normalized for CS activity
19 Figure 6. Morphological, molecular and biochemical analysis on skeletal muscle biopsies. A. SDH staining of skeletal muscle biopsies from individuals IV:1 from Family 1a (a), V:6 from Family 1b (b) and IV:2 from Family 2 (c). B. Transmission electron microscopy of the same muscle specimens as in A. Both SDH histoenzymatic staining (A) and ultrastructural evaluation (B) demonstrate mitochondrial proliferation as highlighted respectively by subsarcolemmal increase of SDH reaction and corresponding accumulation of mitochondria. C. Assessment of mtDNA content per cell, presented as column with mean ± SD (n=3; **p<0.001), confirms the activation of mitochondrial biogenesis as shown by the significant increase in LHON samples.
D. The evaluation of citrate synthase activity, presented as scatter plot with mean ± SD,
parallels again the results observed in C, with an increased mean value in the LHON samples. E. Evaluations of Complex I, Complex II+III, Complex III, Complex IV activities, presented as scatter plot with mean ± SD, reveal an increase of all activities in LHON samples. Molecular investigations, protein conservation, frequency, and phylogenetic analyses of the identified variants
Sequencing of the entire mitochondrial genome (mtDNA) from each of the probands independently ascertained for Families 1a, 1b and 1c revealed the same identical sequence, indicating that they descend from the same maternal ancestor, as also suggested by their geographical proximity. They all shared the diagnostic variants for haplogroup K1a and the following private mutations: non-coding m.2281A>G/MT-RNR2 and m.16129G>A/MT-HV1; synonymous m.6137T>C/MT-CO1, m.6329C>T/MT-CO1, m.8994G>A/MT-ATP6, m.11038A>G/MT-ND4 and m.15253A>G/MT-CYB; and missense m.14258G>A/MT-ND6 and m.14582A>G/MT-ND6. The m.14258G>A/MT-ND6 mutation causes the amino acid
A
B
a b cE
**
a c bC
D
20 substitution p.P139L, and the m.14582A>G/MT-ND6 the amino acid substitution p.V31A. Both missense mutations affect poorly conserved positions of the ND6 subunit of Complex I and are not predicted to be damaging (Figure 7, Table 2). However, the P139 position showed a higher conservation degree in mammals (37%) compared to eukaryotes (22%), being highest in primates (66%). Furthermore, the P139 position in mammals sits two amino acidic residues away from an invariant position (G141) and, in primates is contiguous to another invariant position (D138) within a moderately conserved domain (6 invariant positions out of 21) (Figure 7). The V31 position shows similar features. In eukaryotes and mammals, glycine is prevalent at position 31 with a low conservation (49% and 46%, respectively). In primates, at this position valine becomes prevalent with a higher conservation (77%). Most relevantly, V31 is within a highly conserved domain (10 invariant positions out of 21) in mammals, and is even more conserved in primates (16 invariant positions out of 21) (Figure 7).
Complete mtDNA sequence analysis of the proband from Family 2 showed all the variants diagnostic for haplogroup H5b and the following private mutations: synonymous m.10248T>C/MT-ND3; missense m.9966G>A/MT-CO3, m.10680G>A/MT-ND4L, m.12033A>G/MT-ND4 and m.14258G>A/MT-ND6. Besides the m.14258G>A/MT-ND6 nucleotide change, Family 2 also harbored the m.10680G>A/MT-ND4L and the m.12033A>G/MT-ND4 mutations that induce the amino acid changes p.A71T in ND4L and the p.N425S in ND4 subunits of Complex I, respectively. The p.A71T change affects a highly conserved ND4L position (86% in eukaryotes, 97% in mammals, invariant in primates), within an invariant stretch of 16 amino acids in primates (Figure 7, Table 2). Conversely, the p.N425S affects a highly conserved ND4 position only in primates (41% in eukaryotes, 70% in mammals, 87% in primates), in a moderately conserved domain (9 invariant positions out of 21) (Figure 7, Table 2). Both variants were considered neutral for the protein function by most of the prediction tools employed.
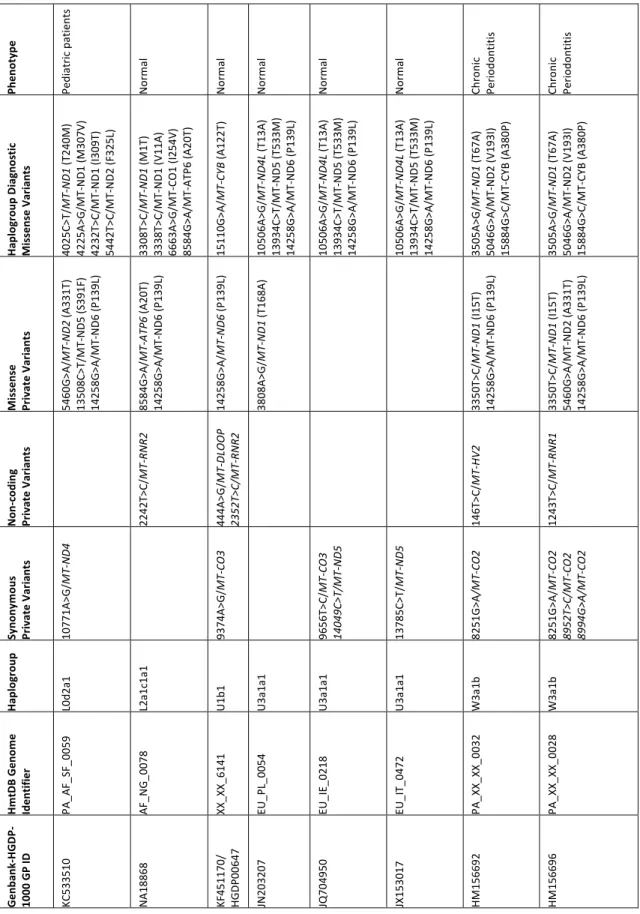
The m.14258G>A/MT-ND6 change, found in both Families 1 and 2, has been previously reported according to Mitomap and HmtDB in 10 different haplogroups, being diagnostic for haplogroups U3a1a1 and H1q3. Conversely, the m.14582A>G/MT-ND6 (Family 1) variant has been previously reported in seven different haplogroups, being diagnostic for haplogroup H4a. In these databases, the sample classified as GenBank: KC878720 is from our Family 1 and it was previously published (Costa et al., 2013) without considering the recurrence of a clinical
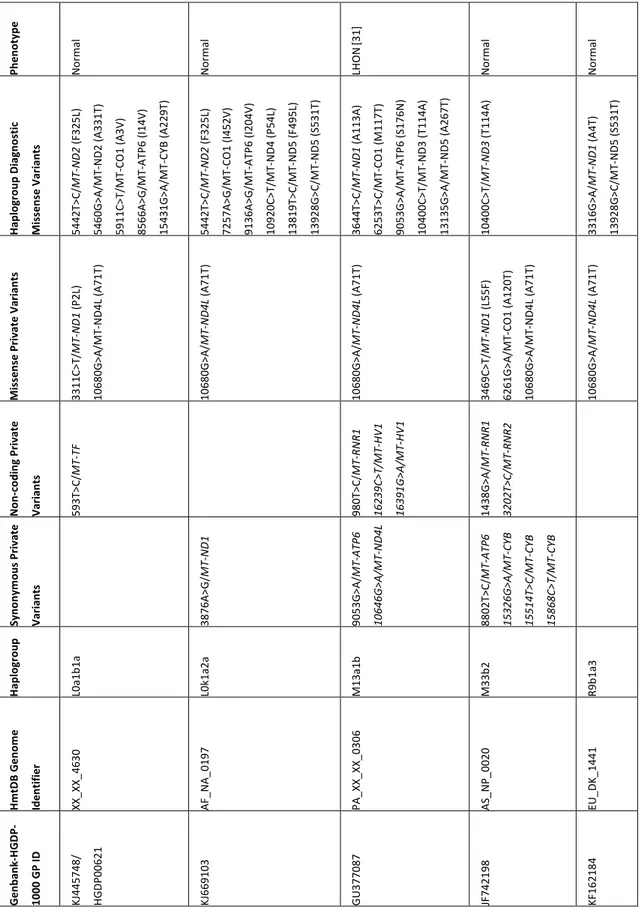
21 phenotype (A. Torroni, personal communication). The coexistence of m.14258G>A/MT-ND6 with the m.14582A>G/MT-ND6 variants is, however, unique to Family 1, when compared to all the other reported cases (Table 3). Concerning the m.10680G>A/MT-ND4L variant, this has been found in 14 haplogroups and it has been previously reported as the only pathogenic change in three LHON families, arising as independent mutational events in haplogroups B4a1e, M13a1b and D6a1 (Zhang et al., 2012; Zou et al., 2010). In addition, this mutation has also been found in association with the m.14484T>C/MT-ND6 mutation in a further LHON family with a haplogroup B4d1 background (Yang et al., 2009). However, the m.10680G>A/MT-ND4L change has also been recognized in ten different maternal lineages with no pathology reported (Table 4).
Finally, the m.12033A>G/MT-ND4 variant has been reported in five different haplogroups in the general population, without being associated with any pathologic phenotype. Overall, the combination of the three coexisting missense changes m.10680G>A/MT-ND4L, m.12033A>G/MT-ND4 and m.14258G>A/MT-ND6 is a unique feature of Family 2.
22 m.14528A>G/MT-ND6 p.V31A m.14258G>A/MT-ND6 p.P139L Eukaryotes Variants H.sapiens D.melanogaster P.lividus G.morhua D.rerio X.laevis A.thaliana P.anserina C.elegans 20 SSKPSPIYGGLALIVSGVVGC 40 20 SSKPSPIYGGLVLIVSGVVGC 40 19 NMIHPLALGLTLLIQTIFVCL 39 18 FYSLSPYYSALGLVVVSISGC 38 20 ASNPSPYFAALGLVLVAGVGC 40 20 ASNPAPYFAAFGLVVVAGVGC 40 20 ASNPSPFYAALGLVLAAGAGC 40 18 VRAKNPVHSVLFFILVFCDTS 38 38 ILTKNPIVSVLFLILLFGGIS 58 18 INIDPMKSSFFLIFSLLFSMP 38 * 130 EGSGLIREDLIGAGALYDYGR 150 130 EGSGLIREDPIGAGALYDYGR 150 119 ----INMNFMENSLSLNKLYN 135 119 DGGGVSFADFSGVAVFYSCGV 139 121 IEFSVVAADSGGVALMYSLGG 141 120 KEFSVIRADVSGVAMMYSSGG 140 118 LGSYVMRGDWVGVALMYSC-W 137 119 TTSL---TETLG-NLLYTYYF 135 141 SEDFIDFNTAIG-NIMYTIYN 160 94 ---PTTYSSYLGLSGFYY 108 * Mammals H.sapiens P.troglodytes L.catta M.musculus O.cuniculus E.caballus B.taurus B.physalus P.vitulina F.catus O.anatinus 20 SSKPSPIYGGLVLIVSGVVGC 40 20 SSKPSPIYGGLVLIVSGVVGC 40 19 SSKPSPIYGGVGLIVSGAVGC 39
20 ALKPSPIYGGLGLIVSGFVGC 40
20 SSKPSPIYGGLGLIVSGGVGC 40 21 SSKPSPIYGGLVLIVSGGVGC 41 21 SSKPSPIYGGLGLIVSGGVGC 41 21 SSKPSPIYGGLGLIVGGGVGC 41 21 SSKPSPIYGGLVLIISGAVGC 41 21 SSKPSPIYGGFGLIVAGGTGC 41 20 ASKPSPIYGGLSLVLSGGVGC 40 * 130 EGSGLIREDPIGAGALYDYGR 150 130 EGPGLIREDPIGAGALYDYGR 150 129 KEGGVIREDSLGVASLYNKAS 149 129 DDVGVMLEGGIGVAAMYSCAT 149 130 DEVGLIREDSMGVAALYSYGS 150 131 GDSGAFSEEIMGAAALYSYGA 151 131 GDSGFFSEEAMGIAALYSYGT 151 131 GGSGVFSEEATGIAALYSYGV 151 131 GDSGFFSEEAMGIAALYSYGT 151 131 GDSGFFSEEAMGIAALYSYGT 151 121 GGVEVLGGDYNGVSLLSACGG 141 * Primates H.sapiens P.paniscus P.troglodytes P.abelli P.pygmeus G.gorilla H.lar L.Catta 20 SSKPSPIYGGLVLIVSGVVGC 40 20 SSKPSPIYGGLVLIVSGVVGC 40 20 SSKPSPIYGGLVLIVSGVVGC 40 20 SSKPSPIYGGLVLIISGAVGC 40 20 SSKPSPIYGGLVLIISGAVGC 40 20 SSKPSPIYGGLVLIVSGVVGC 40 20 SSKPSPIYGGLVLVVSGVVGC 40 19 SSKPSPIYGGVGLIVSGAVGC 39
130 EGSGLIREDPIGAGALYDYGR 150
130 EGPGLIREDPIGAGALYDYGR 150
130 EGPGLIREDPIGAGALYDYGR 150
130 EGSGLIREDPIGAGALYDYGR 150
130 EGSGLIREDPIGAGALYDYGR 150
130 EGSGLIREDPIGAGALYDYGR 150
130 EGSGLIREDSIGAGALYDYGR 150
129 KEGGVIREDSLGVASLYNKAS 149
m.10680G>A/MT-ND4L p.A71T m.12033A>G/MT-ND4 p.N425S Eukaryotes Variants H.sapiens D.melanogaster P.lividus G.morhua D.rerio X.laevis A.thaliana P.anserina C.elegans 60 PIAMLVFAACETAVGLALLVS 80 60 PIAMLVFAACEAAVGLALLVS 80 60 SMMFLTFSVCEGALGLSILVS 80 59 NLLLLTLSACEASIGLSLMVA 79 60 PMLMLAFSACEASAGLALLVA 80 60 PMLLLAFSACEASAGLALLVA 80 60 LYIMLPFAAPEAATGLSLNSD 80 60 ALLVLTVAAAESAIGLAIFVI 80 54 AIYIIVVAGAESAIGLGILVA 74 45 FFYFMCFSVISSILGMVVMVG 65 * 415 QWGSLTHHINSMKPSFTRENT 435 415 QWGSLTHHINNMKPSFTRENT 435 402 QHGKLFSGVYSFSSGKIREYL 422 414 QQGTPTNNINNISLSFSREHL 434 415 QRGPLPQHMLALPPSYTREHL 435 415 QRGSIPEHITNLSPSHTREHL 435 414 QRGMTPEHLNAINPTHTREHT 434 411 VSGLKPDFLHKFSDLNGREVF 431 407 AFGFSKFFEENIGDVTKREFF 427 372 LMGKGYHNFNTWNVGFSAPLV 392 * Mammals H.sapiens P.troglodytes L.catta M.musculus O.cuniculus E.caballus B.taurus B.physalus P.vitulina F.catus O.anatinus 60 PIAMLVFAACEAAVGLALLVS 80 60 PITMLVFAACEAAVGLALLVS 80 60 PILLLVFAACEAAVGLALLVT 80 60 PIT-LVFAACEAAVGLALLVK 79 60 PIILLVFAACEAAVGLALLVM 80 60 PIILLVFAACERALGLSLLVM 80 60 PIILLVFAACEAALGLSLLVM 80 60 PIILLVFAACEAAIGLALLVM 80 60 PIILLVFAACEAALGLSLLVM 80 60 PIILLVFAACEAALGLSLLVM 80 60 PLILLVFSACEAGVGLALLVK 80 * 415 QWGSLTHHINNMKPSFTRENT 435 415 QWGSLTHHINSMKPSFTRENT 435 415 QRGKLTYHSHNLNPSFTRENT 435 415 QRGKLTNHMINLQPSHTRELT 435 415 QRGKFTYHTNNISPTFTRENT 435 415 QRGKYTHHINSIKPSFTRENA 435 415 QRGKYTYHINNISPSFTRENA 435 415 QRGKHTHHINNITPSFTREHA 435 415 QRGKYTYHIKNIKPSFTRENA 435 415 QRGKYTHHIKNINPSFTRENA 435 415 QRGKLTSHSLSINPSFTREHM 435 * Primates H.sapiens P.paniscus P.troglodytes P.abelli P.pygmeus G.gorilla H.lar L.Catta 60 PIAMLVFAACEAAVGLALLVS 80 60 PITMLVFAACEAAVGLALLVS 80 60 PITMLVFAACEAAVGLALLVS 80 60 PITMLVFAACEAAVGLALLAS 80 60 PITMLVFAACEAAVGLALLAS 80 60 PITMLVFAACEAAVGLALLVS 80 60 PVVLLVFAACEAAVGLALLVS 80 60 PILLLVFAACEAAVGLALLVT 80 415 QWGSLTHHINNMKPSFTRENT 435 415 QWGSLTHHINNMKPSFTRENT 435 415 QWGSLTHHINSMKPSFTRENT 435 415 QRGTPTHHTNNMKPSFTRENT 435 415 QRGTPSHHINNMKPSSTRENT 435 415 QWGPLTHHITNMKPSFTRENI 435 415 QRGTLTHHIKNMKPSLTRENM 435 415 QRGKLTYHSHNLNPSFTRENT 435 Figure 7. Amino acid conservation analysis. Global alignment of ND1, ND4L and ND6 protein sequences from a wide range of eukaryotes, mammals and primates. The neighborhoods (20 amino acids) of m.14582A>G/MT-ND6, m.14258G>A/MT-ND6, m.10680G>A/MT-ND4L and m.12033A>G/MT-ND4 are shown. Rectangles frame these specific variants. Amino acid residues with a percentage of conservation ranging between 70.0% and 79.9% are highlighted
23 in light grey, those between 80.0% and 99.9% are highlighted in dark grey and those invariant (100%) are highlighted in black. Family 1,2 1 2 2
Mutation m.14258G>A m.14582 A>G m.10680 G>A m.12033 A>G
Gene MT-ND6 MT-ND6 MT-ND4L MT-ND4
AA_change p.P139L p.V31A p.A71T p.N425S
PolyPhen2 benign benign benign benign
SIFT neutral neutral neutral neutral
FatHmm neutral neutral neutral neutral
PROVEAN neutral neutral deleterious neutral
MutationAssessor neutral_impact neutral_impact high_impact low_impact
CADD deleterious neutral neutral neutral
PANTHER neutral neutral disease neutral
PhD-SNP neutral neutral disease neutral
MtoolBox neutral neutral neutral deleterious
APOGEE_boost N N N N GB 16/32,059 179/32,059 14/32,059 5/32,059 Frequency 19/31,735 188/31,735 14/31,735 6/31,735 Conservation Eukaryota F 22% G 49% A 86% N 42% Vertebrata F 32% G 69% A 97% N 54%
Mammalia A 37% G 46% A 97% N 70%
Local 63% 85% 87% 77% Global 71% 71% 80% 83% Invariants -57/+2 -2/+1 -11/+3 -8/+6 Table 2. Prediction tools and conservation analysis
24 Ph en ot yp e Nor m al Nor m al Nor m al Nor m al Di ab et es Nor m al Gl io bl as to m a Nor m al Gl io bl as to m a n. a. n. a. Nor m al Ha pl og ro up D ia gn os tic Mi ss en se V ar ia nt s 9053G >A /MT -ATP 6 (S 17 6N ) 10609 T>C /M T-ND4 L (M 47 T) 12406 G >A /M T-ND5 (V2 4I ) 13759 G >A /M T-ND5 (A 47 5T ) 13928 G >C /M T-ND5 (S 53 1T ) 14258G >A /MT -ND6 (P 13 9L ) 14258G >A /MT -ND6 (P 13 9L ) 14258G >A /MT -ND6 (P 13 9L ) 14258G >A /M T-ND6 (P 13 9L ) 14258G >A /MT -ND6 (P 13 9L ) 14258G >A /MT -ND6 (P 13 9L ) 14258G >A /MT -ND6 (P 13 9L ) 9055G >A /MT -ATP 6 (A 17 7T ) 14798T>C /M T-CYB (F 18 L) Mi ss en se Pr iv at e Va ria nt s 14258G >A /MT -ND6 (P 13 9L ) 9948G >A /MT -CO 3 (V 24 8I ) 3511A >G /MT -ND1 (T 69 A) 3511A >G /MT -ND1 (T 69 A) 3511A >G /MT -ND1 (T 69 A) 4084G >A /MT -ND1 (V 26 0D ) 9966G >A /MT -CO 3 (V 25 4I ) 12033A >G /M T-ND4 (N4 25 S) 14258G >A /M T-ND6 (P 13 9L ) 14258G >A /MT -ND6 (P 13 9L ) 14258G >A /MT -ND6 (P 13 9L ) 14258G >A /MT -ND6 (P 13 9L ) 14582A >G /M T-ND6 (V3 1A ) No n-codi ng Pr iv at e Va ria nt s 203G >C /MT -H V2 1709G >A /M T-RN R2 16399A >G /M T-HV1 1009T>C /MT -RN R1 16309A >G /MT -HV1 Syn on ym ou s Pr iv at e Va ria nt s 8697G >A /MT -ATP 6 5237A >G /MT -ND2 11266C >T/ MT -ND4 8251G >A /MT -CO 2 6563C >T/ MT -CO 1 6563C >T/ MT -CO 1 6137T>C / MT -CO 1 6329C >T/ M T-CO 1 8994G >A /M T-ATP 6 11038A >G /M T-ND4 15253A >G /M T-CY B Ha pl og ro up F1a1 H1 q3 H1 q3 H1 q3 H1 q3 H1 q3 H1 q3 H1 q3 H5 b HV2 a2 HV2 a2 K1a Hm tD B Ge no m e Id en tif ie r AS_CN _0 41 9 EU _XX_0538 EU _D K_0876 EU _D K_1085 PA _EU _D K_0471 XX_XX_5717 PA _EU _X X_0019 EU _I T_0707 PA _EU _X X_0017 n. a. n. a. EU _I T_0585 Ge nb an k-HGD P-1000 G P ID HG0 05 89 EF657644 JX 15 39 75 KF161678 KF162479 KM 252740 NA20 81 1 KP340158 KP340159 KC 878720
25 Ph en ot yp e Ped iat ric p at ien ts Nor m al Nor m al Nor m al Nor m al Nor m al Chr oni c Per io do nt iti s Chr oni c Per io do nt iti s Ha pl og ro up D ia gn os tic Mi ss en se V ar ia nt s 4025C >T/ MT -ND1 (T 24 0M ) 4225A >G /M T-ND1 (M 30 7V) 4232T>C /M T-ND1 (I 30 9T ) 5442T>C /M T-ND2 (F 32 5L ) 3308T>C /MT -ND1 (M 1T ) 3338T>C /M T-ND1 (V1 1A ) 6663A >G /M T-CO 1 (I2 54 V) 8584G >A /M T-ATP 6 (A2 0T) 15110G >A /MT -CY B (A 12 2T ) 10506A >G /MT -ND4 L (T 13 A) 139 34C >T/ M T-ND5 (T 53 3M ) 14258G >A /M T-ND6 (P 13 9L ) 10506A >G /MT -ND4 L (T 13 A) 13934C >T/ M T-ND5 (T 53 3M ) 14258G >A /M T-ND6 (P 13 9L ) 10506A >G /MT -ND4 L (T 13 A) 13934C >T/ M T-ND5 (T 53 3M ) 14258G >A /M T-ND6 (P 13 9L ) 3505A >G /MT -ND1 (T 67 A) 5046G >A /M T-ND2 (V1 93 I) 15884G >C /M T-CYB (A3 80 P) 3505A >G /MT -ND1 (T 67 A) 5046G >A /M T-ND2 (V1 93 I) 15884G >C /M T-CYB (A3 80 P) Mi ss en se Pr iv at e Va ria nt s 5460G >A /MT -ND2 (A 33 1T ) 13508C >T/ M T-ND5 (S 39 1F ) 14258G >A /M T-ND6 (P 13 9L ) 8584G >A /MT -ATP 6 (A 20 T) 14258G >A /M T-ND6 (P 13 9L ) 14258G >A /MT -ND6 (P 13 9L ) 3808A >G /MT -ND1 (T168A) 3350T>C /MT -ND1 (I 15 T) 14258G >A /M T-ND6 (P 13 9L ) 3350T>C /MT -ND1 (I 15 T) 5460G >A /M T-ND2 (A 33 1T ) 14258G >A /M T-ND6 (P 13 9L ) No n-codi ng Pr iv at e Va ria nt s 2242T>C /MT -RN R2 444A >G /MT -DL O O P 2352T>C /M T-RN R2 146T>C /MT -HV2 1243T>C /MT -RN R1 Syn on ym ou s Pr ivat e Var iant s 10771A >G /MT -ND4 9374A >G /MT -CO 3 9656T>C /MT -CO 3 14049C >T/ M T-ND5 13785C >T/ MT -ND5 8251G >A /M T-CO 2 8251G >A /MT -CO 2 8952T>C /M T-CO 2 8994G >A /M T-CO 2 Ha pl og ro up L0d 2a1 L2a1c 1a1 U1 b1 U3 a1 a1 U3 a1 a1 U3 a1 a1 W3 a1 b W3 a1 b Hm tD B Ge no m e Id en tif ie r PA _A F_SF_ 0059 AF_N G _0 07 8 XX_XX_6141 EU _PL _0054 EU _I E_0218 EU _I T_0472 PA _X X_X X_0032 PA _X X_X X_0028 Ge nb an k-HGD P-1000 G P ID KC 533510 NA 18 86 8 KF451170/ HGDP 00 64 7 JN 20 32 07 JQ 70 49 50 JX 15 30 17 HM 15 66 92 HM 15 66 96
Table 3. Mitogenome sequences carrying the m.14258G>A/MT-ND6, p.P139L, in common
databases
26 Ph en ot yp e LH O N [3 2] LH O N [26] Nor m al LH O N [3 2] Nor m al Nor m al Nor m al Nor m al Nor m al Ha pl og ro up D ia gn os tic Mi ss en se V ar ia nt s 3548T>C /MT -ND1 (I 81 T) 13942A >G /MT -ND5 (T 53 6A ) 15038A >G /M T-CYB (I9 8V ) 5178C >A /MT -ND2 (L 23 7M ) 8414C >T /M T-ATP 8 (L 17 F) 10400C >T/ M T-ND3 (T 11 4A ) 14979T>C /M T-CYB (I7 8T) 5178C >A /MT -ND2 (L 23 7M ) 10400C >T/ M T-ND3 (T 11 4A ) Mi ss en se P riv at e Va ria nt s 10680G >A /MT -ND4 L (A 71 T) 10680G >A /MT -ND4 L (A 71 T) 14484T>C /M T-ND6 (M 64 V) 10680G >A /MT -ND4 L (A 71 T) 3745G >A /MT -ND1 (A 14 7T ) 10680G >A /M T-ND4 L (A 71 T) 13327A >G /M T-ND5 (T 33 1A ) 10680G >A /MT -ND4 L (A 71 T) 10680G >A /MT -ND4 L (A 71 T) 10680G >A /MT -ND4 L (A 71 T) 9911C >A /MT -CO 3 (F 23 5L ) 10680G >A /M T-ND4 L (A 71 T) 10680G >A /MT -ND4 L (A 71 T) No n-codi ng Pr ivat e Va ria nt s 2352T>C /MT -RN R1 185G >A /MT -H V2 189A >G /M T-HV2 489T>C /M T-HV2 16192C >T/ MT -HV1 16075T>C /MT -HV1 16189T>C /MT -HV1 16224T>C /MT -HV1 16319G >A /MT -HV1 16324T>C /MT -HV1 2141T>C /MT -RN R2 16158A >T/ MT -HV1 Syn on ym ou s Pri vat e Va ria nt s 3540T>C /MT -ND1 13449C >T/ MT -ND5 14239C >T/ M T-ND6 8251G >A /MT -CO 2 11809T>C /M T-ND4 15688C >T/ M T-CY B 9824T>C /MT -CO 3 13389C >T/ MT -ND5 4742T>C /MT -ND2 8865G >R /MT -ATP 6 3447A >G /MT -ND1 6167T>C /M T-CO 1 6293T>C /M T-CO 1 3351C >T/ MT -ND1 3744A >G /M T-ND1 4829A >G /M T-ND2 11566A >G /M T-ND4 12630G >A /M T-ND5 13437T>C /M T-ND5 Ha pl og ro up B4a 1e B4d1 D4 a8 D6 a1 H1 3a 2a H1 b H1 H1 t HV Hm tD B Ge no m e Id en tif ie r PA _X X_X X_0343 PA _X X_X X_0331 AS_TW _0 17 8 PA _X X_X X_0344 EU _G R_0092 EU _N L_0018 XX_XX_1893 XX_XX_2693 XX_XX_6433 Ge nb an k-HGD P-1000 G P ID JN 86 68 24 FJ 986465 KF540683 JN 86 68 25 JX 15 31 17 JQ 70 33 37 JQ 70 24 15 JQ 704194 KF450878/ HGDP 00 11 9