3D
digital image correlation measurements
during
shaping of a non-crimp 3D orthogonal woven E-glass
reinforcement
Juan Pazmino & Valter Carvelli & Stepan V. Lomov & Bart Van Mieghem & Pascal Lava
Received: 17 April 2013 / Accepted: 4 July 2013 / Published online: 20 July 2013
Introduction
During the manufacturing process of composite reinforce-ments, a crucial step is the forming of a flat textile into a three-dimensional shape. After shaping, the preform is injected with resin and consolidated. The shape of the pre-form is generally obtained by a punch and die pre-forming process. The deformation mechanisms occurring during such processes, are an important knowledge in prediction of the permeability of the preform and thus, in the mechanical quality of the composite component [1].
Digital image correlation (DIC) is a contactless technique which offers qualitative and quantitative information on the heterogeneous deformation of an object surface. It provides a full-field displacement over a two- or three- dimensional surface, by comparing images of speckled specimen surfaces before and after deformation. In the last years, in the field of textile composites reinforcements, optical full-field strain measurements have been used for studying: (i) the shear and tensile behaviour of fabrics by bias extension, picture frame and biaxial tests (e.g. [2,3]); (ii) the local deformation mechanisms occurring during mechanical testing, at the level of the reinforcement unit cell and of the individual yarns (e.g. [4]); and finally (iii) to measure the 3D-deformed shape and the distribution of local deformations of a textile reinforce-ment after forming processes (e.g. [5–7]). In [8], the impor-tance of the digital image correlation technique for compos-ite reinforcements characterization is pointed out, mainly due to the adequate determination of the strain field on the specimen surface. Moreover, the authors showed that mea-surement of the local deformations by means of image cor-relation on a composite component after forming provides a convenient tool for the determination of the local fibre ori-entations and shear angles.
In this work, an experimental investigation of a 3D textile composite reinforcement during forming processes is presented. In particular, being the shear deformation considered as the primary deformation mechanism in the shaping process of reinforcements [9], the evolution of shear angle distribution during such process is measured by means of 3D DIC analyses. For this purpose, two different image correlation software
J. Pazmino
:
V. Carvelli (*)Department of Architecture, Built Environment and Construction Engineering, Politecnico di Milano, Piazza Leonardo da Vinci 32, 20133 Milano, Italy
e-mail: [email protected] S. V. Lomov
:
B. Van MieghemDepartment of Metallurgy and Materials Engineering, KU Leuven, Kasteelpark Arenberg 44, 3001 Leuven, Belgium
P. Lava
Association KU Leuven Department of Mechanical Engineering, Catholic University College Ghent, Gebroeders Desmetstraat 1, 9000 Gent, Belgium
programs, namely VIC-3D [10] and MatchID3D [11], are used and compared.
A single layer E-glass non-crimp 3D orthogonal woven reinforcement (commercialized under trademark 3WEAVE® by 3Tex Inc.) is shaped on two moulds, i.e. tetrahedral and double-dome.
The DIC contactless method provides important informa-tion on the complex shape formability of this 3D composite reinforcements having growing interest in the composites industry for a broad range of applications [12].
Non-crimp 3D orthogonal woven reinforcement
The material investigated during forming processes is a single layer E-glass non-crimp 3D orthogonal woven rein-forcement (commercialized under trademark 3WEAVE® by 3Tex Inc.). The fibres architecture of the preform has three warp and four weft layers, interlaced by through thickness (Z-directional) yarns (Fig.1 [13]). The fabric construction results in a ~49 %/~49 %/~2 % ratio of the fibres amounts (by volume) in the warp, weft and Z fibre directions, respec-tively. The fibre material is PPG Hybon 2022 E-glass. Some features of the non-crimp 3D orthogonal weave reinforce-ment are listed in Table1.
The reader is referred to [14] for a detailed description of the preform architecture, studied with optical microscopy
and micro-CT. Moreover, the mechanical properties during forming of the 3D glass reinforcement are illustrated in [3].
Experimental details
Experimental set-up
The forming process of the above mentioned 3D composite reinforcement is investigated with the set-up illustrated in Fig.2. It consists of metallic components and optical instru-ments. Two steel punches with complex shapes (i.e. tetrahe-dral and double-dome), and two steel open dies are used. The tetrahedral punch is similar to the one adopted in [7], while the double-dome mould is that used in [15] for the thermoforming process of glass-PP woven fabrics. Geome-try and dimensions of the tools are illustrated in Fig.3. The optical part of the set-up consists of a stereo vision system (Fig. 2), which acquires digital images of the forming pro-cess at a frequency of 1 Hz. These images are analysed for 3D image correlation by VIC-3D [10] and MatchID3D [11]. Rectangular specimens of the 3D reinforcement (500× 600 mm) are placed unclamped on the open die. The punch moves downwards for 65 mm at a constant rate of 10 mm/min.
The moulds are mounted on an Instron 5567 tensile ma-chine, measuring the load with a cell of 30 kN.
3D digital image correlation
This section focuses on the optical part of the set-up and the software settings used for the 3D digital image correlation analyses. The optical instruments are two digital 2/3″ CCD cameras (image size 1,392×1,040, 1.45 MP) with Schneider Xenoplan 2.8/50 mm lenses, mounted vibration-free on the bottom of the open die at approximately 470 mm (see Fig.2a). This distance, combined with an aperture setting of f/8, en-sures that the reinforcement is completely visible in the field of view of the cameras (see Fig. 4), and that the necessary depth of field (approximately 65 mm) is achieved. The pixel resolution for the tetrahedral and double-dome set-up is about 5 px/mm. The stereo system is calibrated with a 12×9 dots
warp
weft
Z-yarn
warp yarn
weft yarn
Fig. 1 Architecture of the tows inside the non-crimp 3D orthogonal weave preform [13]: photo (left) and sketch (right) of the unit cell
Table 1 Properties of the non-crimp 3D orthogonal weave preform. Data provided by 3Tex Inc
Fabric plies 1
Areal density (g/m2) 3255 Warp yarns Insertion density (ends/cm) 2.76
Top and bottom layer yarns (tex) 2275 Middle layer yarns (tex) 1100 Weft yarns Insertion density (ends/cm) 2.64
Yarns (tex) 1470
Z yarns Insertion density (ends/cm) 2.76
a
b
Stereo vision system blank holder Tetrahedral punch blank Stereo vision system blank holder Double-dome punch blankFig. 2 (a) Tetrahedral and (b) double-dome forming test set-up
a
b
75 mm 160 mm 134 mm Top view Side view 400 mm 147.2 mm 170 mm 250 mm 366 mm 59 mm 169 mm 153 mm 63 mm 197 mm 147 mm Top view Side view 400 mm 250 mm 157 mm 173 mm 370 mm 123.25 mm 197 mm 110 mmFig. 3 Dimensions of the forming tools: (a) tetrahedron (left) and its open die (right); (b) double-dome (left) and its open die (right)
calibration pattern with an inner dots distance of 6.02 mm and 9.01 mm for the tetrahedral and double-dome punch, respec-tively. Calibration is executed in the calibration module of VIC3D. The obtained parameters are used for the correlations with VIC3D and MatchID3D to exclude possible calibration errors. Intrinsic and extrinsic camera parameters are listed in Table2.
Concerning the reinforcement preparation, the specimen surface is lightly sprayed with white and black acrylic paint (see Fig.4) in order to get a random, non-repetitive, isotropic and high contrast speckle pattern, necessary for accurate displacement measurements [16]. During the test, images are acquired at a rate of 1 Hz, corresponding to a vertical increment of the punch of about 0.167 mm.
The correlation and calculation of the displacements of the speckle patterns is performed with the two correlation software packages: the commercial software VIC-3D [10] and the academic software MatchID3D [11], developed at Catholic University College of Ghent. The correlation set-tings used for both software packages are listed in Table3. The spatial resolution, often interpreted as the complete indepen-dent area needed to calculate a specific quantity, for strain calculations in both platforms is defined as (Sw−1)×St+Ss; where Sw, St and Ss are the strain window, the step and the subset, respectively.
The main benefit of digital image correlation is the ability to perform a full-field displacement measurement by means of a contactless technique. One drawback could be the
a
b
camera 0 camera 1 before shaping after shaping camera 0 camera 1 before shaping after shaping camera 0 camera 1 camera 0 camera 1Fig. 4 Field of view of cameras before and after shaping: (a) tetrahedral and (b) double-dome forming
Table 2 Camera parameters af-ter a calibration with VIC-3D; two values of the same parameter refers to camera 0 and camera 1, respectively
Parameter Double-dome Tetrahedron
Intrinsic Focal length in X [px] - fx 2523.71/2539.23 2526.51/2543.24 Focal length in Y [px] - fy 2522.81/2538.83 2527.66/2543.93 Focal point skew [px] - fs −0.244627/0.237266 0.678489/−0.30637 Principle point X [px] - cx 717.582/679.705 726.67/681.416 Principle point Y [px] - cy 526.571/513.564 535.388/530.324 Spherical Distortion Kappa 1 −0.145075/
−0.140043 −0.149178/−0.140605 Extrinsic X translation [mm] - Tx −189.646 213.945
Y translation [mm] - Ty 2.13313 −2.19175 Z translation [mm] - Tz 35.217 43.7965 Rotation angle about optical axis Alpha [deg] 0.237273 −1.49954 Stereo rotation angle Beta [deg] 23.111 −26.2971 Tilt angle Gamma [deg] 1.16553 1.00684
Baseline [mm] 192.888 218.393
degradation of the pattern in high deformed parts resulting in zones without data due to the loss of correlation.
Results and comparisons
The‘grid method’, adopted in [8] during forming of 2D com-posite reinforcements, is used to measure local deformations of the 3D fabric during shaping. The grid consists of facets, made by spacing of points (i.e. step size in pixels), in the Area of Interest (AoI) analysed during correlation. For each recorded incremental position of the mould, the 3D displacement in the field of view of the cameras is obtained with DIC. The recorded data allows post-processing for evaluation of the local shear angle as the variation, with respect to the un-deformed shape, of the angle between initial orthogonal segments. Assuming a
box as a set of facets, the local shear angle (γ) is quantified as: γ=αf− αi, where, ai and af are the angles between the two
consecutive sides of a box in the un-deformed and deformed configuration, respectively. Each box is square in the initial configuration and is made of 10×10 and 6×6 facets for the tetrahedron and double-dome respectively. The adopted box dimensions are such that its size is very close to the unit cell of the considered 3D textile (≈6×6 mm2
), for the evaluation of the shear angle at the meso-scale. The steps carried out to measure the shear angle distribution on the reinforcement surface are summarized in Fig.5.
For both shapes, the specimens had the initial yarn directions parallel to the die’s sides. Four specimens for each forming shape are used. The results obtained with VIC-3D and MatchID3D software, are compared in terms of displacements and shear angles distribution, for a tetrahedral punch displacement
Table 3 Comparison of the cor-relation settings for VIC-3D and MatchID3D
Correlation Software VIC-3D MatchID3D Correlation algorithm Normalized sum square
differences (NSSD)
Zero-normalized cross-correlation (ZNCC) Interpolation Optimized 8-tap Bicubic polynomial interpolation
(Stereo) Transformation Affine
Correlation progress Incremental Spatial + Update ref. Subset weights/Noise handling Gaussian Gaussian
Strain tensor Green-Lagrange Green-Lagrange Filter size [px]/Strain window 15 15
Subset size [px2] 40×40 40×40
Step size [px] 3 for tetrahedron 3 for tetrahedron 5 for double-dome 5 for double-dome Spatial strain resolution [px] 82 for tetrahedron 82 for tetrahedron
110 for double-dome 110 for double-dome
3D displacement measurement
Shear angle evaluation
3D DIC analysis
camera 0 camera 1Shear angle
distribution
Un-deformed box Deformed boxFig. 5 Steps for local shear angle calculation by 3D digital image correlation analysis
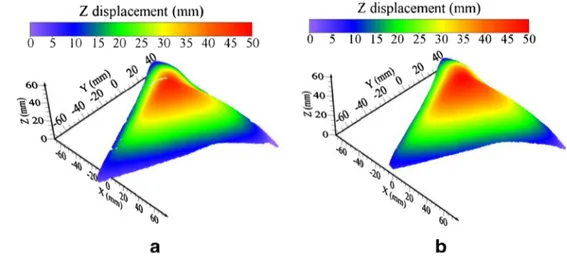
of 50 mm, and at the end of the double-dome forming process (punch displacement of 65 mm). The data for the tetrahedron are presented for a lower punch displacement due to the lack of correlation in some parts of the surface at the end of the shaping. Since displacements are the input for shear angle calculation, the first assessment of the accuracy of the two measurement devices involves the 3D displacement field of the deformed configuration. Figures6and 7show the displacement field on
the observed AoI surface of one specimen for each considered shape. The contour plots demonstrate agreement of the displace-ment fields. The discrepancy between the measuredisplace-ments is repre-sented in Fig.8, where the difference of the shapes is highlighted. The maximum difference of the displacement is below 5 % of the maximum imposed punch displacement. This is due to the differ-ent correlation algorithms and could be considered negligible for the deformability assessment of the considered 3D reinforcement.
Fig. 6 Tetrahedron formability test. Displacement field on the reinforcement surface for 50 mm of punch displacement by: (a) VIC-3D and (b) MatchID3D
Fig. 7 Double-dome formability test. Displacement field on the reinforcement surface at the end of shaping process by: (a) VIC-3D and (b) MatchID3D
Fig. 8 Difference of the recorded shapes measured by the two DIC software. (a) tetrahedron; (b) double-dome
Fig. 9 Tetrahedron formability test. Shear angle distribution on the reinforcement surface for 50 mm of punch displacement by: (a) VIC-3D and
(b) MatchID3D
Fig. 10 Double-dome formability test. Shear angle distribution on the reinforcement surface at the end of forming process by: (a) VIC-3D and (b) MatchID3D
a
b
0 10 20 30 40 Inspected length 'L' [mm] 0 5 10 15 20 25 Sh ea r a n g le [d e g ] Tetrahedron VIC-3D MatchID3DL
0 20 40 60 80 Inspected length 'L' [mm] 0 5 10 15 20 25 Sh ea r a n gl e [d e g] Double-dome VIC-3D MatchID3DL
Fig. 11 Comparison of the shearangle along one segment on the surface at the end of forming process. Polynomial fitting for: (a) tetrahedron; (b) double-dome
Post-processing of the three-dimensional displacement field allows evaluation of the shear angle distribution inside the AoI of the preform surface. Figure9shows shear angles produced during the tetrahedral forming evaluated with input of both DIC packages. The shaping of the 3D reinforcement generates shear angles lower than about 23 deg, for a punch displacement of 50 mm. The maps in Fig.9indicate a larger concentration of shear angles located on the face sides of the tetrahedron. The comparison of the predicted shear angle with the two DIC displacement fields is presented in Fig.11a. Along a segment in the maximum shear angle concentration zone, the difference is below 2 deg. This can be considered acceptable being the main purpose of the measurements the evaluation of the shear angle distribution on the complete forming shape and consid-ering the different correlation algorithms adopted.
Forming of the double-dome gives the shear angle dia-grams in Fig.10. VIC-3D and MatchID3D provide shear angle not exceeding 25 deg. The concentration of the higher shear angles is in the higher curvature zones, bottom right and left in Fig.10. In Fig.11b, the comparison of the shear angle along a segment in the maximum concentration zone shows the larger difference below 3 deg. As above mentioned, con-sidering the main purpose of this work, the obtained shear angle distributions can be considered accurate.
Overall, the comparisons, detailed in Figs6,7,9, and10, show a good agreement between the measurements obtained by VIC-3D and MatchIDVIC-3D. Furthermore, these results demonstrate that 3D digital image correlation technique can be very useful for the continuous measurement and monitoring of complex shape forming processes with 3D composite reinforcements, and in particular with the considered E-glass non-crimp 3D orthogonal woven fabric.
Conclusions
The presented experimental investigation is dedicated to the forming process of a single layer E-glass non-crimp 3D orthogo-nal woven reinforcement (commercialized under trademark 3WEAVE® by 3Tex Inc.). The adopted methodology involves the application of 3D digital image correlation technique for continuous measurement of the local deformation during forming. The experimental results show a good agreement between the measurements obtained by two software packages, namely VIC-3D and MatchID3D. The results gathered by 3D digital image correlation analyses, reveal the adequacy of this tech-nique to measure displacement based quantities (e.g. shear angle), during complex shape forming processes of 3D com-posite reinforcements.
The collected data constitute an extensive dataset for the assessment of numerical methods predicting the complex shape forming behaviour of such 3D reinforcement for com-posite materials. The input data for such calculation are the measurements of the shear and tension deformation response of the 3D reinforcement detailed in [3].
Acknowledgments 3Tex Inc. is acknowledged for manufacturing and supplying the non-crimp 3D orthogonal weave E-glass reinforce-ment (3WEAVE®).
References
1. Boisse P (2011) Composite reinforcements for optimum perfor-mance, Woodhead Publishing Limited
2. Willems A, Lomov SV, Verpoest I, Vandepitte D (2009) Drape-ability characterization of textile composite reinforcements using digital image correlation. Opt Lasers Eng 47:343–351
3. Carvelli V, Pazmino J, Lomov SV, Verpoest I (2012) Deformability of a non-crimp 3D orthogonal weave E-glass composite reinforce-ment. Compos Sci Technol 73:9–18
4. Launay J, Hivet G, Duong AV, Boisse P (2008) Experimental anal-ysis of the influence of tensions on in plane shear behaviour of woven composite reinforcements. Compos Sci Technol 68:506–515 5. Vanclooster K, Lomov SV, Verpoest I (2009) Experimental validation
of forming simulations of fabric reinforced polymers using an unsym-metrical mould configuration. Composites: Part A 40:530–539 6. Khan MA, Mabrouki T, Vidal-Sallè E, Boisse P (2010) Numerical
and experimental analyses of woven composite reinforcement forming using a hypoelastic behaviour. Application to the double dome benchmark. J Mater Process Technol 210:378–388 7. Allaoui S, Boisse P, Chatel S, Hamila N, Hivet G, Soulat D, Vidal-Salle
E (2011) Experimental and numerical analyses of textile reinforcement forming of a tetrahedral shape. Composites: Part A 42:612–622 8. Lomov SV, Boisse P, Deluycker E, Morestin F, Vanclooster K,
Vandepitte D, Verpoest I (2008) Full-field strain measurements in textile deformability studies. Composites: Part A 38:1232–1244 9. Polturi P, Parlak I, Ramgulam R, Sagar TV (2006) Analysis of tow
deformations in textile preforms subjected to forming forces. Compos Sci Technol 66:297–305
10. Correlated Solutions, Inc. (2012) VIC-3D, Irmo, SC, USA:http:// www.correlatedsolutions.com
11. MatchID - Image Correlation & Material Identification Mechanics of Materials, Products & Processes,http://www.matchid.org/, 2012 12. Bogdanovich AE, Mohamed MH (2009) Three- dimensional
rein-forcement for composites. SAMPE J 45:8–28
13. Carvelli V, Gramellini G, Lomov SV, Bogdanovich AE, Mungalov DD, Verpoest I (2010) Fatigue behaviour of non-crimp 3D orthog-onal weave and multi-layer plain weave E-glass reinforced com-posites. Compos Sci Technol 70:2068–2076
14. Desplentere F, Lomov SV, Woerdeman DL, Verpoest I, Wevers M, Bogdanovich A (2005) Micro-CT characterization of variability in 3D textile architecture. Compos Sci Technol 65:1920–1930 15. Willems A (2008) Forming simulation of textile reinforced shell
structures - PhD. Thesis, Katholieke Universiteit Leuven 16. Sutton MA, Orteu JJ, Shreir HW (2009) Image correlation for
shape, motion and deformation measurements: basic concepts, theory and applications, Springer