A LONG-LASTING QUIESCENCE PHASE OF THE ERUPTIVE VARIABLE V1118 ORI
D. Lorenzetti1, S. Antoniucci1, T. Giannini1, A. Harutyunyan2, A. A. Arkharov3, V. M. Larionov3,4,5, F. Cusano6, A. Di Paola1, G. Li Causi1, B. Nisini1, R. Speziali1, and F. Vitali1
1
INAF—Osservatorio Astronomico di Roma, via Frascati 33, I-00040 Monte Porzio, Italy;
[email protected],[email protected],[email protected],[email protected],
[email protected],brunella [email protected],[email protected],[email protected] 2
Fundación Galileo Galilei INAF, Telescopio Nazionale Galileo, E-38700 Santa Cruz de la Palma, Tenerife, Spain;[email protected] 3
Central Astronomical Observatory of Pulkovo, Pulkovskoe shosse 65, 196140 St. Petersburg, Russia;[email protected] 4
Astronomical Institute of St. Petersburg University, Russia;[email protected] 5
Isaac Newton Institute of Chile, St. Petersburg branch, Russia 6
INAF—Osservatorio Astronomico di Bologna, via Ranzani 1, I-40127 Bologna, Italy;[email protected]
Received 2014 December 12; accepted 2015 January 20; published 2015 March 17 ABSTRACT
V1118 Ori is an eruptive variable belonging to the EXor class of pre-main-sequence stars whose episodic outbursts are attributed to disk accretion events. Since 2006, V1118 Ori has been in the longest quiescence stage ever observed between two subsequent outbursts in its recent history. We present near-infrared photometry of V1118 Ori carried out over the last eight years, along with complete spectroscopic coverage from 0.35 to 2.5μm. Long term sampling of V1118 Ori in quiescence has never been performed, and hence we can benefit from the current circumstance by determining the lowest values (i.e., the zeroes) of the parameters to be used as reference for evaluating the physical changes typical of more active phases. A quiescence mass accretion rate of 1–3 × 10⁻⁹M☉
yr−1can be derived and the difference from previous determinations is discussed. Based on line emission and IR color analysis, a visual extinction of 1–2 mag is consistently derived, confirming that V1118 Ori (at least in quiescence) is a low-extinction T Tauri star with a bolometric luminosity of about 2.1 L☉. An anti-correlation
exists between the equivalent width of the emission lines and the underlying continuum. We searched the literature to evaluate whether or not such behavior is a common feature for the whole class. The anti-correlation is clearly recognizable for all of the available EXors in the optical range(Hβ and Hα lines); however, this is not as evident in the infrared (Paβ and Brγ lines). The observed anti-correlation supports the accretion-driven mechanism as the most likely to account for continuum variations.
Key words: accretion, accretion disks– infrared: stars – stars: emission-line, Be – stars: individual (V1118 Ori) – stars: pre-main sequence – stars: variables: general
1. INTRODUCTION
After accumulating most of their final mass, young stellar objects of low to intermediate mass(0.5–8M) appear as
pre-main-sequence objects while the mass accretion process continues at a lower rate. In this phase, the source is expected to accrete from its circumstellar disk: matter moves through the viscous disk and eventually falls onto the star surface following magnetic interconnection lines(Shu et al.1994). Observations show that the disk accretion process takes place through rapid and intermittent outbursts, usually detected at optical and near-infrared (near-IR) wavelengths, which can be related to a sudden increase of the mass accretion rate by orders of magnitude (e.g., Hartmann & Kenyon 1985; Antoniucci et al. 2008). An in-depth study of these accretion events is crucial to understand(i) how the process eventually halts (thus determining the observed initial mass function); (ii) how the bursts substantially alter the physical and chemical properties of the circumstellar disk with major effects on the formation of proto-planetary systems; and (iii) the mechanism(s) at the origin of such outbursts.
While small and irregular photometric variations (typically 0.2–1 mag) caused by disk accretion variability are a defining feature of all classical T Tauri stars, several young sources display powerful outbursts of much larger intensity (up to 4–5 mag). Depending on different properties (burst duration, recurrence time between subsequent bursts, accretion rate, presence of absorption or emission lines), these objects are
usually classified as FUors (Hartmann & Kenyon 1985) and EXors (Herbig et al. 1989). The latter are more suitable for observational monitoring, since their variations typically occur on shorter timescales: outburst durations range from a few months to one year, accompanied by longer quiescence periods (years); moreover, they present accretion rates of the order of (10−6–10−7
☉
M yr−1), and emission line spectra (e.g.,
Loren-zetti et al.2009; Kóspál et al.2011; Sicilia-Aguilar et al.2012). The reader is also referred to the excellent review by Audard et al. (2014), who provide a complete view of the EXor properties.
Indeed, the nature of EXors is still very uncertain: no detailed analysis or modeling of their disk structure has been performed so far, and so the mechanism responsible for the onset of the accretion outbursts is not known. Proposed scenarios involve thermal instability in the disk or gravitational instability triggered by a close companion (or planet). The latter alternative seems less probable, since in that case subsequent outbursts should occur with some periodicity instead of repeating at irregular time intervals.
The very uncertain picture of EXor events stems not only from the small number of known EXor objects (around two dozen; e.g., Lorenzetti et al. 2012; Audard et al. 2014), but especially from the lack of proper multi-wavelength monitoring of their photometric and spectroscopic properties, which has prevented the construction of a comprehensive database of information for these objects. For this reason, we started an
The Astrophysical Journal, 802:24 (9pp), 2015 March 20 doi:10.1088/0004-637X/802/1/24
observational program dubbed EXORCISM (EXOR OptiCal and Infrared Systematic Monitoring; Antoniucci et al.2013) that is intended to perform photometric and spectral monitoring in the range 0.5–2.5 μm of about 20 objects identified as known eruptive variables(EXor) or candidates. Here, in the framework of such a project, we present optical and near-IR data of the typical source V1118 Ori collected during a quiescence phase on different dates between 2006 September and 2014 October.
In its recent history, V1118 Ori has undergone five documented outbursts, each lasting several years (1982–84, 1988–90, 1992–94, 1997–98, 2004–06). An account of the first four events is provided in Parsamian et al. (1993), García & Parsamian(2000), Herbig (2008), and references therein. For a complete review of the V1118 Ori properties shown during its last eruption, see Audard et al. (2005, 2010) and Lorenzetti et al.(2006,2007). Recently, Reipurth et al. (2007) discovered the binary nature of V1118 Ori, detecting a close companion separated by 0.18 arcsec and about a factor of 1.4 fainter in the Hα filter (∼0.4 mag).
Typically, outburst phases of EXors are monitored more frequently than quiescence ones, although the latter are just as relevant (e.g., Sipos et al. 2009). In fact, only during these phases can the lowest values (the zeroes) of the different
2006 Sep 28 54006.6 12.62 11.60 10.85 2008 Nov 02 54772.6 12.39 11.39 10.59 2006 Sep 29 54007.6 12.67 11.63 10.89 2008 Nov 03 54773.6 12.36 11.37 10.60 2006 Sep 30 54008.6 12.66 11.65 10.92 2008 Nov 09 54779.5 12.41 11.44 10.72 2006 Oct 01 54009.6 12.65 11.60 10.91 2008 Nov 11 54781.5 12.39 11.43 10.67 2006 Oct 02 54010.6 12.63 11.61 10.91 2008 Nov 17 54787.5 12.28 11.35 10.62 2006 Nov 15 54054.5 12.66 11.67 10.98 2008 Nov 20 54790.5 12.21 11.30 10.56 2006 Nov 16 54055.6 12.69 11.69 11.01 2009 Mar 01 54891.2 12.30 11.38 10.69 2006 Nov 19 54058.5 12.66 11.64 10.98 2009 Mar 13 54903.3 12.29 11.37 10.63 2006 Nov 20 54059.5 12.67 11.65 10.97 2009 Mar 17 54907.3 12.43 11.48 10.77 2006 Nov 24 54063.5 12.57 11.54 10.88 2011 Oct 27 55861.6 12.66 11.71 11.06 2006 Nov 26 54065.5 12.74 11.72 11.04 2011 Nov 01 55866.6 12.65 11.64 11.00 2006 Nov 28 54067.6 12.60 11.61 10.92 2011 Nov 09 55874.6 12.62 11.57 10.93 2006 Nov 30 54069.5 12.61 11.62 10.94 2011 Nov 14 55879.5 12.66 11.65 11.04 2006 Dec 02 54071.5 12.69 11.67 10.97 2011 Nov 19 55884.5 12.60 11.60 10.94 2006 Dec 06 54075.5 12.69 11.69 11.00 2013 Sep 26 56561.6 12.66 11.67 10.97 2006 Dec 08 54077.4 12.63 11.64 10.93 2013 Oct 14 56579.6 12.67 11.66 11.00 2006 Dec 12 54081.5 12.70 11.68 11.01 2013 Oct 25 56590.6 12.61 11.55 10.82 2006 Dec 14 54083.5 12.60 11.59 10.92 2013 Dec 18 56644.5 12.58 11.61 10.94 2007 Feb 05 54137.3 12.69 11.72 11.08 2013 Dec 23 56650.4 12.62 11.62 10.91 2007 Mar 12 54172.3 12.73 11.77 11.15 2014 Mar 11 56728.3 12.69 11.61 10.88 2007 Oct 11 54385.6 12.60 11.59 10.90 2014 Mar 13 56730.3 12.61 11.57 10.82 2007Oct 16 54390.6 12.61 11.60 10.90 2014 Mar 18 56735.3 12.64 11.58 10.89 2007 Oct 26 54400.6 12.57 11.54 10.79 2014 Sep 30 56930.7 12.68 11.60 10.86 2007 Nov 03 54408.6 12.44 11.44 10.71 2014 Oct 18 56948.6 12.63 11.57 10.87 Note.
aTypical errors of the near-IR magnitudes do not exceed 0.03 mag.
Figure 1. JHK light curves of V1118 Ori. In the lower panel (J band), data points corresponding to the highestflux levels are depicted in red, while those typical of a more quiescent state are shown in blue.
parameters be accurately evaluated, thus allowing one to compute the physical changes once the outburst values are obtained. Moreover, because of their longer duration, the quiescence phases can be observationally traced more easily than the outbursting phases.
Unfortunately, the quiescence status of V1118 Ori has never been thoroughly sampled, and in this paper we try to fill this gap. In Section 2, optical and near-IR observations are presented. The results are analyzed in Section 3 and our concluding remarks are presented in Section4.
2. OBSERVATIONS 2.1. Near-IR Imaging
Near-IR data were obtained at the 1.1 m AZT-24 telescope located at Campo Imperatore(L’Aquila—Italy) equipped with the imager/spectrometer SWIRCAM (D’Alessio et al. 2000), which is based on a 256 × 256 HgCdTe PICNIC array. Photometry was performed with broadbandfilters J (1.25 μm), H (1.65 μm), and K (2.20 μm). All of the observations were obtained by dithering the telescope around the pointed position. The raw imaging data were reduced using standard procedures for bad pixel removal, flat fielding, and sky subtraction. Photometric data are listed in Table 1 while the derived light curves are depicted in the three panels of Figure1for the J, H, and K bands, respectively. In the bottom panel (J band), we present two groups of activity phases: a long-term quiescence state (blue dots) and a short period of moderate activity (red dots). These states have been arbitrarily identified with a J-band magnitude greater(less) than 12.4, respectively. We will discuss these phases in greater detail in Section 3.1.
Near-IR data cover a period lasting eight years from 2006 September to 2014 October; the data have been collected without a systematic cadence and with no monitoring for long periods(of about one year) during which, however, no sign of outburst was reported (from both AAVSO circulars and Astronomer’s Telegrams). Signs of modest activity (about 0.4 mag peak to peak) with short duration are superposed on such a long quiescence state(see Figure1) that follows the last outburst, whose complete photometry is given elsewhere (Audard et al. 2010; Lorenzetti et al. 2006,2007).
2.2. Optical Spectroscopy
Optical spectra were taken on two different occasions(2014 March 25 and August 12, JD 2,456,741 and 2,456,881, respectively). The first was obtained with the 8.4 m Large
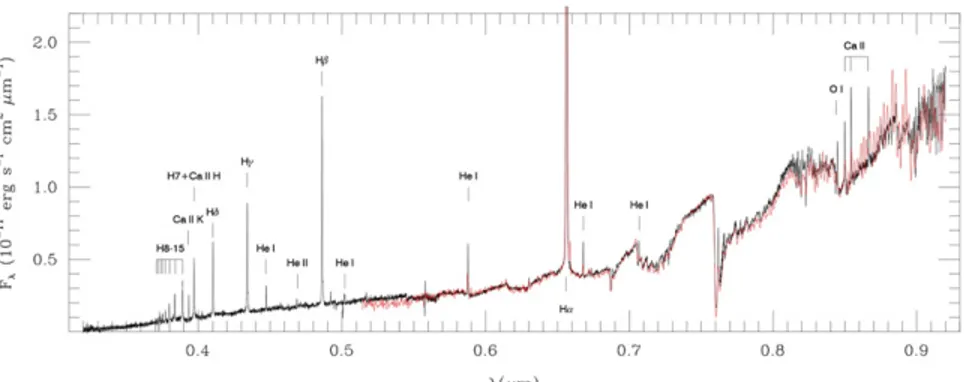
Binocular Telescope (LBT) using the Multi-object Double Spectrograph (MODS; Pogge et al. 2010). The dual grating mode(Blue + Red channels) was used for a total integration time of 20 minutes to cover the 0.35–0.95 μm spectral range with a 0.6 arcsec slit(resolution ∼2000). The second spectrum was obtained with the 3.6 m Telescopio Nazionale Galileo (TNG) using the Device Optimized for the LOw RESolution (DOLORES) instrument. The low-resolution red (LR-R) grism was used for a total integration time of 30 minutes to cover the 0.50–0.95 μm spectral range with a resolution of ∼700. In both cases (LBT and TNG), images were bias and flat-field corrected using standard procedures. After removing sky background, the two-dimensional spectra were extracted and collapsed to one dimension. For both spectra, wavelength calibration was achieved through available lamp exposures, while spectral calibration was obtained from observations of spectrophotometric standards. The optical spectra of V1118 Ori are depicted in different colors(black for LBT, red for TNG) in Figure 2. These are the only quiescence spectra with a high level of sensitivity comparable to that of the Herbig (2008) data. Both spectra show an extraordinary degree of repeat-ability concerning the continuum shape, whereas the derived line fluxes present variations of less than 20%. Such an occurrence might be the result of the extreme steadiness of this quiescence state, which, as such, can be considered very suitable for deriving the parameters of the object in its low state.
2.3. Near-IR Spectroscopy
A low-resolution spectrum ( ∼ 500, slit width 1 arcsec) was obtained on 2014 August 26 with NICS at TNG with two IR grisms IJ (0.90–1.45 μm) and HK (1.40–2.50 μm) in two subsequent exposures of 20 and 25 minutes, respectively. The standard ABB′A′ mode was exploited within a long slit oriented at a position angle of40 in order to minimize the flux of a closefield star entering the slit. The spectral images were flat-fielded, sky-subtracted, and corrected for optical distortions in both the spatial and spectral directions. Telluric features were removed by dividing the extracted spectra by that of a normalized telluric standard star, once corrected for its intrinsic spectral features. Wavelength and flux calibration were obtained from arc lamps and from our photometric data taken in the same period, respectively. In Figure3both portions(IJ and HK) of the resulting near-IR spectrum are given along with labels for the relevant identified features.
the entire spectral range, then such a correction would be marginal.
In Figure4, the near-IR two-color plot is presented based on the photometric data given in Table1. Data points are depicted with different colors(blue and red) to indicate the two different levels of activity shown in Figure1(see Section2.1). Based on inspection of the two-color plot, two considerations can be retrieved. First, all of the data roughly cluster in the locus typical of T Tauri stars of a late spectral type with very low extinction. In particular, a value of AV 1–2 mag can
reasonably account for the data distribution. Second, a separation between the color of the quiescence phase (blue) and that of the moderate activity which occurred from 2008 to 2009(points in red) is recognizable. In particular, using black filled dots, we depicted the median values of the two distributions(considering 1σ error). The same trend (i.e., that different colors are associated even with modest continuum variations) has also been found by analyzing the light curves of different EXors (T. Giannini et al. 2015, in preparation). Indeed, the more significant decreases occurring in both colors (i.e., a bluing effect) are commonly associated with the outburst phases of EXors (Lorenzetti et al. 2007; Audard et al.2010; see, e.g., Figure 1 of Lorenzetti et al.2012). In the latter paper, the authors discuss how these variations cannot be accounted for simply by extinction, but rather must be attributed to an additional thermal component of the emission. Such a circumstance also seems to be confirmed for the moderate activity presented here, since the red points are located fairly orthogonal to the extinction curve rather than along it.
Taking into account the lowest photometric values detected, Audard et al.(2010) provided a plot of the quiescence spectral energy distribution(SED; their Figure 15, left) and an estimate of 2.0 L☉ for the bolometric luminosity. By substituting their
JHK photometry with our values taken on 2007 March 12 and by applying the online fitting procedure7 (Robitaille et al. 2006, 2007), we obtain practically the same value for the bolometric luminosity (2.1 L☉). Moreover, the output
parameters(such as T= 4080 K and M= 0.7M☉) are quite
compatible with the known physical parameters of V1118 Ori (T 3700 K; M= 0.4M☉—Hillenbrand1997).
3.2. Optical and Near-IR Spectroscopy
The emission lines detected in the spectrum of the target are among those commonly observed in active young sources. A list of these lines is given in Table 2. The most prominent emission features are the HIrecombination lines of the Balmer
and Paschen series, which are commonly associated withflows of accreting gas (e.g., Calvet et al.2000,2004). Balmer lines
of the source, although they are present as the strong nebular contribution eliminated by sky emission subtraction. This circumstance and the non-detection of [FeII] (e.g., lines at
0.71–0.74, 1.25, and 1.64 μm) and H2(2.12 μm) transitions
indicate that at least in the current quiescence state, there is no significant outflow activity from the source. This result is supported by the H2 images of the Catalog of Molecular
Hydrogen Emission-Line Objects (Davis et al. 2010) where some H2filamentary structures are present in the field but are
unrelated to V1118 Ori.
From the observed emission lines we derived an estimate of the mass accretion rate(M˙acc) of the quiescent phase of V1118
Ori. For that, we employed the set of empirical relationships that connect the line and accretion luminosity(Lacc) derived by
Alcalá et al.(2014) in a sample of young active T Tauri stars in Lupus. By adopting a distance of 400 pc, we computed the accretion luminosity from 24 different tracers while avoiding blended lines. The Laccvalues thus inferred were then
converted to mass accretion rates by using the following relationship(e.g., Gullbring et al.1998):
= æ è çç çç -ö ø ÷÷÷ ÷ -M L R GM R R ˙ * * 1 * , (1) acc acc in 1
where we assumed M* = 0.4M, R* = 1.29R
(Hillen-brand 1997; Stassun et al. 1999), and a typical inner radius =
Rin 5 *R . The M˙accvalues that we derive by adopting a
visual extinction of AV= 1 are reported in Table2. These are
comprised in the interval between 2 ´10-10and 4 ´10-9with a
median M˙accof about 1 ´10-9Myr−1and a 1σ dispersion of 7
´10-10
M yr−1. By assuming AV = 2 instead, we obtain a
median accretion rate of about 3 ´10-9 M yr −1with a
dispersion of 1.6 ´10-9 M yr −1. The single accretion rates
derived in both cases from all 24 lines are shown in Figure5. We note that our M˙accestimates are much lower than the
previously estimated quiescence M˙accof 2.5 ´10-7M
yr−1derived by Audard et al. (2010) from SED modeling; further discussion on this aspect is provided in Section3.3.
3.3. Comparison with the Outburst Phase
Here, we perform a comparison between our inferred quiescence parameters and those derived during more active phases.
Bolometric luminosity Lbol—from the SED fitting, a value of 2.0 L☉ is given (Audard et al. 2010 and confirmed in
Section 3.1) for the quiescent luminosity. Different estimates are given for the outburst luminosity: 25.4 L☉ (Lorenzetti
et al.2006) and 7.4L☉(Audard et al.2010). These values refer
to two different outbursts that likely exhibit different levels of brightness; nevertheless, a substantial increase of the 7
luminosity certainly occurs, related to the appearance of the spot on the stellar surface and to the thermal disk contribution. Visual extinction AV—from the near-IR two-color plot
(Figure 4) and from the line emission analysis, AV values of
about 1–2 mag are consistently obtained. The extinction does not seem to change in the outburst during which Audard et al. (2010) derived, from X-rays column density, AVvalues of 1.7 -+ mag 0.6 0.8 or 1.4 -+ mag 0.5 0.6 for R Vequal to 3.1 or 5.5, respectively.
A constant extinction suggests that changes of other physical parameters are not attributable to significant amounts of intervening dust (see also Lorenzetti et al. 2009; Audard et al.2010).
Mass accretion rate M˙—in Section3.2M˙accvalues of 1 or 3
´10-9
M yr−1were derived depending on the assumed AV, 1
or 2 mag, respectively. This value is two orders of magnitude lower than the previously estimated quiescence M˙accof 2.5
´10-7
M yr−1derived by Audard et al. (2010) from SED modeling. This discrepancy is likely related to the different methods employed for the computation of the accretion rate. Accretion estimates from the emission lines are to be regarded
as more reliable, since the lines are believed to trace the accretion columns or the strong accretion-related winds from the object. Moreover, the empirical accretion luminosity-line luminosity relationships, which are widely used as a proxy for deriving M˙acc, are directly calibrated from measurements of the
UV excess emission from the accretion shock(e.g., Muzerolle et al.1998; Alcalá et al.2014). Finally, we note that the M˙acc
values wefind for the quiescence of V1118 Ori are completely consistent with the accretion rates measured in most T Tauri objects(e.g., Natta et al.2006; Alcalá et al. 2008; Antoniucci et al.2011,2014; Biazzo et al.2012).
For comparison, we applied the emission line method to compute M˙acc for our 2006 data (note that at that time the
relationships for deriving M˙accfrom line fluxes were not
available yet). From three bright Pashen lines (Paβ, Paγ, and Paδ), we obtain M˙accvalue ∼1.0 ´10-7Myr−1, namely,
around 2 orders of magnitude higher than the quiscence value. Notably, this value is not only lower than the outburst value of Audard et al. (2010) of 1.0 ´10-6
M yr−1, but even lower than their quiescence value of 2.5 ´10-7
M yr−1. While the difference between the two outburst values could be ascribed to the different outburst phases sampled in Lorenzetti et al.(2006) and in Audard et al. (2010), the inconsistency between our outburst value and the quiescence value of Audard et al.(2010) can only be a result of the different computation methods. Finally, we note that our outburst determination of M˙acc/M˙lossis
within the range (roughly 2–20) predicted by jet launching models (Königl et al. 2000; Shu et al. 2000; Ferreira et al. 2006), if we take the value ofM˙loss= 4.0 ´10-8M
yr−1obtained from the HI recombination lines.
Emission lines—as listed in Table 2, the optical-IR quiescence spectrum of V1118 Ori is dominated by HI and
HeIrecombination lines. Very few faint metallic lines are also
present. Such a situation is the same reported by Herbig (2008), who observed the source twice, one in outburst and one in a fading phase. While in the former phase he noticed the prominence of HI, HeI, CaII, FeI, FeII, and other neutral and
ionized metals, when the star was much fainter the spectrum had changed radically: only HI and HeIemission lines
remained strong. Also, our near-IR spectrum, taken during the last outburst(Lorenzetti et al.2006), showed metallic (e.g., NaI) and CO emission features, now completely absent even if
observed at higher sensitivity. In particular, CO emission is usually associated with large amounts of warm gas (T ∼ 3000 K) in the inner regions of the circumstellar disk, which is indicative of an active phase of accretion(Najita et al. 1996; Lorenzetti et al. 2009; Kóspál et al. 2011). During a Figure 3. Near-IR spectrum of V1118 Ori, taken with TNG/NICS IJ (red) and HK (blue) grisms; spectral segments that were heavily corrupted by telluric absorptions were removed. The main emission features are indicated.
Figure 4. Near-IR two color plot ([J–H] vs. [H–K]) of the quiescence period of V1118 Ori. The data points are those given in Table1. A separation between the color of the quiescence phase(blue—the same as in Figure1) and that of
the moderate activity(red) phase is recognizable. Black solid circles indicate the median values of the two distributions(considering 1σ error). The solid line marks the unreddened main sequence, whereas the dashed line is the locus of the T Tauri stars (Meyer et al. 1997). Black dotted line represents the
reddening law by Cardelli et al. (1989), where different values of AV are
similar quiescence phase, Herbig (2008) also observed TiO absorption bands and the LiI6707 absorption line. While TiO
bands are clearly observed in our spectrum, LiIis absent,
possibly because of a superposition of emission and absorption, both recurrent in different activity stages of V1118 Ori (Herbig 2008). However, we should have been able to detect
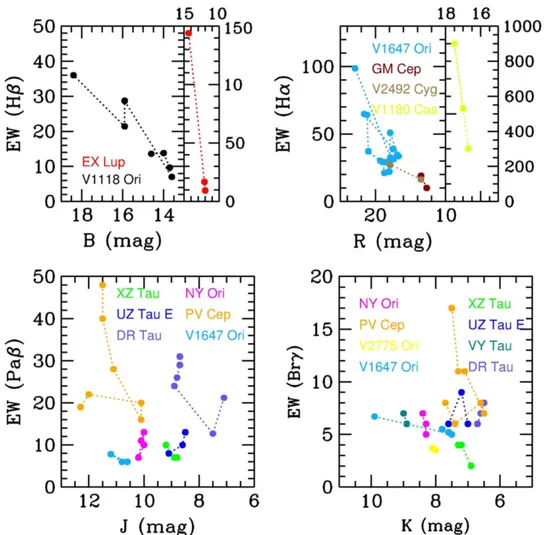
events are accretion or extinction driven, it is worthwhile analyzing the relationship between lines and continuum emission. In particular, we aim to compare the line emission behavior in phases characterized by different levels of activity, i.e., how the EW varies with increasing underlying continuum. First of all, we note that the only member of the EXor class analyzed in this respect (PVCep) shows a clear correlation (typical regression coefficient ⩾0.9) between line and con-tinuum flux (Lorenzetti et al. 2013). Since HI recombination
lines are considered to be good tracers of the accretion rate (e.g., Muzerolle et al.1998), the observed correlation supports the idea that accretion-driven mechanism is the most likely to account for continuum variations. Note that accretion or mass loss processes are both compatible with the observed behavior, since their ratio M˙acc/M˙lossis roughly in the range 2–20.
Although line and continuum fluxes are correlated, we can provide more quantitative information by directly comparing the line EW and the continuum itself.
Literature data concerning the EW variations of prominent emission lines and those of their underlying continua are taken starting from the list of EXors and candidates (Lorenzetti et al.2012their Table 1). In Tables3and4, we only report the data that refer to simultaneous observations of the HI
recombination lines Hβ and Hα and the continuum in the bands B and R, respectively. Provided that intra-day or day timescale variations are usually expected to be modest, in a few occasions the values of EW and continuum have been assigned to the same date(within a maximum distance of three to four days), even if they are not strictly simultaneous. In Figure6, we depict the results of our literature search. The same exercise was performed for the near-IR recombination lines Paβ and Brγ, and the relative photometry in the J and K bands, respectively. For the sake of compactness, near-IR data are not listed in a table, but are presented in Figure 6 and discussed below.
The anti-correlation, evident for V1118, also occurs for the majority of other sources when optical lines(Hβ and Hα) are considered, while for the near-IR lines(Paβ and Brγ) the anti-correlation is not as evident, being ascertainable only for about 50% of the presented cases. However, if we take into account only the most significant variations, namely, those with ΔEW ⩾ 100% orΔmag ⩾ 2, the total percentage (considering both optical and near-IR lines) of anti-correlations increases to about 80%. In conclusion, the existence of an anti-correlation can be reasonably confirmed as a general property of the EXor class of objects: a result already supported by previous investigations on individual objects (e.g., Cohen et al. 1981; Magakian & Movsesian2001; Acosta-Pulido et al.2007).
The anti-correlation indicates that the continuum presents larger (likely faster) variations than those of the lines, which means that the continuum and lines do not obey a common mechanism of heating and cooling. Such a circumstance tends
H11 0.377 3.2± 0.4 L H10 0.380 5.0± 0.4 5.0E-10 H9 0.384 8.4± 0.5 6.6E-10 H8 0.389 12.4± 0.5 7.1E-10 CaIIK 0.393 4.5± 0.2 2.1E-10 H7 + CaIIH 0.397 23.9± 0.5 L HeI 0.403 1.7± 0.3 1.0E-09 Hδ 0.410 28.4± 0.4 1.2E-09 Hγ 0.434 41.7± 0.4 1.3E-09 HeI 0.447 4.4± 0.2 1.5E-09 TiII 0.457 1.4± 0.3 L HeII 0.469 2.1± 0.3 L HeI 0.471 0.9± 0.2 1.8E-09 Hβ 0.486 66.6± 0.4 9.3E-10 HeI 0.501 1.7± 0.2 9.1E-10 ? 0.502 1.0± 0.2 L ? 0.517 1.8± 0.4 L MgI 0.518 0.8± 0.2 L HeI 0.588 9.5± 0.4 1.1E-09 [OI]a 0.630 3.2± 0.4 L Hα 0.656 567.2± 0.5 1.0E-09 HeI 0.668 8.8± 0.8 2.4E-09 [II]a 0.671 3.1± 0.8 L [II]a 0.673 3.4± 0.7 L HeI 0.707 6.7± 2.3 2.3E-09 HeI 0.837 7.2± 1.2 L OI 0.845 15.7± 2.7 9.9E-10 CaII 0.850 22.5± 1.0 6.0E-10 CaII 0.854 24.6± 0.7 6.0E-10 CaII 0.866 20.7± 0.8 5.9E-10 HeI 0.873 4.8± 1.4 L Pa12 0.875 12.0± 2.2 L HeI 0.886 8.1± 1.1 L Pa9 0.923 24.0± 8.5 1.4E-09 TNG/DOLORES HeI 0.588 12.7± 1.5 1.5E-09 Hα 0.656 656.8± 1.9 1.2E-09 HeI 0.668 8.2± 1.5 2.2E-09 TNG/NICS Pa11 0.882 53.0± 11.0 L Pa9 0.923 62.5± 10.0 L Paδ 1.004 85.1± 8.2 2.9E-09 HeI 1.082 68.5± 6.3 8.3E-10 Paγ 1.092 105.7± 10.0 2.5E-09 Paβ 1.281 262.3± 21.4 4.3E-09
to rule out variable extinction as the cause of the observed variability, since in that case a constant value of the EW should be expected for any continuum fluctuation. Even a selective obscuration can be ruled out: dust should be located at the dust condensation zone, very close to the star, and, as such, it should obscure the stellar photosphere more than the accretion columns and the wind regions.
4. CONCLUDING REMARKS
We have presented the results of a monitoring of the EXor system V1118 Ori. Data concerning both IR photometry and optical/near-IR spectroscopy cover a long period lasting eight years (2006–2014). This period starts from the last outburst and is the longest state of quiescence ever monitored. Hence, it is very suitable for deriving reliable parameters typical of this status that can be used as a reference to evaluate physical changes occurring during more active phases.
1. Near-IR colors of the V1118 Ori cluster in a locus typical of a late-type T Tauri star embedded in a low-extinction (AV 1–2 mag) environment. A trend of the colors to
become bluer when the source flux increases can be recognized even in the presence of modest (0.4 mag) variations.
2. From modelfitting, stellar parameters (T= 3900 K; M
= 0.7M☉) well compatible with the known physical
parameters of V1118 Ori are derived and the value of 2.0
☉
L for the bolometric luminosity in quiescence is confirmed.
3. Optical/near-IR spectra are dominated by both HI
recombination lines and HeIpermitted transitions. TiO
absorption bands are also identified without any sign of forbidden transitions, indicating that (at least in the current quiescence state) there is no significant outflow activity from the source.
4. Emission linefluxes are consistently exploited to derive a mass accretion rate (M˙) of 1–3 × 10⁻⁹ M yr☉ −1
Figure 5. Mass accretion rate determinations computed from the flux of the indicated tracers using Alcalá et al. (2014) relationships assuming visual extinction of
AV= 1 (blue circles) and AV= 2 (red squares). The median M˙accvalues are marked for both cases with a solid line. Table 3
EW of the Hβ Emission Line vs. B-band Underlying Continuum Measured in Different Epochs
Source Date JD EW B Ref.
(yy/mm/dd) +2400000 (Å) (mag) V1118 Ori 1989 Jan 07 47533.5 −13.6 14.6 1 1989 Jan 11 47537.5 −13.8 14.0 1 1989 Feb 01 47558.5 −9.7 13.7 1 1989 Dec 19 47879.5 −7.0 13.6 1 1992 Dec 02 48958.5 −28.7 15.6–16.2 2 1993 Feb 22 49040.5 −21.4 15.6–16.2 2 2014 Mar 25 48958.5 −36.0 18.4 3 EX Lup 1993 Apr L −24.0 13.2 4 1994 Mar 03 49414.5 −9.4 12.0 4 2007 Jul L −144 14.4 5
Note.Errors on EW and magnitude are typically ∼0.2 Å and 0.1 mag, respectively. References for Tables2and3are as follow:(1) Parsamian et al. (1996), (2) Parsamian et al. (2002), (3) this paper, (4) Herbig et al. (2001and references therein): (5) Sipos et al. (2009), (6) Kun et al. (2011), (7) Aspin &
Reipurth (2009), (8) Ojha et al. (2006), (9) Aspin et al. (2009), (10)
Aspin(2011b), (11) Aspin (2011a), (12) Sicilia-Aguilar et al. (2008).
Table 4
EW of the Hα Emission Line vs. R-band Underlying Continuum Measured in Different Epochs
Source Date JD Hα EW B Ref.
(yy/mm/dd) +2400000 (Å) (mag) V1180 Cas 2003 Feb 05 52675.5 −300 16.7a 6 2008 Aug 28 54706.5 −900 17.5a 6 2010 Dec 31 55561.5 −530 17.0a 6 V1647 Ori 2004 Feb 14 53049.5 −31.4 17.4b 7 2004 Feb 22 53057.5 −34.6 16.9 8 2004 Feb 23 53058.5 −33.6 16.7 8 2004 Mar 10 53074.5 −50.9 17.9b 7 2004 Oct 06 53284.5 −29.5 18.0b 7 2004 Nov 16 53325.5 −22.1 18.0b 7 2004 Dec 12 53351.5 −29.2 18.4b 7 2005 Jan 08 53378.5 −27.1 17.9b 7 2005 Aug 30 53612.5 −21.2 18.7b 7 2005 Sep 25 53638.5 −29.2 18.9b 7 2005 Oct 13 53656.5 −30.2 19.3b 7 2005 Nov 18 53692.5 −37.2 21.0b 7 2005 Nov 27 53701.5 −64.2 21.2b 7 2005 Dec 25 53729.5 −64.9 21.6b 7 2006 Jan 05 53740.5 −66.6 21.9b 7 2006 Feb 16 53782.5 −98.7 22.9b 7 2008 Aug 31 54694.5 −39 17.5b 9 2011 Feb 02 55594.5 −32.6 17.8b 10 V2492 Cyg 2010 Sep 25 55464.5 −16.3 13.5 11 2010 Nov 05 55505.5 −27.6 18.0 11 GM Cep 2001 Jul 11 52101.5 −10 12.7 12 2007 Apr 27 54217.5 −19 13.5 12
Note.Notes and references are the same as in Table3. a
Values of Icmagnitude estimated from a light-curve plot.
b
compatible with typical values observed in T Tauri stars. This value is substantially different from that previously derived using a different method. This discrepancy is likely related to the different methods employed for the computation of the accretion rate. Accretion estimates from the emission lines are to be regarded as more reliable, since the lines are believed to trace the accretion columns or the strong accretion-related winds from the object.
5. An(anti-)correlation exists between the equivalent width of the emission lines and the underlying continuum. A search in the literature confirms that the behavior of V1118 Ori is a common feature of the whole class and supports the accretion-driven mechanism as the most likely to account for continuum variations.
In Table 5, we summarize the results presented above: this table can be a useful reference for delineating the V1118 Ori properties at quiescence.
Based on observations made with different instruments:[1] the Italian Telescope Galileo(TNG) operated on the island of La Palma by the Fundación Galileo Galilei of the INAF (Istituto Nazionale di Astrofisica) at the Spanish Observatorio del Roque de los Muchachos of the Istituto de Astrofisica de Canarias;[2] the Large Binocular Telescope (LBT). The LBT is an international collaboration among institutions in the United States, Italy, and Germany. LBT Corporation partners are the University of Arizona on behalf of the Arizona university system; Istituto Nazionale di Astrofisica, Italy; LBT Beteiligungsgesellschaft, Germany, representing the Max-Planck Society, the Astrophysical Institute Potsdam, and Heidelberg University; The Ohio State University, and The Research Corporation, on behalf of The University of Notre Dame, University of Minnesota, and University of Virginia.[3] Figure 6. EW of optical (upper panels) and IR (lower panels) HIrecombination lines as a function of the underlying continuum expressed in magnitudes. To avoid possible confusion, the EW values are labeled(in the y axis) with a positive sign, although they are conventionally negative for emission lines, as reported in Tables3
and4.
Table 5
Quiescence Parameters of V1118 Ori
Parameter Value
Distance d 400 pc
Spectral Type SpT M1e
Stellar radius R* 1.29R☉
Stellar mass M* 0.41M☉
Bolometric luminosity Lbol 2.1L☉
Visual extinction AV 1–2 mag
Mass accretion rate M˙ 1–3 10−9M yr☉ −1
Note.The first four lines of the table list literature parameters, while the rest are derived in the present work.
The AZT-24 IR Telescope at Campo Imperatore (L’Aquila— Italy) operated under the responsibility of the INAF-Osserva-torio Astronomico di Roma (OAR).
REFERENCES
Acosta-Pulido, J. A., Kun, M., Ábrahám, P., et al. 2007,AJ,133, 2020
Alcalá, J. M., Natta, A., Manara, C. F., et al. 2014,A&A,561, 2
Alcalá, J. M., Spezzi, L., Chapman, N., et al. 2008,ApJ,676, 427
Antoniucci, S., Arkharov, A. A., Di Paola, A., et al. 2014, Protostars and Planets VI, ed. H. Beuther et al.(Tucson, AZ: Univ. Arizona Press), Poster #28055
Antoniucci, S., García López, R., Nisini, B., et al. 2011,A&A,534, 32
Antoniucci, S., García Lopez, R., Nisini, B., et al. 2014, arXiv:1410.0181
Antoniucci, S., Nisini, B., Giannini, T., & Lorenzetti, D. 2008,A&A,479, 503
Aspin, C. 2011a,AJ,141, 196
Aspin, C. 2011b,AJ,142, 135
Aspin, C., Reipurth, B., Beck, T. L., et al. 2009, ApJL,692, L67
Aspin, C., & Reipurth, B. 2009,AJ,138, 1137
Audard, M., Ábrahám, P., Dunham, M., et al. 2014, in Protostars and Planets VI , ed. H. Beuther, R. Klessen, C. Dullemond, & T. Henning (Univ. Arizona Press), 387
Audard, M., Güdel, M., Skinner, S. L., et al. 2005,ApJL,635, L81
Audard, M., Stringfellow, G. S., Güdel, M., et al. 2010,A&A,511, 63
Biazzo, K., Alcalá, J. M., Covino, E., Frasca, A., Getman, F., & Spezzi, L. 2012, A&A,547, 104
Calvet, N., Hartmann, L., & Strom, S. E. 2000, in Protostars and Planets IV, ed. V. Mannings, A. P. Boss, & S. S. Russell (Tucson, AZ: Univ. Arizona Press), 377
Calvet, N., Muzerolle, J., Briceno, C., et al. 2004,AJ,128, 1294
Cardelli, J. A., Clayton, G. C., & Mathis, J. S. 1989,ApJ,345, 245
Cohen, M., Kuhi, L. V., Harlan, E. A., & Spinrad, H. 1981,ApJ,245, 920
D’Alessio, F., Di Cianno, A., Di Paola, A., et al. 2000, in Proc. SPIE 4008,748
Davis, C. J., Gell, R., Khanzadyan, T., Smith, M. D., & Jenness, T. 2010, A&A,511, 24
Edwards, S., Fischer, W., Hillenbrand, L., & Kwan, J. 2006,ApJ,646, 319
Ferreira, J., Dougados, C., & Cabrit, S. 2006,A&A,453, 785
García, J., & Parsamian, E. S. 2000, IBVS,4925
Giannini, T., Calzoletti, L., Nisini, B., et al. 2008,A&A,481, 123
Gullbring, E., Hartmann, L., Bric̃eno, C., & Calvet, N. 1998,ApJ,492, 323
Hartmann, L., & Kenyon, S. 1985,ApJ,299, 462
Herbig, G. H. 1989, in Proc. ESO Workshop, Low Mass Star Formation and Pre-main Sequence Objects, ed. B. Reipurth(Garching: ESO),233
Herbig, G. H. 2008,AJ,135, 637
Herbig, G. H., Aspin, C., Gilmore, A. C., Imhoff, C. L., & Jones, A. F. 2001, PASP,113, 1547
Hillenbrand, L. A. 1997,AJ,113, 1733
Königl, A., & Pudritz, R. E. 2000, in Protostars and Planets IV, ed. V. Mannings, A. P. Boss, & S. S. Russell(Tucson, AZ: Univ. Arizona Press),759
Kóspál, Á., Ábrahám, P., Acosta-Pulido, J. A., et al. 2011,A&A,527, A133
Kun, M., Szegedi-Elek, E., Moór, A., et al. 2011,ApJL,733, L8
Lorenzetti, D., Antoniucci, S., Giannini, T., et al. 2012,ApJ,749, 188
Lorenzetti, D., Antoniucci, S., Giannini, T., et al. 2013,Ap&SS,343, 535
Lorenzetti, D., Giannini, T., Calzoletti, L., et al. 2006,A&A,453, 579
Lorenzetti, D., Giannini, T., Larionov, V. M., et al. 2007,ApJ,665, 1193
Lorenzetti, D., Larionov, V. M., Giannini, T., et al. 2009,ApJ,693, 1056
Magakian, T., & Movsesian, T. A. 2001,Ap,44, 419
Meyer, M. R., Calvet, N., & Hillenbrand, L. A. 1997,AJ,114, 288
Muzerolle, J., Hartmann, L., & Calvet, N. 1998,AJ,116, 2965
Najita, J., Carr, J. S., Glassgold, A. E., Shu, F. H., & Tokunaga, A. T. 1996, ApJ,462, 919
Natta, A., Testi, L., & Randich, S. 2006,A&A,452, 245
Ojha, D. K., Ghosh, S. K., Tej, A., et al. 2006,MNRAS,368, 825
Parsamian, E. S., Gasparian, K. G., Oganian, G. B., & Melkonian, A. S. 1996, Ap,39, 201
Parsamian, E. S., Ibragimov, M. A., Oganian, G. B., & Gasparian, K. G. 1993, Ap,36, 23
Parsamian, E. S., Mujica, R., & Corral, L. 2002,Ap,45, 393
Pogge, R. W., Atwood, B., Brewer, D. F., et al. 2010,Proc. SPIE,7735, 9
Reipurth, B., Guimarães, M. M., Connelley, M. S., & Bally, J. 2007,AJ,
134, 2272
Robitaille, T. P., Withney, B., Indebetouw, R., Wood, K., & Denzmore, P. 2006,ApJS,167, 256
Robitaille, T. P., Withney, B., Indebetouw, R., & Wood, K. 2007, ApJS,
169, 328
Shu, F. H., Najita, J. R., Ostriker, E., et al. 1994,ApJ,429, 781
Shu, F. H., Najita, J. R., Shang, -H., & Li, Z.-Y. 2000, in Protostars and Planets IV, ed. V. Mannings, A. P. Boss, & S. S. Russell(Univ. Arizona Press), 789 Sicilia-Aguilar, A., Kóspál, Á., Setiawan, J. A., et al. 2012,A&A,544, 93
Sicilia-Aguilar, A., Merín, B., Hormuth, F., et al. 2008,ApJ,673, 382
Sipos, N., Ábrahám, P., Acosta-Pulido, J., et al. 2009,A&A,507, 881

![Figure 4. Near-IR two color plot ([J–H] vs. [H–K]) of the quiescence period of V1118 Ori](https://thumb-eu.123doks.com/thumbv2/123dokorg/8090348.124643/5.918.72.436.326.607/figure-near-ir-color-plot-quiescence-period-ori.webp)