Università Politecnica delle Marche
Scuola di Dottorato di Ricerca in Scienze dell’Ingegneria Corso di Dottorato in Ingegneria Industriale
---
Auralization of noise sources to support
interior car sound design
Ph.D. Dissertation of:
Mateusz Matuszewski
Supervisor:
Prof. Paolo Castellini Assistant Supervisor:
Dr Paolo Chiariotti Dr Karl Janssens
Ph.D. Course coordinator: Prof. F. Mandorli
Università Politecnica delle Marche
Dipartimento di (nome del dipartimento dove la tesi e’ stata sviluppata) Via Brecce Bianche — 60131 - Ancona, Italy
ii
Acknowledgements
This thesis would not have possible without the help and contributions of a number of people. I would like to express my gratitude to all people involved in the creation of the EID project ENHANCED in which I had a pleasure to participate: my supervisor Prof. Paolo Castellini, university assistant supervisors Prof. Milena Martarelli and Dr Paolo Chiariotti and my industry assistant supervisor Dr Karl Janssens. I sincerely believe that all of you had the greatest impact on my career and personal development. The ENHANCED project gave a unique opportunity to learn new technical skills, broaden my horizons, meet great people and last but not least, to write this thesis. Thank you very much for this fruitful time spent together.
My additional sincere thanks also goes to Dr Paolo Chiariotti for his constant encouragement and energetic motivation. On a daily basis, I was fortunate to count on his help in every matter. He gave me a wonderful support by teaching me new technical skills and by reviewing and criticising my work. His priceless help was crucial for this thesis.
I would also thank to reviewers Prof. Toon van Waterschoot from KU Leuven and Prof. Etienne Parizet from INSA Lyon for their insightful comments on this thesis.
At the end, I would like to thank my colleagues from UNIVPM and Siemens PLM, especially to Claudio Colangeli and Giampiero Accardo for all the good times shared in these last three years.
iv
1
Abstract
Current trend in the automotive industry is to replace “traditional” internal combustion engines into electrical units. As a result, cars are becoming quieter, which brings sound sources originally masked by combustion engines to the top. One of the most industrially important “new” sources is wind noise. Performing investigation on sounds, especially on those which cannot be measured separately, require sophisticate methods, like auralization. This thesis is mainly focused on the development of a new time-saving auralization method, tailored for car interior applications, which preserve sufficient fidelity in terms of wind noise reproduction. The proposed method aims to make it possible to auralize wind noise without any prior knowledge of the geometry of the car under investigation. This goal is achieved by using a statistical model of key Room Impulse Response (RIR) parameters and early reflections. Quality of sound auralization highly depends on Head-Related Transfer Functions (HRTFs) used. A new approach for measuring and processing HRTFs targeted at auralizing sound in car cabins is proposed. The remaining question is to understand how many reflections are effectively needed for providing a realistic listening experience. Therefore Investigations on Room Impulse Response modifications are included in the thesis. Also a human-oriented approach to define the minimum accuracy required for source localization techniques when used in car interiors is presented. By exploiting sound source localization and separation it becomes possible to virtually relocate sources and to perform what-if analyses. The proposed approach for in-vehicle auralization can be a substantial economic benefit for car manufactures considering the high costs of wind tunnel tests.
Contents
1. Car cabin acoustics ... 4
1.1 Room Impulse Response ... 4
1.2 Methods for IR calculation ... 5
1.2.1. Ray tracing method ... 5
1.2.2. Statistical methods ... 6
1.3. RIR parametrization ... 8
1.3.1. Reverberation Time ... 8
1.3.2. Early Decay Time ... 9
1.3.3. Direct-to-Reverberant Energy Ratio ... 9
1.3.4. Early to Late Reverberation Ratio ... 10
1.4. Car wind noise ... 10
2. Head Related Transfer Functions for in-vehicle auralization ... 13
2.1. General overview of the HRTF database ... 13
2.2. Measurements and results ... 14
2.3. Conclusions ... 22
3. Auditory perception of early reflections in car cabins ... 23
3.1.Early reflections problem in car-cabins ... 23
3.2.Experiment investigation ... 24
3.2.1. Results and discussion ... 27
3.2.2. Threshold for inclusion of a reflection ... 27
3.2.3. Threshold for an individual reflection with a full impulse response ... 31
3.3. Conclusion ... 33
4. Sound source localization accuracy in car-cabins: a human perception perspective ... 34
4.1. MAA overview ... 34
4.2. MAA for one source in car cabins ... 36
4.2.1. Stimulus generation ... 36
4.2.2.Experiment investigation ... 37
4.2.3. Results and discussion ... 38
4.3. MAA for multiple sources ... 40
4.3.1.Experimental investigation ... 43
iii
4.4. Conclusions ... 51
5. In-vehicle auralization based on statistical methods ... 52
5.1. Overview on RIR modelling ... 52
5.2. New statistical model ... 53
5.3. Parameters estimation ... 59
5.3.1. Measured RIRs ... 59
5.3.2. Simulated RIRs ... 61
5.3.3. RIR clustering ... 62
5.4. Measurement and simulation results ... 64
5.5. Validation of the model... 71
5.5.1. Listening experiment ... 87
5.6. Conclusions ... 90
iv
List of Figures
FIG.0-1 BLOCK DIAGRAM PRESENTING THE OUTLINE OF THE THESIS.BLOCKS INSIDE THE DASHED BLOCK INDICATE INVESTIGATED AREAS. ... 2 FIG.1-1 AN ILLUSTRATION OF A RIR DIVISION INTO THREE PARTS: DIRECT PATH, EARLY REFLECTIONS AND LATE REVERBERATION ... 4 FIG.1-2 CROSS SECTION OF A CAR ILLUSTRATING SOURCE PROPAGATION INSIDE A CAR CABIN CALCULATED USING RT METHOD.GREEN LINES INDICATE SOUND PATHS FROM A SOURCE (S) TO A RECEIVER (R). ... 6 FIG.1-3 ILLUSTRATION OF HOW REVERBERATION TIME AND EARLY DECAY TIME ARE CALCULATED FROM AN ENERGY DECAY CURVE. ... 9 FIG.1-4 SCHEMATIC PRESENTATION OF A WIND NOISE SOURCE BEAMFORMING MAP ... 12 FIG.2-1 MODIFIED HATS USED FOR MEASUREMENT ... 15 FIG.2-2 MODIFIED HATS USED FOR MEASUREMENT WITH LOWER ARMS INCLINATION ... 15 FIG.2-3 HRIR WITH AND WITHOUT ARMS FOR 60⁰ AZIMUTH,0⁰ ELEVATION AND 70 CM DISTANCE. ... 16 FIG.2-4 HRTF WITH AND WITHOUT ARMS FOR 60⁰ AZIMUTH,0⁰ ELEVATION AND 70 CM DISTANCE. ... 16 FIG.2-5 DISTANCE DEPENDENCY OF HRTFS FOR AZIMUTHS ANGLES:60˚(LEFT) AND 0˚ (RIGHT) ... 17 FIG.2-6 DISTANCE DEPENDENCY OF HRTFS FOR AZIMUTHS ANGLES:60˚(LEFT) AND 0˚ (RIGHT) ... 17 FIG.2-7 ARMS INFLUENCE ON HRTFS AT THE DISTANCE OF 70 CM (LEFT AND RIGHT EAR) ... 18 FIG.2-8 ARMS INFLUENCE ON HRTFS AT THE DISTANCE OF 120 CM (LEFT AND RIGHT EAR) ... 18 FIG.2-9 HRTFS FOR DIFFERENT AZIMUTH FOR 0⁰ ELEVATION AT 120 CM DISTANCE WITHOUT ARMS (TOP) AND WITH ARMS (BOTTOM) ... 19 FIG.2-10 HRTFS FOR DIFFERENT AZIMUTH FOR 0⁰ ELEVATION AT 70 CM DISTANCE WITHOUT ARMS (TOP) AND WITH ARMS (BOTTOM) ... 20 FIG.2-11 HRTFS FOR DIFFERENT AZIMUTH FOR 0⁰ ELEVATION AT 40 CM DISTANCE WITHOUT ARMS (TOP) AND WITH ARMS (BOTTOM) ... 21 FIG.3-1 SPECTRUM OF WIND NOISE SIGNAL USED IN AURALIZATION. ... 25 FIG.3-2 THE MODEL OF A CAR USED IN RAY TRACING SIMULATIONS (LEFT) AND FIRST 20MS OF THE CORRESPONDING IMPULSE RESPONSE (RIGHT). ... 26 FIG.3-3 SPECTRUM OF THE LEFT MIRROR WIND NOISE WITH ALL REFLECTIONS (LEFT) AND SOUND WITHOUT FIRST FIVE REFLECTIONS (RIGHT) ... 30 FIG.3-4 THRESHOLDS FOR SINGLE REFLECTION WITH A FULL IMPULSE RESPONSE ... 32
v
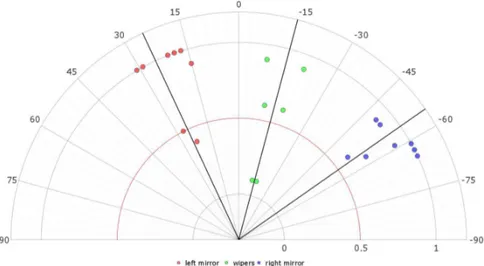
FIG.3-5 THRESHOLDS FOR SINGLE REFLECTION WITH A FULL IMPULSE RESPONSE AND ALL WIND NOISE SOURCES PRESENT ... 32 FIG.4-1: A CAR MOCK-UP MODEL USED FOR GENERATING IMPULSE RESPONSES WITH MARKED SOURCES IN THE MEDIAN PLANE... 36 FIG.4-2: A CLOSE-UP OF A CAR MOCK-UP MODEL USED FOR GENERATING IMPULSE RESPONSES WITH MARKED SOURCES IN THE HORIZONTAL PLANE. ... 37 FIG.4-3: MAA FOR THE HORIZONTAL DIRECTION (RIGHT) AND FOR THE VERTICAL DIRECTION (LEFT).FOR MAA ON THE MEDIAN PLANE (LEFT) RESULTS ARE MARKED WITH BLACK LINE AND WITH GREY LINE FOR 4° AZIMUTH. ... 38 FIG.4-4: RESULTS OF MAA FOR THE HORIZONTAL PLANE, MEDIAN PLANE AND VERTICAL PLANE AT 4° FOR EACH LISTENER. ... 40 FIG.4-5 MEASUREMENT POINTS ON THE LEFT AND RIGHT WINDOWS AND THE WINDSHIELD. ... 41 FIG.4-6 KEMARHATS USED FOR IRS ACQUISITION (LEFT) AND COMPACT LMSQSOURCE AT THE LEFT WINDOW (RIGHT). ... 42 FIG.4-7 LOUDSPEAKERS POSITION FOR THE LISTENING EXPERIMENT. ... 44 FIG.4-8 LISTENING EXPERIMENT RESULTS FOR AZIMUTH FOR LEFT MIRROR, WIPER AND RIGHT MIRROR AT 0° ELEVATION. ... 46 FIG.4-9 LISTENING EXPERIMENT RESULTS FOR ELEVATION FOR LEFT MIRROR, WIPER AND RIGHT MIRROR AT DIFFERENT AZIMUTH ANGLES. ... 46 FIG.4-10 MAA FOR THE LEFT MIRROR FOR THE HORIZONTAL DIRECTION (RIGHT) AND FOR THE VERTICAL DIRECTION (LEFT). FOR MAA ON THE MEDIAN PLANE (LEFT)
RESULTS ARE MARKED WITH BLACK LINE AND WITH A GREY LINE FOR THE VERTICAL PLANE FOR 6° AZIMUTH AND -8° AZIMUTH. ... 47 FIG.4-11 MAA FOR THE RIGHT MIRROR FOR HORIZONTAL DIRECTION (RIGHT) AND FOR THE VERTICAL DIRECTION (LEFT).FOR MAA ON THE MEDIAN PLANE (LEFT) RESULTS ARE MARKED WITH BLACK LINE AND WITH A GREY LINE FOR THE VERTICAL PLANE FOR 6° AZIMUTH AND -8° AZIMUTH. ... 48 FIG.4-12 MAA FOR THE WIPERS FOR THE HORIZONTAL DIRECTION (RIGHT) AND FOR THE VERTICAL DIRECTION (LEFT).FOR MAA ON THE MEDIAN PLANE (LEFT) RESULTS ARE MARKED WITH BLACK LINE.WITH A GREY LINE ARE MARKED RESULTS WITH LEFT AND RIGHT MIRRORS ACTING AT THE SAME TIME. ... 48 FIG.4-13 LISTENING EXPERIMENT RESULTS FOR AZIMUTH FOR LEFT MIRROR, WIPER AND RIGHT MIRROR WITH OTHER SOURCES ACTING AT THE SAME TIME. ... 49 FIG.4-14 LISTENING EXPERIMENT RESULTS FOR ELEVATION FOR LEFT MIRROR, WIPER AND RIGHT MIRROR WITH OTHER SOURCES ACTING AT THE SAME TIME. ... 49 FIG.4-15 MAA FOR THE LEFT MIRROR FOR THE HORIZONTAL DIRECTION (RIGHT) AND FOR THE VERTICAL DIRECTION (LEFT). FOR MAA ON THE MEDIAN PLANE (LEFT)
vi
RESULTS ARE MARKED WITH BLACK LINE.WITH A GREY LINE ARE MARKED RESULTS
WITH OTHER SOURCES ACTING AT THE SAME TIME. ... 50
FIG.4-16 MAA FOR THE RIGHT MIRROR FOR THE HORIZONTAL DIRECTION (RIGHT) AND FOR THE VERTICAL DIRECTION (LEFT). FOR MAA ON THE MEDIAN PLANE (LEFT) RESULTS ARE MARKED WITH BLACK LINE.WITH A GREY LINE ARE MARKED RESULTS WITH OTHER SOURCES ACTING AT THE SAME TIME. ... 50
FIG.5-1 BLOCK DIAGRAM OF THE PROCESSING REQUIRED FOR THE AURALIZATION BASED ON THE PROPOSED METHOD ... 54
FIG.5-2 MEASUREMENT SET-UP FOR BRIR ACQUISITION FROM SOURCES LOCATED ON A WINDSHIELD. ... 60
FIG.5-3 MINIATURE VOLUME ACCELERATION SOURCE POSITION OF A LEFT DOOR WINDOW ... 61
FIG.5-4 AN EXAMPLE OF SOURCES DISTRIBUTION IN A CAR (YELLOW POINTS) ... 62
FIG.5-5 ILLUSTRATION OF NECESSARY STEPS FOR GEOMETRY CLUSTERING ... 63
FIG.5-6 AN EXAMPLE OF CLUSTERING MEASUREMENT POINTS ON A WINDSHIELD INTO 12 CLUSTERS.GREY NUMBERS INDICATE CLUSTER NUMBERS AND COLOUR OF POINTS INDICATE CLUSTER ASSIGNMENT. ... 64
FIG.5-7 AN EXAMPLE OF CLUSTERING MEASUREMENT POINTS ON A LEFT AND RIGHT DOOR WINDOW INTO 2 CLUSTERS.GREY NUMBERS INDICATE CLUSTER NUMBERS AND COLOUR OF POINTS INDICATE CLUSTER ASSIGNMENT. ... 64
FIG.5-8 CORRELATION BETWEEN RT60 AND EDT(LEFT) AND DRR AND ETL(RIGHT) FOR ALL CARS ... 65
FIG.5-9 ETL FOR LEFT AND RIGHT EAR FOR A SINGLE CAR ... 65
FIG.5-10 DRR FOR LEFT AND RIGHT EAR FOR A SINGLE CAR ... 66
FIG.5-11 EDT FOR LEFT AND RIGHT EAR FOR A SINGLE CAR ... 66
FIG.5-12 RT60 FOR LEFT AND RIGHT EAR FOR A SINGLE CAR ... 67
FIG.5-13 BOX PLOT FOR ETL FOR LEFT EAR (LEFT) AND RIGHT EAR (RIGHT). ... 68
FIG.5-14 BOX PLOT FOR DRR FOR LEFT EAR (LEFT) AND RIGHT EAR (RIGHT). ... 68
FIG.5-15 BOX PLOT FOR RT60 FOR LEFT EAR (LEFT) AND RIGHT EAR (RIGHT). ... 69
FIG.5-16 BOX PLOT FOR EDT FOR LEFT EAR (LEFT) AND RIGHT EAR (RIGHT). ... 69
FIG.5-17 CORRELATION BETWEEN CLUSTER NO.3 AND CLUSTER NO.4 FOR DRR(LEFT AND RIGHT EAR) ... 70
FIG.5-18 CORRELATION BETWEEN CLUSTER NO.3 AND CLUSTER NO.13 FOR DRR(LEFT AND RIGHT EAR) ... 70
FIG.5-19 AN EXAMPLE OF WIND NOISE SOURCES DISTRIBUTION IN A CAR (WHITE POINTS) USED FOR THE STATISTICAL MODEL VALIDATION ... 71
FIG.5-20 RFTS CALCULATED BY THE MODEL WITH AVERAGED PARAMETERS, LEFT AND RIGHT EAR RESPECTIVELY, FOR THE LEFT MIRROR, CAR A. ... 72
vii
FIG.5-21 RFTS CALCULATED BY THE MODEL WITH “TUNED” PARAMETERS, LEFT AND RIGHT EAR RESPECTIVELY, FOR THE LEFT MIRROR, CAR A. ... 73 FIG.5-22 RFTS CALCULATED BY THE MODEL WITH AVERAGED PARAMETERS, LEFT AND RIGHT EAR RESPECTIVELY, FOR THE LEFT MIRROR, CAR B. ... 73 FIG.5-23 RFTS CALCULATED BY THE MODEL WITH “TUNED” PARAMETERS, LEFT AND RIGHT EAR RESPECTIVELY, FOR THE LEFT MIRROR, CAR B. ... 74 FIG.5-24 RFTS CALCULATED BY THE MODEL WITH AVERAGED PARAMETERS, LEFT AND RIGHT EAR RESPECTIVELY, FOR THE LEFT A-PILLAR (FIRST POINT), CAR A. ... 75 FIG.5-25 RFTS CALCULATED BY THE MODEL WITH “TUNED” PARAMETERS, LEFT AND RIGHT EAR RESPECTIVELY, FOR THE LEFT A-PILLAR (FIRST POINT), CAR A ... 75 FIG.5-26 RFTS CALCULATED BY THE MODEL WITH AVERAGED PARAMETERS, LEFT AND RIGHT EAR RESPECTIVELY, FOR THE LEFT A-PILLAR (FIRST POINT), CAR B. ... 76 FIG.5-27 RFTS CALCULATED BY THE MODEL WITH “TUNED” PARAMETERS, LEFT AND RIGHT EAR RESPECTIVELY, FOR THE LEFT A-PILLAR (FIRST POINT), CAR B. ... 76 FIG.5-28 RFTS CALCULATED BY THE MODEL WITH AVERAGED PARAMETERS, LEFT AND RIGHT EAR RESPECTIVELY, FOR THE LEFT A-PILLAR (SECOND POINT), CAR A. ... 77 FIG.5-29 RFTS CALCULATED BY THE MODEL WITH “TUNED” PARAMETERS, LEFT AND RIGHT EAR RESPECTIVELY, FOR THE LEFT A-PILLAR (SECOND POINT), CAR A. ... 77 FIG.5-30 RFTS CALCULATED BY THE MODEL WITH AVERAGED PARAMETERS, LEFT AND RIGHT EAR RESPECTIVELY, FOR THE LEFT A-PILLAR (SECOND POINT), CAR B. ... 78 FIG.5-31 RFTS CALCULATED BY THE MODEL WITH “TUNED” PARAMETERS, LEFT AND RIGHT EAR RESPECTIVELY, FOR THE LEFT A-PILLAR (SECOND POINT), CAR B. ... 78 FIG.5-32 RFTS CALCULATED BY THE MODEL WITH AVERAGED PARAMETERS, LEFT AND RIGHT EAR RESPECTIVELY, FOR WIPERS, CAR A. ... 79 FIG.5-33 RFTS CALCULATED BY THE MODEL WITH “TUNED” PARAMETERS, LEFT AND RIGHT EAR RESPECTIVELY, FOR WIPERS, CAR A. ... 80 FIG.5-34 RFTS CALCULATED BY THE MODEL WITH AVERAGED PARAMETERS, LEFT AND RIGHT EAR RESPECTIVELY, FOR WIPERS, CAR B. ... 80 FIG.5-35 RFTS CALCULATED BY THE MODEL WITH “TUNED” PARAMETERS, LEFT AND RIGHT EAR RESPECTIVELY, FOR WIPERS, CAR B. ... 81 FIG.5-36 RFTS CALCULATED BY THE MODEL WITH AVERAGED PARAMETERS, LEFT AND RIGHT EAR ... 81 FIG.5-37 RFTS CALCULATED BY THE MODEL WITH “TUNED” PARAMETERS, LEFT AND RIGHT EAR RESPECTIVELY, FOR THE RIGHT A-PILLAR (FIRST POINT), CAR A. ... 82 FIG.5-38 RFTS CALCULATED BY THE MODEL WITH AVERAGED PARAMETERS, LEFT AND RIGHT EAR ... 82 FIG.5-39 RFTS CALCULATED BY THE MODEL WITH “TUNED” PARAMETERS, LEFT AND RIGHT EAR RESPECTIVELY, FOR THE RIGHT A-PILLAR (FIRST POINT), CAR B. ... 83
viii
FIG.5-40 RFTS CALCULATED BY THE MODEL WITH AVERAGED PARAMETERS, LEFT AND RIGHT EAR ... 83 FIG.5-41 RFTS CALCULATED BY THE MODEL WITH “TUNED” PARAMETERS, LEFT AND RIGHT EAR RESPECTIVELY, FOR THE RIGHT A-PILLAR (SECOND POINT), CAR A. ... 84 FIG.5-42 RFTS CALCULATED BY THE MODEL WITH AVERAGED PARAMETERS, LEFT AND RIGHT EAR ... 84 FIG.5-43 RFTS CALCULATED BY THE MODEL WITH “TUNED”PARAMETERS, LEFT AND RIGHT EAR ... 85 FIG.5-44 RFTS CALCULATED BY THE MODEL WITH AVERAGED PARAMETERS, LEFT AND RIGHT EAR ... 85 FIG.5-45 RFTS CALCULATED BY THE MODEL WITH “TUNED”PARAMETERS, LEFT AND RIGHT EAR ... 86 FIG.5-46 RFTS CALCULATED BY THE MODEL WITH AVERAGED PARAMETERS, LEFT AND RIGHT EAR ... 86 FIG.5-47 RFTS CALCULATED BY THE MODEL WITH “TUNED”PARAMETERS, LEFT AND RIGHT EAR ... 87 FIG.5-48 LISTENING EXPERIMENT RESULTS ... 89
List of Tables
TABLE 2-1 HRTF MEASUREMENT SCENARIOS ... 15 TABLE 3-1 LIST OF SOUND SAMPLES USED IN THE EXPERIMENT WITH NUMBERS OF REMOVED REFLECTIONS AND CORRESPONDING RESULTS ... 28 TABLE 3-2 LIST OF SOUND SAMPLES USED IN THE EXPERIMENT WITH NUMBERS OF REMOVED REFLECTIONS AND CORRESPONDING RESULTS FOR SCENARIOS WITH ... 29 TABLE 3-3LEVELS OF FIRST EIGHT REFLECTIONS WITH CORRESPONDING DIRECTIONS OF ARRIVAL AND AN INDICATIONS OF SIGNIFICANCE ... 31 TABLE 4-1 SOURCE SHIFT VALUES IN DEGREES WITH RESPECT TO THE REFERENCE POSITION FOR THE LEFT WINDOW. ... 42 TABLE 4-2 SOURCE SHIFT VALUES IN DEGREES WITH RESPECT TO THE REFERENCE POSITION FOR THE RIGHT WINDOW. ... 43 TABLE 4-3 SOURCE SHIFT VALUES IN DEGREES WITH RESPECT TO THE REFERENCE POSITION FOR THE WINDSHIELD. ... 43 TABLE 4-4 SESSIONS DESCRIPTION FOR MAA FREE-FIELD EXPERIMENT. WHITE FIELDS POINTS SOURCES UNDER INVESTIGATIONS, GREY FIELDS POINTS “MASKERS” OR NO SOURCE PRESENT. ... 45 TABLE 5-1 SOUND SAMPLES USED IN THE LISTENING EXPERIMENT ... 88
v
List of Acronyms
BRIR Binaural Room Impulse Response DRR Direct to Reverberation Ratio
EDC Energy Decay Curve
ELR Early to Late reverberation Ratio
ETD Early Decay Time
FEM Finite Element Method
FFT Fast Fourier Transform
GA Geometrical Acoustics
HATS Head and Torso Simulator
HRTF Head Related Transfer Function IFFT Inverse Fast Fourier Transform ILD Interaural Level Difference ITD Interaural Time Difference
RIR Room Impulse Response
RT Ray Tracing
RT Reverberation Time
RTF Room Transfer Function
SNR Signal to Noise Ratio SSL Sound Source Localization
1
General introduction and thesis outline
Cars, while in use, will always generate noise. In most of the cases noise is an undesired consequence of driving a car. However, nothing related to humans is straightforward. Perception of acoustics events are extremely subjective. For someone, a loud, sportive car can be, acoustically speaking, an ideal one, while for others it can be extremely annoying. Despite of this trivial example, it is well recognized by everyone that most of the car noises are unpleasant and this explains the current challenges that NVH engineers are asked to face: to optimize the passengers’ acoustic experience in car cabins. Traditionally, there are three main types of noise sources in car cabin interior acoustics.. The first group relates to tire noise, because it is caused by the interaction between tire and pavement. The second, the most characteristic in car interior acoustic, is the powertrain noise. This noise is usually dominated by harmonics that are related to the engine orders and/or to gearbox rattling. The last group addresses wind noise; this noise is caused by air turbulences over the car body. All the three classes are highly related to car speed. Indeed, at low speed, Engine noise is the most dominant noise source. While the car speed increases, tire noise and wind noise becomes more dominant. At highway speeds, wind noise is critical in order to meet high quality customers expectations.Current trend in the automotive industry is to replace “traditional” internal combustion engines into electrical units. As a result, cars are becoming quieter, which brings sound sources originally masked by combustion engines to the top. One of the most industrially important “new” sources is wind noise. Therefore, in the thesis, this type of source will be used as an input for further analysis.
Performing investigation on sounds, especially on those, which cannot be measured separately, require sophisticate methods, like auralization. With this approach, it is possible to predict the character of sound signals that are generated at the source and modified by reinforcement, propagation and transmission in systems such as car interiors [1].
This thesis is mainly focused on the development of a new time-saving auralization method, tailored for car interior applications, which preserve sufficient fidelity in terms of sound reproduction. The proposed method aims at making it possible to auralize wind noise without any prior knowledge of the geometry of the car under investigation. This goal is achieved by using a statistical model of key Room Impulse Response (RIR) parameters and early reflections. Additionally, by exploiting sound source localization and separation techniques (e.g. time domain beamforming and Transfer Path Analysis) it becomes possible to virtually relocate sources and to perform what-if analyses. Currently, in order to “turn off” wind noise sources like side mirrors and evaluate the influence of this part to the overall noise, it is
2
necessary to dismount it from the vehicle and to perform measurement in a wind tunnel again. The proposed approach can be a substantial economic benefit for car manufactures considering the high costs of wind tunnel tests.
The block diagram in Fig.0-1 presents an outline of the overall scope of the thesis. Each block within the dashed area indicates a research topic carried on during the PhD activity. These topics will be presented and discussed more in detail in dedicated chapters along this thesis. The three blocks on top represent possible links with other approaches that can produce inputs for the techniques presented within this thesis.
Fig.0-1 Block diagram presenting the outline of the thesis. Blocks inside the dashed block indicate investigated areas.
Chapter 1 gives the theoretical foundations of car interior acoustics, focusing mostly on the structure and on parametrization methods of Impulse Responses. Relevant auralization techniques are also presented. This chapter gives an overview of sources contributing to wind noise in car cabins.
Chapter 2 presents investigations of driver’s position influence on Head Related Transfer Function
Chapter 3 New auralization methods require investigations on human perception when related to acoustics input estimation techniques (e.g. beamforming measurements). This Chapter aims at defining the optimal number of reflections in RIRs that is necessary to use for in-vehicle sound auralization purposes.
3
Chapter 4 aims at presenting a human-oriented approach to define the minimum accuracy required for source localization techniques when used in car interiors in combination with auralization strategies.
Chapter 5 describes an auralization approach based on a statistical model. The main hypothesis on which the method grounds is that, in car cabins, the diversity of materials and of possible driver’s position, causes the approximation of the acoustic environment for frequencies far above the Schroeder frequency. This holding, the method proposed relays on a statistical approach linking RIR parameters, direct path, early and late reflections. A detailed description of the model implementation and input parameters estimation is provided in Chapter 5.
4
Chapter 1
1
Car cabin acoustics
1.1
Room Impulse Response
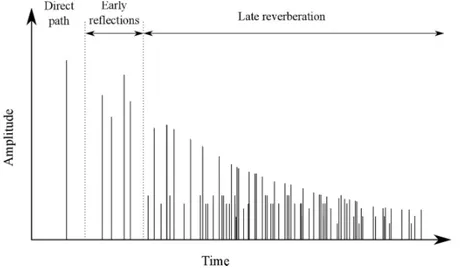
In car cabins, like in all enclosed spaced, whenever a sound source radiates, a signal recorded by the receiver not only consists of the excitation by the source. In fact, the propagating sound waves are reflected on the car panels, diffracted on edges, scattered on surface textures, absorbed by surface materials, and attenuated by air, until they finally reach the receiver. Thus, the total sound perceived by a listener consists of a direct sound and a series of delayed and attenuated reflections that arrive shortly after the direct sound (commonly called early reflections) and reflections that arrive after the early reflections (commonly called late reverberation). The latter events describe the acoustical behaviour of the cavity. This process is illustrated in Fig. 1-1. When the source signal is a single pulse, acoustic response of the cavity can be represented by so-called Room Impulse Response (RIR) and denoted by h(t). The Fourier transform of the RIR is typically called the Room Transfer Function (RTF) and denoted by H(f).
Fig. 1-1 An illustration of a RIR division into three parts: direct path, early reflections and late reverberation
5
Below, a short discussion of the three main RIR components will be presented.
Direct sound. It is the first sound that reaches the receiver without any reflection. Considering a wind noise, the main noise source considered in this thesis, the source and the receiver are always in line of sight. It means that in all cases the direct sound is present. This information is of great importance, because the direction of arrival of the direct sound corresponds to the perception of the entire sound localized. This is often referred to as the precedence effect [2]. In case of non-line of sight conditions, there is no direct sound present. The time delay between the initial excitation of the source and the actual time of direct sound arrival is dependent on the distance and on the velocity of the sound. In car cabins the time delay usually does not exceed 4ms.
A short time after the direct sound first, sounds which were reflected from doors, windshield and dashboard are received. These are called early reflections and they are separated in both time and direction from the direct sound. Amplitudes and direction of arrivals of early reflections will vary as the source or the receiver moves inside the car cabin. Early reflections play significant role in perception of a sound in car cabins, since reflecting surfaces are very close to the receiver. This attribute can cause some perceptual phenomena like image shift or tone coloration [3, 4]. Chapter 3 will present more detailed investigations on how early reflections are perceived by a listener.
Late reverberation consist of reflections that arrive with larger delays than the direct sound and early reflections. After a certain period of time, which is, in car cabins, typically 10-15ms after the direct sound, the number of reflections increases gradually and the human hearing cannot anymore perceive them as single events. Late reverberation are nearly independent of the listener’s position, as the human hearing starts to perform a quite rough energetic integration over a certain time slot and angle field [5].
1.2
Methods for IR calculation
1.2.1 Ray tracing method
Ray Tracing (RT) is a very powerful Geometrical Acoustics (GA) method. In RT, a sound source at a given position emits numerous sound particles in all directions and each sound particle is tracked around the room. The principle of a particle propagation is considered in much the same way as light rays are treated in optics. Each particle travels on a straight path until it hits a wall loosing energy. After every reflection, a new direction of propagation is determined according to Snell’s law. When a particle reaches a receiver position, the energy and time of arrival are stored and can be presented in an echogram. It is important to define an area or a volume around the receiver in order to catch particles when passing by. RT,
6
generally speaking, is a sort of Monte Carlo simulation. Fig. 1-2 illustrates appended rays propagation paths obtained by the RT method.
First works on ray acoustics were already known in the early 1930s [6]. Many years later, with the arrival of appropriate digital computing systems, in [7] was presented the first computer based RT technique, whose aim was the study of the envelope of early reflected sound energy in time and space taking into account the specific shape of a room. In 1970 Schroeder presented a complete auralization framework for the generation and playback of computer aided room acoustic simulations based on the ray tracing technique [8]. From then on, many works related to this technique have been presented to the scientific community [9, 10, 11, 12]. RT is also implemented in several commercially available room acoustic simulation software.
Fig. 1-2 Cross section of a car illustrating source propagation inside a car cabin calculated using RT method. Green lines indicate sound paths from a source (S) to a
receiver (R).
1.2.2
Statistical methods
Ray tracing method and wave based methods of calculating RIRs have common big disadvantage. They all require a car model and a set of acoustic parameters that characterize
7
the boundary. Similar results might be achieved in much simpler way. Statistical Room Acoustics (SRA), under certain assumptions, can provide a statistical description of RTF between source and receiver on the basis of few parameters like source-receiver distance, source location, cavity volume etc.
Sabine presented the earliest attempt to room statistical methods. He introduced, in the late 19th, a calculation method of the reverberation time of a space without considering the details of its geometry. More than 50 years later, Schroeder extended Sabine’s fundamental work [13] and derived a set of statistical properties describing the frequency response of a random impulse response. In [14] Moorer et al. noted that the impulse responses in the finest concert halls around the world sounded remarkably similar to white noise with an exponential amplitude envelope. To test this observation, they generated synthetic impulse responses by shaping unit-variance Gaussian pseudo-random sequences with an exponential of the desired length. The direct sound was added by including an impulse at the beginning. Later, Polack [15] developed a time-domain model excluding the contribution of the direct path and describing RIR as a realization of a non-stationary stochastic process:
( )
< ≥ = − . 0 , 0 ; 0 , ) ( t t e t b t h t ζ 1. 1where b(t) is a zero-mean stationary Gaussian noise, and
ζ
is a damping constant related to the reverberation time, RT60, by60 3
)
10
log(
T
=
ζ
. 1. 2This statistical model is valid when the sound field is diffuse, i.e., when the sound energy density and the direction of the intensity vector are uniformly distributed across the room. The peaks in the acoustic impulse response then no longer correspond to the arrivals of individual reflections. The point at which RIR can be adequately approximated using statistical methods is called the mixing time. For rooms, fairly arbitrary value of 80 ms is usually taken. In car acoustics, the mixing time is much shorter and varies from 10 ms to 20 ms. The simplest method for calculating the mixing time is based on the average number of reflections, i.e., the echo density (De), which is approximately proportional to the square of time t [16]:
8
,
4
)
(
2 3 eV
t
c
t
D
≈
π
1. 3where V is room volume in m3 and c denotes speed of sound in m/s. Modifying the equation above and taking four reflections as suggested in [17], the popular estimation of the mixing time equals:
V
t
mix≈
in ms. 1. 4For car interior acoustics, this method provides a mixing time of about 2 ms, which is rather incorrect. Literature gives couple of different methods for the mixing time estimation [17, 18, 19, 20, 21, 22]. All of them are compared in [23]. Among them, the method proposed in [22] based on kurtosis calculations seems to be the most suitable for car RIR. Later in Chapter 3, it will be shown that the mixing time can be perceptually estimated based on the detection of a threshold on early reflections in RIR.
Recently, two modifications of the Polack’s model have been introduced. A generalized Polack model, which is valid when the source-receiver distance is smaller than the critical distance, was presented in [24]. In [25] a model including early decay time as a second decay curve was also developed.
1.3
RIR parametrization
1.3.1
Reverberation Time
Reverberation time (RT60) is the well-known, and probably the most common, parameter describing the acoustic behaviour of an acoustic cavity. This term was introduced in Sabine’s pioneering research, in which he noticed that reverberation time was proportional to the volume of the room and inversely proportional to the amount of absorption. Because the absorptive properties of materials vary as a function of frequency, the reverberation time is also frequency dependent.
Reverberation time, is calculated from the energy-decay curve (EDC) of the RIR, which can be obtained by integrating the impulse response h of the cavity as follows [26]
τ
τ
d h t EDC t∫
∞ = ( ) ) ( 2 . 1. 5The EDC(t) is the amount of energy remaining in the IR, h, at time t. If the Signal to Noise Ratio (SNR) is sufficient, RT60 usually refers to the measured time for the EDC to decay
9
60dB. In practice very often RT60 is estimated based on the lower decay, e.g. 30dB as illustrated in Fig. 1-3
Fig. 1-3 Illustration of how reverberation time and early decay time are calculated from an energy decay curve.
1.3.2
Early Decay Time
Early reflections may decay with different rate than the late part of RIR. Jordan [27] proposed a parameter, very similar to RT, called Early Decay Time (EDT). The difference relies on the decay of EDC at which EDT is estimated: 10 dB instead of 60dB.
Fig. 1-3 presents an estimation method to derive the EDT (blue dotted line) and the RT (red line).
1.3.3
Direct-to-Reverberant Energy Ratio
Direct to Reverberant Radio (DRR) is an objective measure of RIR describing the energy of a direct sound with respect to all reflections. If the h(t) is a RIR, the Direct-to-Reverberant Ratio (DRR) is denoted as
10
∫
∫
∞=
d d t tt
h
t
h
)
(
)
(
log
10
DRR
2 0 2 10 , 1. 6where td is the direct-path propagation delay. In practice, the numerator of the equation 1. 6 is often assumed to be the largest magnitude peak at the beginning of the impulse response. Due to the finite sampling of RIR, the arrival time of the direct path component, and therefore the related energy, cannot be determined precisely. Therefore, a correction factor is often taken, which widen the time of the direct estimation path for a couple of ms.
DRR is inversely related to the distance of the sound source. This relationship results primarily from the effect of the inverse-square law on the direct portion of the sound field. Energy in the later-arriving reflected portion of the sound field may often be well approximated by a diffuse sound field, which is defined to have uniform energy over varying source positions. Hence, close sources produce a greater proportion of direct-path energy relative to the amount of reverberant energy than sources located farther away [28].
1.3.4
Early to Late Reverberation Ratio
The Early to Late Reverberation Ratio (ETL) gives the relative amount of early and late energy expressed in decibels. It is defined as:
∫
∫
∞=
mix mix t tt
h
t
h
)
(
)
(
log
10
ETL
2 0 2 10 , 1. 7where tmix is the mixing time. When tmix value is set to 50 or 80 ms, ELT is usually called Clarity Index. For car cabin application, the value of tmix is of course smaller. A deeper investigation on tmix in car cabin acoustic will be given in in Chapter 5.
1.4
Car wind noise
Wind noise inside a car cabin results from air flowing around the car body and increases with vehicle speed. At speeds above 100 km/h, it represents the major vehicle interior noise and it is critical in order to meet high quality customers expectations. In addition to airflow
11
excitation, vehicle interior wind noise perception depends on the sound transmission behaviour of the car body and may be influenced e.g. by the door and window seals [29]. Wind noise refers to the following noise and conditions [30] :
• Aerodynamic noise induced by the vehicle as it moves at high speed through a steady medium (air). This is related to the aerodynamic (or drag) coefficient of the vehicle, which is a function of the vehicle shape and of its cross-sectional area;
• Aerodynamic noise due to turbulence through “holes”, which corresponds to sealing to the vehicle parts;
• Aerodynamic noise due to exterior varying wind conditions, such as cross-wind on a highway. This is different from the previous two, since this type of wind noise is fluctuating.
In this thesis sources originating by the first group, i.e. caused by car’s high speed through a steady medium. This group is the most important and cannot be eliminated. The second general group occurs in “unhealthy” cars, due to errors in production or caused by damaged of sealing materials during use. The last group exhibits unsteady behaviour and produces rather low frequency noise (up to 300Hz), below Schroeder’s frequency, which is out of scope of this thesis.
In-vehicle wind noise can be localized exploiting, for example, beamforming methods. A schematic presentation of wind noise sources beamforming map is illustrated in Fig. 1-4. Based on this information, in-vehicle wind noise sources can be divided into 5 components. The first two correlated noise sources are caused by door side mirrors. They have a major impact on wind noise observed at the driver's position. Door mirrors are the largest outstands form a vehicle body, causing strong air turbulences behind them. Moreover, Left mirror is located very close to the drivers position.
The interaction between outside flows and exterior surfaces at the front and sides of the vehicle forms a strong swirling fluid structure called A-pillar vortex which is also an important wind noise sources [31]. Like door side mirror noise, it occurs symmetrically. The last source that can be localized in car cabins is noise generated by wipers. The size of this source depends on the wipers size, but it is typically a distributed noise source located parallel to the bottom part of a windshield.
12
13
Chapter 2
2
Head Related Transfer Functions for
in-vehicle auralization
Summary
Quality of sound auralization highly depends on Head-Related Transfer Functions (HRTFs) used. Pinna, head and torso, which are considered in HRTFs, influences human aural perception in common daily life environments. However, when dealing with complex acoustic environments such as car cabins, higher accuracy of reproduced sound can be achieved if adding further body contributions in a HRTFs database. A new approach for measuring and processing HRTFs targeted at auralizing sound in car cabins has been proposed. The new HRTFs database includes reflections from almost straighten arms, like in a typical driving position, to improve sensation of externalization and enhance sound localization accuracy. Since some sources inside a car appear closer to driver’s or passenger’s ears (e.g. left mirror noise) and other farther (e.g. right noise), HRTFs are measured at several source- receiver distances. In order to improve repeatability of the approach and to have an acoustic input reference, volume velocity source is used as exciting source to measure HRTFs.
2.1
General overview of the HRTF database
Sounds can be reproduced in several ways, depending on the applications and requirements set. For some, a monaural signal can be sufficient. However, for sources where spatial information are important for correct sound evaluation binaural signals are required. In this case the simplest way is to record the signal using Head and Torso Simulator (HATS). In many situations, HATS recordings are not possible, therefore as an alternative very often a binaural synthesis. The synthesis is performed by convolving a source signal with a pair of Head-Related Transfer Functions (HRTF) filters in the time domain. HRTFs are essentially two transfer functions for each direction of sound incidence for the left and the right ear.
14
These transfer functions describe direction-dependent acoustic transformations of a sound from the free field, modified by the torso, head, pinna and ear canal before it hits the listener’s eardrums.
HRTF databases are widely used in auralization. Some of databases are publically available. Recently a file format SOFA (Spatially Oriented Format for Acoustics) for storing HRTFs has been introduced [32] [33] and standardized by the Audio Engineering Society as AES69-2015. The most popular HRTF database referred in many publications are of the KEMAR dummy head [34] or Neuman KU 100 [35]. Well know and publically available are HRTF databases of humans measured at the entrance of an ear canal.
HRTF databases mentioned above are measured in far field conditions (above 1m source-receiver distance). Considering wind noise sources, this requirement is only fulfilled for a right mirror and an A-pillar. For closer wind noise sources (wipers, left mirror and A-pillar) a near field HRTF database should be used. This type of HRTF databases are also publically available are.
HRTFs describe how an impulse signal emitted by a point source in free field is affected by reflection from the torso, head, pinna and ear canal. However, driver’s position is different from position of a listener’s in a concert hall. Almost straighten arms creates the closest reflecting surface for acoustic waves, similar to the influence of the torso. None of know HRTF database include arms influence on HRTFs. Therefore, this chapter presents effect of typical driver’s position, including straighten arms, on HRTFs.
2.2
Measurements and results
HRTFs are usually computed as the ratio between the complex sound pressure measured at the left and the right eardrums and the complex sound pressure at the center of the head with the head absent. By doing this division and assuming that exactly the same system was used to do both sound-pressure measurements, the transfer function of the measuring system which generally constitutes microphones, amplifiers, analog-to-digital and digital-to-analog converters, and loudspeakers is eliminated [36]. In this thesis, HRTF were measured using the LMS volume velocity source. The reason is twofold. This type of source incorporates an internal sound source strength sensor, which outputs a real-time volume velocity signal. Therefore there is no need to measure the pressure at the center of the head with the head absent, which increases measurement accuracy. The second reason for using this type of source is it’s small dimensions. The source has small, 3cm width nozzle, which is important for near filed measurements.
HRTFs were measured in semi anechoic chamber. A Bruel&Kjaer 4128 HATS was used. Arms from a mannequin were attached to the HATS torso. In order to minimize the influence of different acoustic impedance of the HATS and the arms, a sweater was put on the modified
15
HATS as shown in the Fig. 2-1. During measurements, the excitation signal was a burst random noise of frequency range 200Hz to 20kHz. HRTFs were acquired using Test.Lab software and LMS Scadas frontend. Measurements were carried out in two session, first preliminary with azimuthal resolution of 30̊ and high arms inclination Fig. 2-1, and second more detailed with azimuthal resolution of 5̊ with lower arms inclination angle Fig. 2-2.
Table 2-1 HRTF measurement scenarios
Distance: 40 cm 70 cm 120 cm Azimuth resolution 30 degrees 5 degrees Elevation resolution 30 degrees Arms inclination angles 2
Fig. 2-1 Modified HATS used for measurement
16
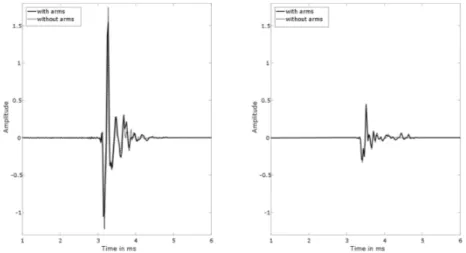
During measurement campaign, HRTFs were acquired for different scenarios listed in Table 2-1 and Fig. 2-4 present HRTF and corresponding impulse response for 60⁰ azimuth, 0⁰ elevation and 70 cm distance. For the ipsilateral ear (the right ear in this case), influence of arms is very weak, whereas for the contralateral ear (the left ear in this case) HRFT is strongly affected by the reflections from arms. Contralateral ear is always in acoustic shadow, therefore reflections from arms have higher impact on the HRTF.
Reflections from arms for the contralateral ear create repeatable notches in HRTs. First notch can be observed at 1kHz and repeats every 1kHz. This difference in HRTF shape can cause a tone coloration.
Fig. 2-3 HRIR with and without arms for 60⁰ azimuth, 0⁰ elevation and 70 cm distance.
17
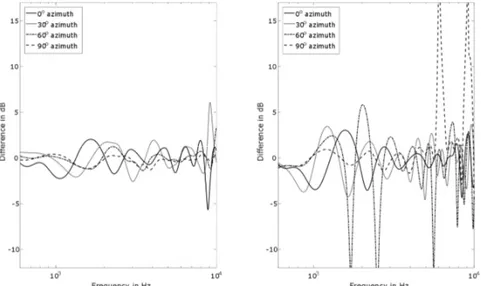
Fig. 2-6 and Fig 2-6 show arms influence on near field HRTFs with respect to source-receiver distance for the contralateral ear. Presence of arms only slightly affects near field HRTFs. On the contrary, as source gets farther to receiver (more than 40cm), HRTFs have been found to change with distance due to presence of arms. At 70cm and 120cm distance reflections from arms are clearly noticeable, whereas they are less evident at 40cm. Such phenomenon is interesting for in-vehicle sound auralization since different source-receiver distances can occur. For example, in order to auralize left mirror and A-pillar wind noise, near field HRTFs should without arms can be use. For wipers, mirror and A-pillar on the right side of a car cabin, using the HRTF with arms database for is more suitable.
Fig. 2-5 Distance dependency of HRTFsfor azimuths angles: 60˚(left) and 0˚ (right)
18
Fig. 2-8 and Fig. 2-8 show HRTF difference with arms and without arms for four azimuths angles: 0˚, 30˚, 60˚ and 90˚ for the ipsilateral and contralateral ear respectively at the distance of 70 cm and 120 cm. It can be seen that for 0˚, 30˚ azimuth influence of arms on HRTFs are approximately the same for both ears. For 60˚ and 90˚ azimuth angles for high frequencies differences between the contralateral ear and the ipsilateral ear becomes evident.
Fig. 2-7 Arms influence on HRTFs at the distance of 70 cm (left and right ear)
19
Fig. 2-9, Fig. 2-10 and Fig. 2-11 present HRTFs as functions of azimuth for 0̊ elevation at three different distances 120, 70 and 40 cm. These HRTFs were measured for HATS with lower arms inclination angle, as presented in Fig. 2-2. According to expectations, the influence of arms in HRTF in weaker for lower arms inclination angle. Nevertheless, differences are still clearly visible. It can be noticed that for the ipsilateral ear (azimuth from 0̊ to 180̊) additional reflections from arms have the strongest impact on frequencies above 5-6kHz. For the contralateral ear (azimuth from 180̊ to 360̊) a ‘new’ distinct pattern is visible for all frequencies.
Fig. 2-9 HRTFs for different azimuth for 0⁰ elevation at 120 cm distance without arms (top) and with arms (bottom)
20
Fig. 2-10 HRTFs for different azimuth for 0⁰ elevation at 70 cm distance without arms (top) and with arms (bottom)
For 40 cm source-receiver distance, the influence of arms is very weak Fig. 2-11. The same effect was noticed for higher arms inclination angles Fig. 2-6. 40 cm distance is counted from the source nozzle to the center of the HATS’s head, thus the source nozzle is really close to the HATS microphones. Acoustic waves reflected from arms reach HATS’s ears mostly by diffraction.
21
Fig. 2-11 HRTFs for different azimuth for 0⁰ elevation at 40 cm distance without arms (top) and with arms (bottom)
22
2.3
Conclusions
In this chapter, a new database for in-vehicle auralization war presented. Results show that presence of arms changes HRTF shape. Reflections from arms have the highest influence on HRTFs for azimuth higher than 20̊. (when one ear is in acoustic shadow). Reflections from arms for the contralateral ear create repeatable notches in HRTs. First notch can be observed at 1kHz and repeats every 1kHz. This difference in HRTF shape can cause a tone coloration. Influence of arms is depend on distance. For 40 cm source-receiver distance, the influence of arms is very weak. For that close distance, acoustic waves reflected from arms reach HATS’s ears only by diffraction. Therefore, HRTFs with arms should be used for wind noise sources appearing farther than 40 cm from the listener, e.g. wiper noise, right mirror and A-pillar noise. Despite this final conclusion, in the following chapters HRTFs without arms were used. This choice was made only due to required high spatial resolution of a HRTF database (1˚ instead of 5˚).
23
Chapter 3
3
Auditory perception of early reflections in
car cabins
Summary
A current challenge that NVH engineers are asked to face is to optimize the passengers’ acoustic experience in vehicle cabins. The combined use of sound source localization techniques and auralization tools can help in tackling such issue. Data from the source localization step, i.e. sources and early reflections, can be auralized in order to assess the acoustic quality of the cabin. The remaining question is to understand how many reflections are effectively needed for providing a realistic listening experience. By varying the order of early reflections included in the auralization step, a different auditory impression is perceived by humans. At a certain point, increasing the number of individual reflections does not change the auditory impression and the rest of reverberations can be replaced by a constant reverberation tail. This chapter aims at defining the optimal number of reflections that is necessary to use for in-vehicle sound auralization purposes. A ray tracing model of a car cabin is used for generating the data set containing the sound samples auralized by changing the number of reflection orders. Results from subjective tests are presented to show the correlation between auditory impression in the cabin and the optimal number of reflections used in the auralization.
3.1
Early reflections problem in car-cabins
Auditory thresholds for early reflections in concert halls and rooms have been previously investigated using real sound sources [37, 38, 39] or using auralization for simulating direct and reflected sources [40, 41]. Additionally, some authors focused on minimum audible difference in direct to reverberant energy ratio [42, 43]. However, no previous work focusing on similar problem for automotive applications has been reported. Car cabins are characterized by peculiar acoustic environment, where reverberation time is short and
24
reflections appear close to each other in time. Different, compared to concert halls or rooms, forward and backward masking [5] can cause different perception of early reflections. In this chapter two problems are investigated. First, how including or excluding individual reflections in auralization affect human perception (threshold for inclusion of a reflection). Car interior is a mixture of various absorbing materials (e.g. well dumped seats, doors and reflective windows), where we can expect single strong reflections from windshield or windows, and many weak reflections from trimmed parts. Hence, only a few early reflections might be necessary to include in auralization to achieve the “natural” sound, while the rest of reverberations can be replaced by a stochastic reverberation tail as will be described later in Chapter 5. From Chapter 1 we know that main wind noise contributors are mirrors, A-pillars and wipers. The main focus of this chapter is on a left mirror, as the most dominant source and closest to a drivers’ position. Analysis was carried out on left mirror noise separately and together with other wind noise sources as markers.
The second problem under investigation is the level of early reflections at which we can perceive change in auralized sound (threshold for inclusion of an early reflection). This threshold leads to very useful information of required dynamic range of sound source localization techniques for car cabins applications. Previous studies show threshold dependence as a function of angle of incidence, time delay and sound source type [3, 44, 45, 42, 46]. Therefore, results vary from almost -30 dB (reflection to direct relative level) for broadband noise, lateral reflection and long delay time [39], to -5 dB for speech, reflection from the same direction and short time delay [41]. Also dependence of the threshold level and reverberant environment was reported [39]. This chapter derives threshold of individual reflections for short delay times, broad band noise simulating car cabin wind noise and different directions (detailed description in section 3.1). As in the problem of threshold for inclusion of a reflection, analysis was carried out on left mirror noise separately and together with other wind noise sources as markers.
3.2
Experiment investigation
In order to determine auditory thresholds of early reflections in car cabins, four different scenarios were investigated:
• Only left mirror wind noise source with removed reflections;
• Left mirror wind noise source with removed reflections in the presence of other wind noise sources;
• Only left mirror wind noise source with amplified or deamplified reflections; • Left mirror wind noise source with amplified or deamplified reflections in the
25
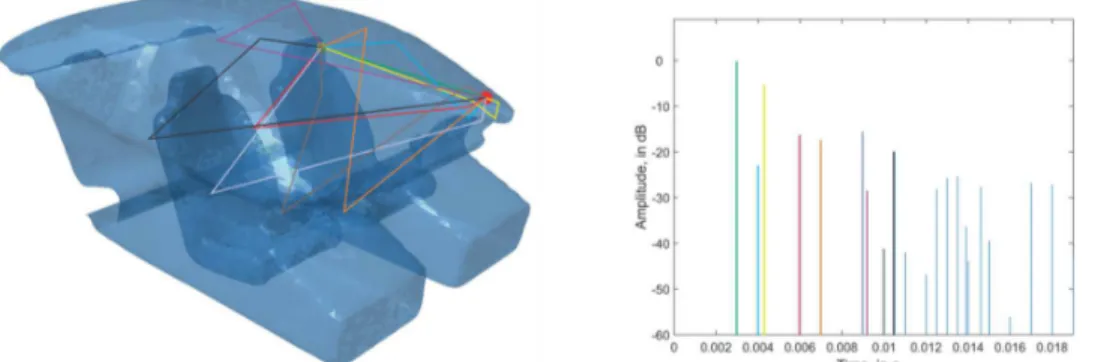
Using ray tracing technique, impulse responses of a premium sedan car cabin were generated. Calculations were carried out in LMS Virtual.Lab software. In order to simulate wind noise, a monopole source was placed on the left mirror. The dry sound was obtained by filtering a white noise to achieve the same noise spectrum as measured in a wind tunnel during previous measurements. Fig. 3-1 reports the wind noise spectrum used for auralization. Receiver was placed in the center of a driver’s head. A model of the car with marked ray paths and the corresponding energetic impulse response are presented in Fig. 3-2.
Fig. 3-1 Spectrum of wind noise signal used in auralization.
In practice, not only one mirror generates noise. As illustrated in Fig. 1-4, both mirrors, A-pillars and wipers are acting together. Thus, it is reasonable to investigate our problem in the presence of all sources. For simplification, only left mirror noise will be modified, whereas all other sources play the role of a “masker”. The principle of our “masker” calculation stays the same. In the car model, sources were placed in positions corresponding to natural occurrence, receiver in the centre of a drivers’ head and the ray tracing technique was used to calculate impulse responses. Detailed description of source location in the car cabin and levels are presented in Fig. 3-2
The ray tracing model was used not only to generate impulse response of a car, but also to obtain direction of arrival of each reflection, which is a great advantage of ray tracing over other numerical methods. The reverberant stimuli were generated by additional processing of the dry stimuli. Each reflection was spatialized by convolution with HRTF filter pair, corresponding to the angle of incidence calculated by ray tracing (see [47] for detailed description of HRTF database used).
26
Fig. 3-2 The model of a car used in ray tracing simulations (left) and first 20ms of the corresponding impulse response (right).
Four listening experiments were carried out, one for each scenario. The aim of the first and the second experiment was to determine the threshold for inclusion of a reflection (early or late). The last two experiments were focused on the level of early reflections at which humans can perceive change in auralized sound. Ten listeners without known hearing problems (all male, ages 22–31) participated in all experiments. All stimuli were presented to subjects via headphones (Sennheiser HD-600 with an external sound card) within a quiet office room, where the noise floor was below 20 dBA. The level of stimuli was calibrated using a head and torso simulator in order to present them with a level comparable to the one generated by wind in car cabins – 45 dBA.
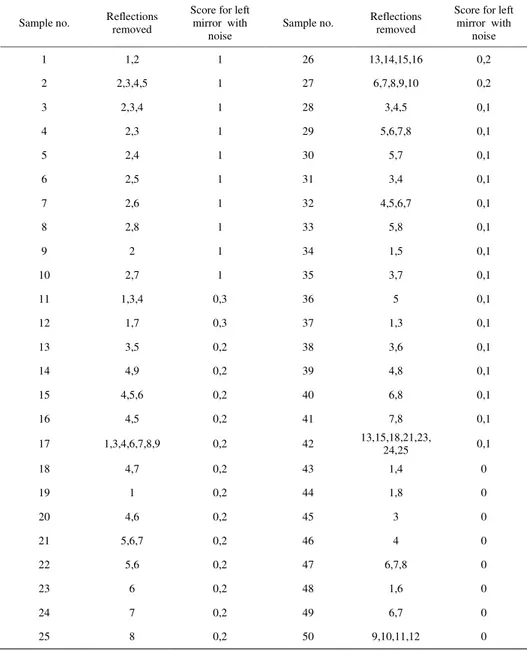
In the first experiment, sounds, which were presented in pairs, consisted in a reference reverberant sound (spatialized, with all reflections) and a modified sound. The modifications consisted in excluding individual or multiple reflections from the impulse response. Finally, listeners were asked to identify whether two stimuli heard in succession are different or not. The test consisted of 50 pairs, and reference and signals were presented in random order, with an interstimulus interval of 500 ms. Due to the high number of reflections in echogram, performing full factorial experiment is practically impossible. Therefore, preliminary investigations took place, in order to select the most relevant reflections or group of reflections to be removed in stimuli for the experiment. Reflections from one to eight (those appearing within first 10ms, see Fig. 3-2) were removed separately at a time. Most of sound samples consisted of two or three removed early reflections. The purpose was to investigate the influence of each early reflection separately and a group of early reflections on auditory perception. The latter, gives as information about possible interactions between early reflections. Last part of stimuli was focused on a late reverberation. Thus, we removed some of reflections appearing after 10ms. Detailed description of which reflections were removed from sounds and corresponding results are listed in Table 3-1.
27
The second experiment is essentially similar to the first one. The only difference is an added masker consisting of other wind noise sources.
The third experiment was carried out in a similar manner as the first one. However, the way how stimuli were modified is different. Here, we were interested in the level of early reflections at which humans can perceive change in auralized sound. Therefore, a set of stimuli were prepared where the level of individual reflections was changed, while other reflections remain the same. The level of analyzed reflection was changed in 1dB step from -18dB to -8dB (reflection to direct relative level). Due to time constrains of a listening experiment and preliminary investigations, only the first five reflections were taken into consideration. To sum up, 55 pairs, consisted of modified sound and the reference, were presented to listeners. Like in previous experiment reference and signals were presented in random order, with a time gap of 500ms and listeners were asked to identify whether two stimuli heard in succession are different or not. The last experiment repeats experiment no. 3 with added noise, like in experiment no. 2
3.3
Results and discussion
In all conducted experiments, thresholds were calculated analogously. Each modified sound gets 1 point when a listener identifies it as different from the reference. Points for all stimuli for all participants are summed up together and divided by the number of participants. In this way, results are presented on a scale from 0 to 1, where 0 means none of participants was able to recognize a difference, and 1 means all participants perceived the stimulus as different from the reference. The threshold is a point where at least half of participants identified a difference (results higher or equal 0.5).
3.3.1
Threshold for inclusion of a reflection
Table 3-1 presents results of the experiment for the left mirror; reflections removed from stimuli are listed as well in Table 3-1.
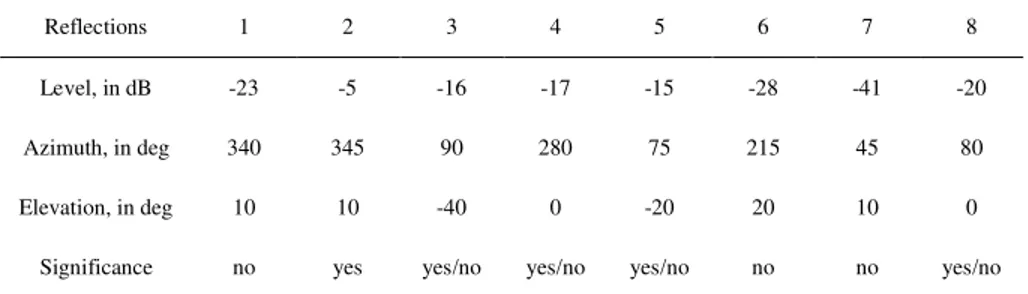
analogously presents results for the left mirror in the presence of all wind noise sources. According to predictions, reflection number two was selected to be the most significant in both experiments. Lack of this reflection, independently or together with other reflections, is audible by all listeners who participated in the experiment. The reason is straightforward: the level of this reflection is approximately only 5 dB lower than the true source which is in compliance with results achieved in the next section. Additionally, reflection number two appears only 1,3ms after the true source. That short repetition of a “dry” sound coming from almost the same direction as the source causes strong interference pattern. This leads to a perceptual effect called tone coloration [3, 45]. Fig. 3-3 shows two spectra of the left mirror
28
Table 3-1 List of sound samples used in the experiment with numbers of removed reflections and corresponding results
Sample no. Reflections removed Score for left mirror Sample no. Reflections removed Score for left mirror
1 1,2 1 26 1,8 0,3 2 2,3,4,5 1 27 3,7 0,3 3 2,3,4 1 28 5 0,3 4 2,3 1 29 1,3 0,2 5 2,4 1 30 1,7 0,2 6 2,5 1 31 1 0,2 7 2,6 1 32 3,6 0,2 8 2,8 1 33 3 0,2 9 2 1 34 4,6 0,2 10 3,5 1 35 4 0,2 11 2,7 0,9 36 5,6,7 0,2 12 3,4,5 0,8 37 5,6 0,2 13 1,3,4 0,7 38 6,7,8 0,2 14 4,9 0,7 39 6 0,2 15 4,5,6 0,6 40 7 0,2 16 4,5 0,6 41 8 0,2 17 5,6,7,8 0,6 42 13,14,15,16 0,2 18 5,7 0,6 43 4,8 0,1 19 1,3,4,6,7,8,9 0,5 44 6,7,8,9,10 0,1 20 3,4 0,5 45 6,8 0,1 21 4,5,6,7 0,5 46 7,8 0,1 22 4,7 0,4 47 13,15,18,21,23,24,25 0,1 23 5,8 0,4 48 1,6 0 24 1,4 0,3 49 6,7 0 25 1,5 0,3 50 9,10,11,12 0
29
Table 3-2 List of sound samples used in the experiment with numbers of removed reflections and corresponding results for scenarios with
Sample no. Reflections removed
Score for left mirror with
noise
Sample no. Reflections removed
Score for left mirror with noise 1 1,2 1 26 13,14,15,16 0,2 2 2,3,4,5 1 27 6,7,8,9,10 0,2 3 2,3,4 1 28 3,4,5 0,1 4 2,3 1 29 5,6,7,8 0,1 5 2,4 1 30 5,7 0,1 6 2,5 1 31 3,4 0,1 7 2,6 1 32 4,5,6,7 0,1 8 2,8 1 33 5,8 0,1 9 2 1 34 1,5 0,1 10 2,7 1 35 3,7 0,1 11 1,3,4 0,3 36 5 0,1 12 1,7 0,3 37 1,3 0,1 13 3,5 0,2 38 3,6 0,1 14 4,9 0,2 39 4,8 0,1 15 4,5,6 0,2 40 6,8 0,1 16 4,5 0,2 41 7,8 0,1 17 1,3,4,6,7,8,9 0,2 42 13,15,18,21,23, 24,25 0,1 18 4,7 0,2 43 1,4 0 19 1 0,2 44 1,8 0 20 4,6 0,2 45 3 0 21 5,6,7 0,2 46 4 0 22 5,6 0,2 47 6,7,8 0 23 6 0,2 48 1,6 0 24 7 0,2 49 6,7 0 25 8 0,2 50 9,10,11,12 0
30
Fig. 3-3 Spectrum of the left mirror wind noise with all reflections (left) and sound without first five reflections (right)
noise with all reflections (left) and the same noise without first five reflections (right). Strong comb filter can be noticed when all reflections are present. Removing early reflections makes the spectrum more “flat”, therefore reduce tone coloration. Further removing of reflections does not affect a change in the spectrum and becomes unnoticeable for listeners. The spectrum presented in left part of Fig. 3-3 differs from the “dry” sound (Fig. 3-1) because the same dry sound was convolved with the HRTF filter related to the direct path.
Removing reflections from the late reverberation (after 10ms) does not affect perception of a sound. As can be seen from Table 3-1, stimuli no 42, 44, 47 and 50, where a high number of reflections was removed, were impossible to distinguish from the reference stimulus. This leads to a conclusion that reflections from late reverberations do not need to be treated individually. It is sufficient, for an auralization, to replace the exact calculation of a late reverberation, e.g. from a ray tracing simulation, with an universal reverberation tail, calculated stochastically.
31
Table 3-3 Levels of first eight reflections with corresponding directions of arrival and an indications of significance
Reflections 1 2 3 4 5 6 7 8
Level, in dB -23 -5 -16 -17 -15 -28 -41 -20 Azimuth, in deg 340 345 90 280 75 215 45 80 Elevation, in deg 10 10 -40 0 -20 20 10 0
Significance no yes yes/no yes/no yes/no no no yes/no
3.3.2
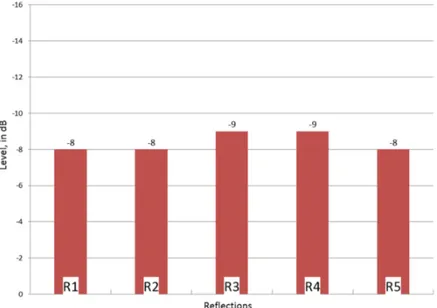
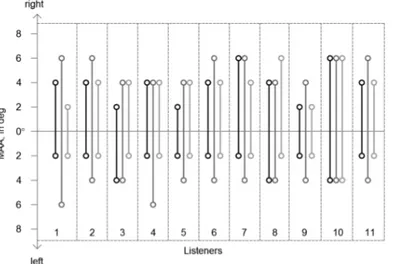
Threshold for an individual reflection with a full impulse response
Fig. 3-4 and Fig. 3-5 present results from experiments where perception thresholds for individual reflections were investigated in two scenarios: with only one noise source acting and with all sources acting together. Results are presented in reflection to direct relative level. Fig. 3-4 shows results of the third experiment. Reflections 2, 3 and 5 have lower threshold (around -14 dB, reflection to direct relative level) than reflections 1 and 4 (around -10 dB). Reflection no.1 appears almost together from almost the same direction with very strong reflection no.2, thus higher threshold can be explained by masking effect caused by the reflection no.2. Despite the fact that reflections 3 and 4 have almost the same levels they have different thresholds of perception. The reason can be explained by differences in direction of arrival. Reflection no. 3 is lateral, causing higher energy in the right ear than the reflection no. 2. The fact that reflections appear from opposite directions affects changes in frequency content of an auralized noise simply due to convolution with different HRTF filters. When not only one source is present at the same time, detection of individual reflections is different. Fig. 3-5 presents results of the experiment when the RIR of left mirror noise source is modified and all wind noise sources i.e. from right mirror, A-pillars and wiper are added as a masker. In this scenario, perception thresholds of individual reflections are the same for all early reflections. Differences between thresholds are within 1dB which can be neglected. Comparing this results with the scenario without masker (Fig. 3-4) shows that all reflections have higher perception thresholds, except reflection no.4 where the threshold stays the same. Interesting is that when masker is added, perception threshold are independent from direction of arrival. Because masker signal consist of other wind noise sources practically from all direction, some spatial cues (like spectrum differences) are distorted, therefore thresholds depends on level differences only.
32
Fig. 3-4 Thresholds for single reflection with a full impulse response
Fig. 3-5 Thresholds for single reflection with a full impulse response and all wind noise sources present