DOCTORATE
MOLECULAR MEDICINE AND MEDICAL BIOTECHNOLOGY XXXI CICLO
Functional assessment of new MYBPC3 variants associated
with Hypertrophic Cardiomyopathy
Tutor Candidate
Prof. Giulia Frisso Maria Rosaria Pricolo
Co-Tutor
Prof. Jorge Alegre-Cebollada
COORDINATOR Prof. Vittorio Enrico
Avvedimento
1.INTRODUCTION 7 1.1 The Sarcomere: the contractile unit of striated muscle 8 1.1.1 Sarcomere contraction and relaxation 12 1.2 Hypertrophic Cardiomyopathy (HCM): definition and clinical
manifestations 15
1.2.1 Genetic bases of HCM 16
1.2.2 Diagnosis of HCM and the role of genetic testing 18 1.3 Cardiac Myosin Binding Protein C (cMyBPC) 19
1.4 RNA Splicing mechanism 21
2. AIMS 23
3. MATERIALS AND METHODS 27
3.1 Material 27
3.1.1 Mammalian Cell culture 27
3.1.2 Bacteria: conservation and manipulation 27
3.1.3 Plasmid constructs 28
3.1.4 Primers 29
3.2 Methods 30
3.2.1 General Molecular Biology 30
3.2.2 Screening of HCM patients 30
3.2.3 Bioinformatics assessment of mutations 31 3.2.4 Homology modelling of protein structure 31 3.2.5 Splicing Analysis of mRNA from peripheral blood 32 3.2.6. RNA Splicing Analysis by Minigene strategy 32
3.2.6.1 Insert Generation 32
3.2.6.2. Minigene Plasmid Construction, Expression,
and Transcript Analysis 32
3.2.7 Biophysical characterization of proteins 33 3.2.7.1 Protein expression and purification 33
3.2.7.2 Circular Dichroism (CD) 35
3.2.7.3 Differential Scanning Calorimetry (DSC) 37 3.2.7.4 Single-molecule Atomic Force Microscopy (AFM) 38
4. RESULTS 43
4.2.2 Experimental validation of splicing pathomechanism 48 4.3 Investigations on pathogenic mechanism of missense mutation 50
4.3.1 In silico and in vitro study of splicing alterations
induced by missense mutations 51
4.3.2 Homology modelling of domain C4 structure 54 4.3.3 Structural and thermodynamic characterization of C4
and missense mutant by circular dichroism 55 4.3.4 Thermodynamic stability of C4-WT and C4-I603M 59 4.3.5 Mechanical characterization of cMyBPC C4 domain
by Atomic Force Microscopy (AFM) 61
5. DISCUSSION 69
5.1 Selection of genetic variants for further functional screening 70 5.2 Pathogenicity study for c.506-2A>C and
c.2308+3G>C variants 71
5.3 Pathogenicity study for p.I603M variant 72 5.4 Pathogenic mechanisms of intronic and
missense mutations in HCM 74
5.5 Functional characterizations of VUS 76
5.6 Mechanical characterization of cMyBPC C4 domain 79
6. CONCLUSIONS 81
7. REFERENCES 83
A Mimmo e ai miei nipoti, Dario, Luna e Simona
Tra le tante canzoni che hanno accompagnato la scrittura di questa tesi c’è una in particolare che è rimasta al mio fianco dall’inizio alla fine, Thunder. Nella prima strofa cita:
“I was dreaming of bigger things And wanna leave my own life behind
Not a yes sir, not a follower”
Ebbene si, forse questa frase racchiude alla perfezione il mio percorso di dottorato. Ho iniziato sognando, del resto sognatrice lo sono sempre stata. Scioccamente mi sono presa la libertà di immaginare un futuro. Ma da cattiva sognatrice so ritornare alla realtà e affrontarla. Ho voltato pagina. E’ stata dura, ansie per il tempo che scorreva, esperimenti di un campo che all’inizio non era il mio, due anni in un altro paese lontano da casa. Ma sono qui a terminare questo percorso e carica per affrontare il mio nuovo futuro. Lungo la strada tante persone sono state al mio fianco, e io ne ho molte che ho bisogno di ringraziare per per avermi incitato, sopportato e per aver condiviso con me questa passione per la scienza.
Prima tra tutte c’è Maria Pia, amica nonché “sorella”. Ricordo ancora quando insieme aprimmo la graduatoria di ammissione al dottorato, e tutta la cioccolata che abbiamo mangiato per festeggiare! Abbiamo condiviso tutto,
In secondo luogo la mia particolare gratitudine va al LabJAC. Mi avete accolto come una famiglia. In primis ringrazio Jorge per essere stato un capo ma anche un mentore. Elìas che mi ha insegnato la termodinamica e tutte le parole spagnole fondamentali! Ma un ringraziamento speciale va alla chicas. Carla e le nostre lunghe camminate parlando di scienza e vita, sperando che google maps non ci porti di nuovo nei meandri sperduti di Madrid! Diana, senza la quale non so come avrei potuto fare tutti gli esperimenti. Ringrazio anche la sua musica che accompagna sempre le nostre giornate in lab. Natalia e la sua grinta, la cui schiettezza ti riporta sempre con i piedi per terra. Carmen e le nostre corse di notte al CNIC. Grazie per avermi insegnato tutto sull’AFM e per aver ascoltato i miei lunghi monologhi!! Infine c’è Angel e le sue GIF. Ora ci starebbe bene la canzone di Snoop Dogg non credi?! Raquel e Antonio (detto Pio IX) che per me sono labJAC ugualmente.
Un forte ringraziamento va anche a Marianna, “mia compagna madrileña”, e a tutte le volte che mi ha aiutata a staccare la spina.
In questi ringraziamenti non si possono non menzionare anche tutti gli amici di una vita. Un pensiero speciale va a te Gigi, fratello mio. Siamo entrambi lontani ma ugualmente tanto vicini. Sappi che sarai sempre il mio pensiero la domenica pomeriggio durante le mie camminate in solitaria!
Ma ringrazio anche Domenico che oltre Maria Pia ha dovuto sopportare anche me. Umberto e Antonella che sempre allegrano le mie giornate, anche se vediamo le cose e le persone differentemente!!
Ringrazio la famiglia di Mimmo, nonché la mia famiglia, i sui genitori, Tommaso e Rosaria, la sorella, Margherita. Vi sento al mio fianco sempre, in passato come ora. Devo a voi tanto, specialmente tutto l’amore che mi avete dato.
In questi ringraziamenti non posso non includere mio padre, per quanto diversi e talvolta lontani so che è orgoglioso di me. Ti voglio bene papà. Infine ringrazio te Mimmo, compagno ma anche amico. Senza il tuo supporto non sarei mai arrivata “viva” alla fine. Sono contenta di ciò che abbiamo costruito insieme, e so che ovunque mi porti la vita, per quanto sia tortuosa la strada, io e te saremo sempre uno al fianco dell’altro.
ABSTRACT
Hypertrophic cardiomyopathy (HCM) is the most common genetic disease of the myocardium. In ~60% of the cases HCM is caused by mutations in sarcomeric proteins, such as cardiac Myosin Binding Protein C (cMyBPC), which are responsible for generating the molecular force of myocyte contraction. A cohort of HCM patients have been screened for mutations in sarcomeric genes, and some new variants of cMyBPC of uncertain significance (VUS) were found. These new variants include two intronic variants (MYBPC3-c.506-2 A>C and MYBPC3-c.2308+3 G>C) and one missense variant (cMyBPC I603M), which were selected for functional study to determine pathogenicity.
The MYBPC3-c.506-2 A>C mutation was analysed in mRNA extracted from peripheral blood of the patient. The analysis revealed the loss of the canonical splice site and the utilization of an alternative splicing site, causing the loss of the first 7 nucleotides of exon 5. For the other variant, minigene constructs were generated to transfect HEK-293 cells. The minigene assay showed that mutation MYBPC3-c.2308+3 G>C also produces altered pre-mRNA processing, resulting in the skipping of the exon 23.
The mutation I603M localizes to domain C4 of cMyBPC. Using bioinformatics sequence analyses, a deleterious effect for I603M was predicted, but mRNA studies do not show any alteration of the splicing mechanism. At the protein level, homology modelling of domain C4 shows I603 to be buried in the protein structure, suggesting a potential destabilizing role of the I603M mutant. Indeed, circular dichroism spectroscopy and differential scanning calorimetry show a ~15ºC lower melting temperature for the mutant C4 domain. Finally, results obtained by single-molecule atomic force microscopy do not show a mechanical fingerprint for C4 indicating a very low mechanical stability of this domain.
Taken our results together, we propose that mutations c.506-2 A>C, c.2308+3 G>C and I603M lead to haploinsufficiency and cMyBPC protein destabilization, respectively causing the development of HCM.
In conclusion, the study of the functional consequences of mutations leads to assignment of pathogenicity of variants of uncertain significance.
ABBREVIATIONS
ACMG American College of Medical Genetics and Genomics
ACTC1 cardiac α-actin gene
AFM Atomic Force Microscopy
BPS Branch site
CD Circular Dichroism
DHPR Dihydropyridine receptor
DSC Differential scanning calorimetry
HBB Human β-globin gene
HCM Hypertrophic cardiomyopathy
HGMD Human Gene Mutation Database
LMM Light meromyosin
LVH Left ventricle hypertrophy
MHC-α α-myosin
MHC-β ß-myosin
MyBPC Myosin-binding protein C
MYBPC3 Cardiac myosin-binding protein C gene
MYH6 Cardiac α-myosin heavy chain gene
MYH7 Cardiac ß-myosin heavy chain gene
MYL2 Regulatory myosin light chain gene
MYL3 Essential myosin light chain gene
PMI Precision Medicine Initiative
PPT Polypyrimidine tract
PTC Premature termination codons
RLC Myosin regulatory light chain
RyR2 Ryanodine receptor
SCD Sudden cardiac death
SRX Superrelaxed tate
Tm Temperature at the midpoint of thermal transition
Tm Tropomyosin
TnI Troponin I
TNNI3 Cardiac troponin I gene
TNNT2 Cardiac troponin T gene
TnT Troponin T
TPM1 Cardiac α tropomyosin gene
UsnRNP Uridine-rich small ribonucleoproteins
VUS Variants of uncertain significance
WLC Worm-like chain model of polymer elasticity
ΔHcal Calorimetric enthalpy
INTRODUCTION
In the 1950s, using high-resolution microscopy, two independent groups of scientists observed changes in sarcomere length during contraction (Huxley and Hanson 1954; Huxley and Niedergerke 1954). The sarcomere is the contractile unit of striated muscle, defined as the distance between two regions called Z-disks or Z-lines. These regions consist of a central A-band, made up of myosin, flanked by two I-bands, which are composed by actin filaments (Figure 1) (Sweeney and Hammers 2018). Huxley and colleagues observed that during sarcomere contraction, the length of the A-band remains constant while the I-band shortens (Krans 2010). Since x-ray diffraction studies proved inextensibility of both thick and thin filaments of striated muscle, they established the “sliding filament theory” as the interaction of myosin and actin that induces shortening of the sarcomere, and thus the muscle, through the sliding of thick filaments on thin filaments (Mijailovich et al. 1996; Lin et al. 2017). Other elements of myofilaments were subsequently discovered to be involved in this mechanism.
Figure 1: Electron micrograph of the sarcomere of skeletal muscle. A longitudinal
thin section through a muscle fibre is shown. The major bands and lines are indicated as Z, Z-line, M, M-line, A-band, I-band and H-zone (Figure adapted from Sweeney and Hammers 2018)
Almost simultaneously to the Huxleys’ research on sarcomere function during the 1950’s, Robert Donald Teare, an English pathologist at St. George’s Hospital in London, reported an autopsy of eight patients with asymmetrical hypertrophy of the heart and disorganized arrangement of muscle bundles associated with hypertrophy of individual muscle fibres and their nuclei (Figure 2). Seven of these caused sudden death in young adults (Teare 1958).
The disease that affected these patients was recognised as a distinct pathology, later named Hypertrophic Cardiomyopathy (HCM).
Figure 2: heart of the first HCM patient with localized hypertrophy of the
interventricular septum (on the left). On the right is shown the disordered arrangement of muscle bundles of the same patient (Figure adapted from Teare 1958).
It was not until years later that the relationship between sarcomere defects and the development of hypertrophic cardiomyopathy was discovered.
1.1 The Sarcomere: the contractile unit of striated muscle
There are three types of muscle: skeletal, cardiac, and smooth. Skeletal and cardiac muscle are referred to as striated muscle because of the regular organization of sarcomeres. These contractile units consist of highly organized components that interact in a very precise manner to generate force and motion. Sarcomeres also integrate many signalling functions in muscle. Indeed, they are connected with other organelles, such as mitochondria or nucleus, by intermediate filaments to maintain cellular integrity and to contribute to mechanotransduction (Sweeney and Hammers 2018).
The sarcomere has three major filament systems that include thin filaments, thick filaments and the giant protein titin. The thin and thick filaments extend from the Z-disk and line, respectively, overlapping on each side of the M-line and creating distinctive regions within the sarcomere (Figure 3) (Henderson et al. 2017; Lin et al. 2017).
9 attached to the Z-disks. Actin monomers (G-actin) polymerize into long filaments (F-actin) at physiological ionic strength and in the presence of Mg2+ and K+, forming a tightly wound helix (Roberto Dominguez and Kenneth C. Holmes 2011). G-actin consists of four subdomains (SD1- SD4) that form a binding pocket for ADP or ATP as well as the divalent ions Mg2+ and Ca2+. The region SD1 and SD2 also interact with other myofilament proteins, such as myosin and myosin binding protein C (MyBPC). Specifically, actin SD1 binds to the myosin head, also known as myosin S1 via ionic interactions (Lin et al. 2017). Three homologous isoforms of actin (α, β and γ) are expressed in vertebrates. The α-actin, in turn, consist in skeletal, cardiac, and smooth variations. Skeletal and cardiac isoforms are differentially expressed: ACTC1 gene encodes α-cardiac-actin, whereas α-skeletal-actin is expressed by ACTA1 gene (Henderson et al. 2017).
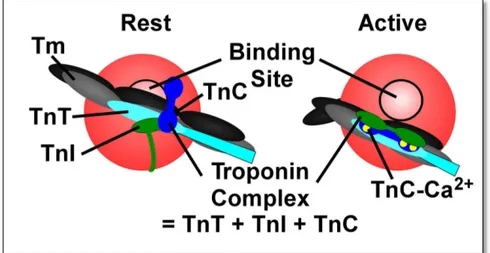
Other thin filament proteins, tropomyosin (Tm) and troponin (Tn), regulate the contraction of striated muscle. Tropomyosin is an elongated coiled-coil molecule that binds to the surface of the thin actin filament (Figure 3 and
Figure 4). Troponin comprises three subunits: troponin T (TnT), which binds
to tropomyosin; troponin I (TnI), which binds to both actin and tropomyosin; and troponin C (TnC), which confers Ca2+ sensitivity to the system (Sweeney and Hammers 2018).
Figure 3: schematic diagram depicting the three major filament systems found in
sarcomeres. Thin filament (gray), thick filament (blue), titin (pink) (Figure adapted from Henderson et al. 2017).
Myosin is the main component of the thick filament. Myosin is the molecular
motor that drives muscle contraction trough interaction with thin filaments. Myosin is composed of heavy chain fragment (MHC) and light chain fragment (MLC). Myosin heavy chain consist of three regions: N-terminal head (S1),
Figure 1.
(A) Schematic representation of a cardiac sarcomere (lacking nebulin) illustrating the three major filament systems: actin-based thin filaments (gray), myosin-based thick filaments (blue), and titin (pink). The lateral boundaries of the sarcomere are the Z-discs. The I-bands surrounds the Z-disc and is a region where thin filaments are not superimposed by thick filaments. The A-band region contains thin filaments and thick filaments. The M-band falls within the H-zone, where thick filaments do not interdigitate with thick filaments. (B) Electron micrograph of skeletal muscle sarcomere. (C) Enlarged view of the M-band region. The M-band is composed of a series of three to five electron-dense M-lines: M6′, M4′, M1, M4, and M6. [Part A modified, with permission, from (255); Parts B and C modified, with permission, from (9).]
Henderson et al. Page 91
A uthor Man uscr ipt A uthor Man uscr ipt A uthor Man uscr ipt A uthor Man uscr ipt
neck (S2) and a C-terminal long tail region known as light meromyosin (LMM) (Figure 4). The S1 subfragment projects outward from the thick filament and contains a motor domain that binds actin filaments to form cross-bridges. This interaction drives actin-based movement via ATP hydrolysis. The neck region transduces force through its lever arm and the highly variable tail region mediates myosin interactions. Myosin light chains regulate MHC motor function by binding to the neck region (Henderson et al. 2017).
Two major isoforms of myosin are present in heart muscle: α-myosin (MHC-α) and ß-myosin (MHC-β) expressed by the MYH6 and MYH7 genes, respectively. In cardiac muscle of small mammals (e.g., mice), MHC-β is the predominant isoform during development and is replaced by MHC-α in the adult. In large mammals such as humans, MHC-α is expresses during development while MHC-β is the predominant isoform in the adult heart. In failing hearts (mouse and human), MHC can shift to the fetal isoform as a maladaptive response to severe cardiovascular stress (Lin et al. 2017).
Another component of the thick filament is the myosin-binding protein family (MyBP). This family consists of myosin-binding protein C (MyBPC) and myosin-binding protein H (MyBPH). Both MyBPs are located within the C-zone of A-band region and are arranged in 7 to 9 transverse stripes spaced at 43-nm intervals. There are three isoforms of MyBPC: a slow skeletal isoform, a fast skeletal isoform and a cardiac isoform, encoded by the distinct genes MYBPC1, MYBPC2, and MYBPC3, respectively. There is only one isoform of MyBPH (human gene MYBPH) expressed in the Purkinje fibers and fast twitch skeletal muscle fibers. MyBPC is thought to link the thick and thin filament systems and further regulate cross-bridge cycling by displacing tropomyosin and competing with myosin for actin binding. Specifically, the N-terminus of MyBPC binds actin filaments, regulating contraction by altering the actin-activated myosin ATPase activity. MyBPC’s N-terminal M-motif also interacts with the S2 region of myosin, leading to regulation of the contraction. The C-terminus of cMyBPC binds titin and is necessary to localize MyBPC to the A-band (Figure 4). This interaction also allows MyBPC to possibly work in concert with all of the filament systems during contraction to impact force development, transmission, sensing, and signalling (Henderson et al. 2017).
Introduction
Figure 4: representation of structure and binding of thin and thick filaments proteins
(Figure adapted from Lin et al. 2017).
Titin is the third myofilament system in the sarcomere spanning the length of
the half sarcomere: the N-terminal region anchors to the Z-disk and extends across the I-band and A-band toward the M-line (Figure 3). The elastic I-band region of titin consists of a combination of tandem immunoglobulin domains (Ig), and random coil regions such as the PEVK (Figure 5). The PEVK region consists of approximately 70% proline (P), glutamic acid (E), valine (V), and lysine (K) residues, thus the name. The Ig domains and the random coil regions are crucial extensible sites conferring elasticity to the I-band region of titin. Titin within the A-band is composed of super repeats of seven fibronectin III domains (Fn3) and four Ig domains. This inextensible portion of titin interacts with MyBPC and the myosin tail domains, thus linking titin to the thick filaments. Differential splicing of the single titin gene (TTN) produces titin isoforms of different lengths. In adult cardiac muscle, two different splicing isoforms coexist (N2B and N2BA), which differ in their I-band regions. The N2B is the stiffest and shortest isoform (3.0 MDa), which is characterised by the absence of N2A element. N2BA is the longest isoform (3.3 to 3.5 MDa) and includes both N2A and N2B fragments.
Titin is thought of as a “molecular spring” and is key to the passive mechanical properties of the myofilaments contributing to passive tension during diastolic relaxation (Henderson et al. 2017; Lin et al. 2017).
Physiology Myofilament Proteins in Myocyte Contraction C5 PEVK PEVK N2B N2B C10 C9 C8 C7 C6 C4 C3 C2 M C1 P/A C0 (A) (B) (C) I-band C-zone A-band H-zone M-line C-zone I-band Z-disk Z-disk Myosin Actin Titin T-Cap α-actinin Myosin cMyBP-CC cMyBP-C Tropomyosin Actin Nebulette Troponin T Troponin C Troponin M Myosin Head Myosin Light Chain Myosiyyy n Tail
Figure 1 Structure of sarcomere and myofilament proteins. (A) Actin and myosin overlap at the C-zone in the A-band where 7 to 9 MyBP-C stripes interact with both filaments. Myosin
and MyBP-C are arranged in a ratio of∼ 3:1. Titin spans from Z-disk to M-line. (B) Titin containing N2B and PEVK regions in I-band anchors in Z-disk via T-cap and α-actinin, and it also interacts with actin. (C) C-terminal (C8-C10) cMyBP-C binds to meromyosin and titin, but N-terminal C0 to M regions associate with actin and myosin head.
7, A pri l2 01 7 677
Introduction
Figure 5:schematic structure of Titin containing N2B and PEVK regions. Interactions with thick and thin filaments are also represented (Figure adapted from Lin et al. 2017).
1.1.1 Sarcomere contraction and relaxation
The sarcomeres are responsible for contraction of muscle cells through a process known as excitation-contraction coupling. This process occurs via electrical stimulus linked to mechanical contraction movement. The process starts when an electrical signal, modulated in part by autonomic innervation, induces calcium release. The electrical signal results in an initial inward flux of Ca2+ from voltage-dependent Ca2+ channels, known as dihydropyridine receptors (DHPR). This initial ion flow is detected by ryanodine receptors (RyR2 in the heart), that release Ca2+ stores from the sarcoplasmic reticulum (SR) (Lin et al. 2017). The rising levels of Ca2+ initiate contraction by binding the amino-terminal Ca2+ binding-site of TnC within the Tn complex. The TnC consist of two globular domains (N- and C-terminal domains) connected via an α-helical bridge. The N-terminal region is a regulatory domain, whereas the C-terminal motif has a structural role by anchoring TnC to TnI. The binding of Ca2+ to the N-terminal globular domain partially opens a hydrophobic region of TnC and alters its interaction with TnI, which induces TnI movement. The shift of TnI is transmitted to Tm by TnT. When Ca2+ binds to TnC, TnT disengages from interaction with Tm, allowing Tm to move its position relative to actin, such that its myosin-binding site is exposed (Figure 6) (Dupuis et al. 2016; Lin et al. 2017). During this phase of contraction, myosin heads are in a pre-power stroke conformation in which the myosin binds ADP and Pi. Release of Pi hydrolytic product facilitates myosin head binding at a new position along the actin filament, and a myosin power stroke pulls Z-lines toward each other resulting in sarcomere shortening and muscle contraction. Finally, myosin releases ADP allowing new ATP binding and dissociation of the myosin head from actin. Myosin ATPase then hydrolyzes ATP, prompting the myosin head’s converter domain to change shape. ATP hydrolysis enables the myosin
Physiology Myofilament Proteins in Myocyte Contraction C5 PEVK PEVK N2B N2B C10 C9 C8 C 7 C6 C4 C3 C2 M C1 P/A C0 (A) (B) (C) I-band C-zone A-band H-zone M-line C-zone I-band Z-disk Z-disk Myosin Actin Titin T-Cap α-actinin Myosin cMyBP-CC cMyBP-C Tropomyosin Actin Nebulette Troponin T Troponin C Troponin M Myosin Head Myosin Light Chain Myosiyyy n Tail
Figure 1 Structure of sarcomere and myofilament proteins. (A) Actin and myosin overlap at the C-zone in the A-band where 7 to 9 MyBP-C stripes interact with both filaments. Myosin
and MyBP-C are arranged in a ratio of∼ 3:1. Titin spans from Z-disk to M-line. (B) Titin containing N2B and PEVK regions in I-band anchors in Z-disk via T-cap and α-actinin, and it also
interacts with actin. (C) C-terminal (C8-C10) cMyBP-C binds to meromyosin and titin, but N-terminal C0 to M regions associate with actin and myosin head.
e 7, A pri l2 01 7 677
head to re-adopt a pre-power stroke conformation, so a new ‘cross-bridge cycle’ can be repeated (Garfinkel et al. 2018).
Figure 6: schematic representation of Troponin complex activation. (Left) At rest, the
actin monomer (in red) is blocked by troponin complex. (Right) A conformational change in the Tn complex removes the Tm from the blocking position (Figure adapted from Dupuis et al. 2016).
Muscle contraction is triggered and regulated by calcium levels and Ca2+ -sensor proteins. The calcium regulatory system acts in a length-dependent fashion by which elongated sarcomeres exhibit increased calcium sensitivity. Although the major gatekeeper of the calcium-based regulation is troponin-tropomyosin complex, cMyBPC and titin have been shown to participate in
Ca2+-mediated regulation of contraction. Essentially, cMyBPC
phosphorylation increases myofilament calcium sensitivity and, at short sarcomere lengths, titin reduces the length-dependence of the calcium regulatory system (Figure 7) (Garfinkel et al. 2018).
Figure 7: schematic drawing of the actomyosin cross-bridge cycle. Rest state (1),
transition state (2), active state (3) and active state with loss of bound Ca2+ (4) are represented (Figure adapted from Henderson et al. 2017).
At low myofilament calcium concentrations, tropomyosin blocks the myosin-binding site on actin and results in sarcomere relaxation. Two distinct structures of paired and relaxed myosins have been identified, each associated with different rates of energy consumption (Figure 8). The disordered relaxed (DRX) state occurs when one myosin head interacts with the thick filament backbone, resulting in steric inhibition of its ATPase, whereas its partner myosin retains ATP hydrolysis activity and the potential for actomyosin interactions and force production. The superrelaxed (SRX) state occurs when both myosin heads dock onto the thick filament backbone, inhibiting ATP hydrolysis and withdrawing both myosins from thin filament interaction and force production (Garfinkel et al. 2018).
Figure 14.
Schematic drawing of the cardiac cross-bridge cycle. Thin-filaments are shown with actin, tropomyosin (Tm) and the troponin (Tn) complex with the Ca2+-binding unit (cTnC) in pink, the Tm-binding unit (cTnT) in blue, and the inhibitory unit (cTnI) in light green. Thick-filament cross-bridges (XB) are shown with myosin heavy chain (MHC; figure illustrating one MHC) in red, myosin light chains (LC) in green, along with myosin-binding protein C (MyBP-C) in purple and titin in orange. Cross-bridges are initially in a rest state (1) where they are weakly bound and do not generate force. Cross-bridges enter a transition state (2) determined by the on (kCa) and off rates (kCa-1) for Ca2+ exchange with cTnC. During this transition state, cross-bridges are weakly bound (kXB-1) and do not generate force. In the active state (3), the cTnT-dependent shift of Tm from its blocking position on actin filaments allows strong cross-bridge binding (kXB) and induces cooperative activation of the thin filament (e.g., increase Ca2+ affinity of cTnC; kCa-XB-1). In the active state (4) with loss of bound Ca2+, the cooperative mechanisms allow a population of cross-bridges to remain active and force generating (kCa-XB). Mechanical feedback termed shortening-induced deactivation (kvel) will transition active cross-bridges back to the resting state. [Fig. modified, with permission, from (265).]
Compr Physiol. Author manuscript; available in PMC 2018 April 09.
A uthor Man uscr ipt A uthor Man uscr ipt A uthor Man uscr ipt A uthor Man uscr ipt
Figure 8: representation of sarcomere conformations and associated energy
consumption throughout the cardiac cycle (Figure adapted from Garfinkel et al. 2018).
1.2 Hypertrophic Cardiomyopathy (HCM): definition and clinical manifestations
HCM is the most common inherited cardiovascular disease with an estimated prevalence ranging from 1:500 to 1:200 and the most frequent cause of sudden cardiac death (SCD). The risk of SCD is high in young patients, including athletes, and it may be the first manifestation of the disease (Wijnker et al. 2018).
The clinical manifestations of HCM are highly variable. Many patients are asymptomatic and are diagnosed incidentally, others may manifest shortness of breath, chest pain, palpitations or syncope, triggered by left ventricle hypertrophy (LVH). LVH typically manifests as asymmetric hypertrophy with greatest involvement of the basal interventricular septum subjacent to the aortic valve. At the cellular level, histopathologic study of heart muscle in HCM demonstrates that cardiac myocytes are hypertrophied, disorganized, and separated by areas of interstitial fibrosis (Geske et al. 2018).
Approximately, 5%-10% of patients with HCM progress to end-stage disease with impaired systolic function and dilatation. Atrial fibrillation is present in nearly 1 of 5 patients, accompanied by significant risk of stroke (Sabater-Molina et al. 2018).
1.2.1 Genetics bases of HCM
The first evidence of genetic involvement in Hypertrophic Cardiomyopathy was published in 1989, where a genetic-linkage analyses identified a locus on chromosome 14 that was inherited with hypertrophic cardiomyopathy in over 100 family members (Jarcho et al. 1989). Many genomic studies in the decades following have found that the majority of HCM cases are caused by mutations in sarcomere protein genes that cause HCM in an autosomal dominant pattern. For that reason, Hypertrophic Cardiomyopathy is recognized as a disease of the sarcomere (Ingles et al. 2018).
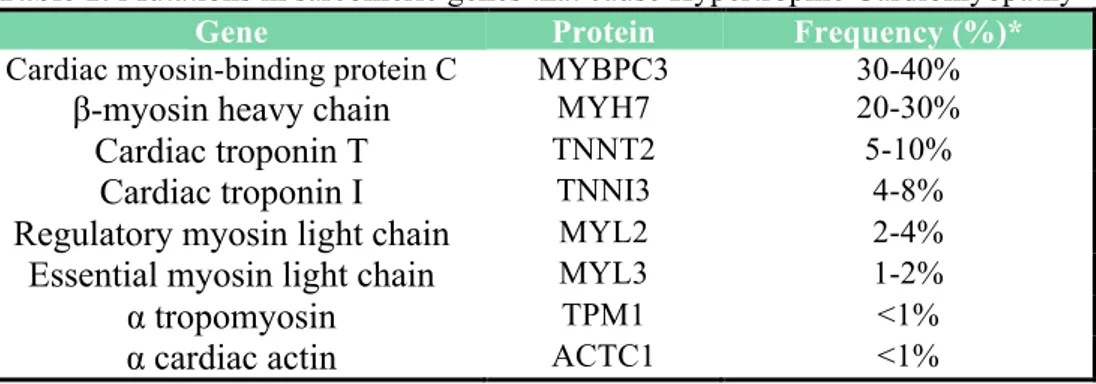
To date, most pathogenic variants detected in HCM patients affect by cardiac myosin-binding protein C (MYBPC3) and β-myosin heavy chain (MYH7) genes, together being responsible for approximately half of the familial HCM cases. Mutations in troponin T, troponin I, and Tm (TNNT2, TNNI3, TPM1) constitute less than 10% of diagnosed HCM cases. Other genes whose mutations cause HCM include MYL2 (myosin light chain 2), MYL3 (myosin light chain 3), and ACTC1 (cardiac α-actin), although with a much lower frequency (1%-5% each) (Table 1) (Liew et al. 2017).
Table 1: Mutations in sarcomeric genes that cause Hypertrophic Cardiomyopathy
Gene Protein Frequency (%)*
Cardiac myosin-binding protein C MYBPC3 30-40%
β-myosin heavy chain MYH7 20-30%
Cardiac troponin T TNNT2 5-10%
Cardiac troponin I TNNI3 4-8%
Regulatory myosin light chain MYL2 2-4%
Essential myosin light chain MYL3 1-2%
α tropomyosin TPM1 <1%
α cardiac actin ACTC1 <1%
*the frequencies refer to Liew et al. 2017
HCM is an inherited disorder with an autosomal dominant pattern characterised by incomplete penetrance and variable expressivity. The variability of the phenotype is due to the causal mutation acting in concert with many other genetic and non-genetic influences. Indeed, the primary defect is the mutation which affect the structure and function of proteins. Although, the phenotype includes also the structural changes and secondary molecular events in the myocardium, such as activation of the hypertrophic signalling pathways, which occur in response to changes in protein (Figure 9) (Marian and Braunwald 2017; Wijnker et al. 2018).
Figure 9: hypothetical pathogenesis of hypertrophic cardiomyopathy. The primary
defect is the mutation in the sarcomere which causes a series of primordial defects. These initial defects activate expression of a series of molecular and cellular changes, which result in histological and morphological changes in the myocardium, such as myocyte hypertrophy and fibrosis. Finally, these changes lead to the clinical phenotypes of HCM, such as cardiac arrhythmias and heart failure.
The initial defects, in accord with the diversity of HCM mutations, are also diverse. The majority of the HCM mutations are missense mutations that alter proteins functions. Missense mutations that impart structural changes in the encoded protein may also reduce efficiency of sarcomere assembly. Another fraction of the HCM mutations result in premature truncation of the encoded proteins because of a gain of a stop codon or a frameshift. These kind of mutations commonly abolish protein expression (Marian and Braunwald 2017).
Such heterogeneity in the expression and incorporation of the mutant proteins at the myocyte level might in part explain the variable phenotypic expression of HCM.
1.2.2 Diagnosis of HCM and the role of genetic testing
The clinical diagnosis of HCM is based on the presence of left ventricular hypertrophy, typically defined by the end-diastolic ventricular septal thickness. Although, in the diagnostic criteria, the European Society of Cardiology guidelines recommend using a left ventricular wall thickness of ≥15 mm, HCM may be diagnosed with a value >13 mm, always occurring in the absence of abnormal loading conditions or other secondary causes. The cut point of 13 mm in adults offers high sensitivity in detecting HCM but has the risk of overdiagnosis (Marian and Braunwald 2017). However, in patient with lesser degrees of wall thickening (13–14 mm), the diagnosis of HCM requires evaluation of other features including family history, non-cardiac symptoms and signs, electrocardiogram abnormalities, multimodality cardiac imaging and genetic testing (Wijnker et al. 2018).
Up to 60% of patients who meet the HCM diagnostic criteria demonstrate a pathogenic sarcomeric mutation on genetic testing. However, the clinical role of genetic testing in HCM largely centers on family screening. If a causative genetic mutation is identified in a proband with HCM, testing for this mutation becomes the preferred method of family screening to facilitate presymptomatic diagnosis of family members, clinical surveillance and reproductive advice (Geske et al. 2018). It is very important to make a correct classification of variants and identification of their pathogenicity and functional relevance for an appropriate use of genetic testing in clinical practice.
Due to the increased complexity of analysis and interpretation of genetic tests, general guidelines for the interpretation of variants have been published (Hershberger et al. 2018). By applying the proposed score, variants can be classified into 5 main groups: pathogenic, likely pathogenic, uncertain significance (VUS), likely benign and benign. The American College of Medical Genetics and Genomics (ACMG) guidelines proposed a process to classify mutation composed by six items. The first one is frequency of variants in control population in international database (Exome Sequencing Project, 1000Genome or ExAc). Then, it. is important to know whether the variant has been reported previously as associated with disease by control disease databases such as Human Gene Mutation Database (HGMD) and ClinVar, or sequence databases like NCBI Genome and RefSeqGene. In silico pathogenicity scores is the third method proposed for the classification. This evaluation can be done using different software (eg, MutationTaster, Polyphen2, SIFT, Pmut, ESEfinder) to predict the potential impact of the variant on protein structure and/or function. The item number four is the evaluation of conservation to determining if the involved nucleotide and amino
acid residue are conserved among species and isoforms and if they are located in a strategic functional domain. However, this evidence needs careful evaluation in the absence of functional study or clinical cosegregation. For that reason, the most important items are the cosegregation studies and functional studies (Hershberger et al. 2018).
When the different criteria fail to produce assignment of pathogenicity, mutations are classifying as VUS. Clinical genetic testing often reports VUS with ambiguous and uncertain pathogenicity. VUS may cause difficult clinical interpretation and risk-assessment that limit counselling and treatment of individuals with unclear genetic predisposition to disease. Therefore, this can cause anxiety and stress in asymptomatic individuals and families who are found to carry a VUS (Ma et al. 2018).
Genetic test in HCM typically involves a minimum of 8 sarcomere genes (MYH7, MYBPC3, TNNT2, TNNI3, TPM1, MYL2, MYL3 and ACTC1), although approximately 80% who test positive have causative variants in MYBPC3 and MYH7. The mutations occurring in most sarcomeric genes are missense-type, with a dominant negative effect resulting in the formation of poison peptides, which can be incorporated into the sarcomere. Protein-truncating variants, which are not incorporated into the sarcomere cause HCM by haploinsufficiency. Most MYBPC3 mutations result in frame shifts and protein truncations (Sabater-Molina et al. 2018).
In this thesis, new mutations in the MYBPC3 gene were found and characterized.
1.3 Cardiac Myosin Binding Protein C (cMyBPC)
G. Offer et al. in 1973 discovered the Myosin Binding Protein C (MyBPC) as an impurity in skeletal muscle myosin preparations (Offer et al. 1973). Only 10 years later the MyBPC was determined and characterized (Yamamoto and Moos 1983).
The cardiac isoform (cMyBPC) is exclusively expressed in the heart resulting from the MYBPC3 gene composed of 34 coding exons (Carrier et al. 2015). cMyBPC is a multi-modular structural protein composed by eight immunoglobulin (Ig) and three fibronectin type-3 repeating domains (Figure
10). cMyBPC differs from its two skeletal isoforms by having a C0 domain, a
proline-alanine-rich (Pro-Ala) region located between domains C0 and C1, a phosphorylatable motif (M-motif), which lies between the C1 and C2 domains, and a small insertion within the C5 domain (Sadayappan and De Tombe 2014).
Figure 10: model of full-length human cardiac MyBP-C including all domains. The
four serine phosphorylation sites on the M domain are indicated with asterisks (Nag et al. 2017).
cMyBPC is arranged in the C-zone of sarcomeres to run vertically through thick and thin filaments. The C-terminal domains of cMyBP-C bind to the light meromyosin (LMM) portion of β-myosin heavy chain and to titin. Residues in the N-terminus can interact with actin, the S1/S2 junction of myosin heavy chain, and the myosin regulatory light chain (RLC). The binding of both actin and myosin allows cMyBPC to perform the function as modulator of contraction and myofilament rigidity (McNamara et al. 2017). Indeed, the absence of cMyBP-C in the effective null mouse models leads to reduced rigor cross-bridge-dependent stiffness and thick filament stiffness (Palmer BM et al. 2011).
Mutations in the MYBPC3 gene represent the 40–50% of all HCM mutations, making it the most frequently mutated gene in this disease. Many MYBPC3 mutations are truncating mutations, including nonsense mutations, nucleotide insertions or deletions and RNA splicing mutations that result in frameshifts, premature termination codons (PTC) and C-terminal truncated polypeptides. The myocardium of patients harboring cMyBPC truncating mutations contains less cMyBPC levels, suggesting that haploinsufficiency may be a pathogenic mechanism in truncating mutations (Van Dijk et al. 2009; Marston et al. 2009).
Indeed, studies with engineered heart tissue provided that contractile function is affected when cMyBPC protein levels are below 73% (Wijnker et al. 2018). In contrast to truncating mutations, missense mutations lead, in most of the cases to stable mutant cMyBPCs that are, at least in part, incorporated into the sarcomere and could act as poison polypeptides on the structure and/or function of the sarcomere (Carrier et al. 2015).
HCM mutations are found in all domains of the protein, also in central domains that do not interact with myosin or actin. This observation has raised the hypothesis that thermodynamic as well as mechanical defects in these domains can result in altered function of cMyBPC. Indeed, missense mutations located in the central domains (C5-C6-C7) and clinically linked to HCM have been identified to interfere with domain folding (Nadvi et al. 2016). Furthermore, single-molecule Atomic Force Microscopy (AFM) data on C3 domains shows altered mechanical behaviour of mutant proteins (Suay-Corredera et al. 2018).
1.4 RNA Splicing mechanism
The removal of introns from pre-mRNA and the joining of exons is a critical aspect of gene expression. Introns are removed from primary transcripts by the process of RNA splicing, which links together the flanking exons to generate functional mature RNA (mRNA) (Papasaikas et al. 2016). The splicing reaction takes place in two catalytic steps involving two consecutive trans-esterification reactions (Figure 11).
two transesterification steps. In the first, the hydroxyl group of an intronic adenosine residue of BPS carries out a nucleophilic attack on the phosphate group in the exon/intron junction of donor splice site, generating a lariat intermediate. In the second step, the free 3’-OH of the 5’-exon attacks the phosphate group in acceptor splice site, splicing the two exons together and releasing the intron lariat.
The exact sites for the trans-esterification reactions are defined by consensus sequences, called donor and acceptor sites. The human donor site (5’-splicing site) is MAG/GURAGU relative to the exon/intron junction (M is A or C; R is purine). In mammals only the first two bases of the intron (GU) are universally conserved. The acceptor consensus sequence at the 3’-splice site is defined by three separate elements: the branch site (BPS), the polypyrimidine tract (PPT), and the intron dinucleotide AG. Together these elements extend 100 nucleotides into the intron (Buratti et al. 2007).
The splicing reaction takes place in the spliceosome, which is formed by several uridine-rich small ribonucleoproteins (UsnRNP), and numerous non- snRNP splicing factors. These proteins excise each intron and join exons in the correct order through a multitude of RNA-RNA, RNA-protein, and protein-protein interactions (Baralle and Baralle 2005).
The most common consequences of splicing mutations are skipping of one or more exons and/or full intron retention (Tazi et al. 2009, Xiong et al. 2015). The mutations that cause splicing alterations involve disruption of native splicing sites and/or activation of aberrant 5’-donor and/or 3’-acceptor splice sites.
2. AIMS
Hypertrophic cardiomyopathy (HCM) is a genetic disorder, characterized by left ventricular hypertrophy in the absence of triggers such as hypertension. HCM is the most common inherited cardiovascular disease with an estimated prevalence ranging from 1:500 to 1:200. The genetic defects leading to HCM usually involve sarcomere disruption. The most frequently mutated HCM gene is MYBPC3, encoding cardiac myosin-binding protein C (cMyBPC).
In genetic screens of hereditary disorders, several different types of variants can be found: pathogenic mutations, benign polymorphisms and variants of uncertain significance (VUS). VUS are an ambiguous category of variants whose effects remain unclear, and therefore do not have a clinical value. According to the American College of Medical Genetics and Genomics (ACMG), in the absence of enough genetic support, functional studies are the most important criterion to establish causality of putative disease-causing mutations (Hershberger et al. 2018).
In order to understand the pathogenic basis of Hypertrophic Cardiomyopathy, to improve characterization of VUS and, finally, to improve molecular diagnosis, the evaluation of pathogenic effects by in vitro analysis can be helpful for interpretation of variants. In this context, the global aims of this project are:
1. Genotyping HCM patients to describe variants in proteins of the sarcomere that are associated with HCM.
2. Describing new variants in MYBPC3 that can cause HCM.
3. Integrating cosegregation analysis and functional assessment of MYBPC3 variants associated with HCM to refine assignment of pathogenicity.
3. MATERIALS AND METHODS
3.1 Materials3.1.1 Mammalian Cell culture
Human embryonic kidney 293 cell line (HEK-293) was used for Minigene transfection and RNA analyses. HEK-293 cells were grown as a monolayer in Dulbecco’s modified eagle medium supplemented with 10% FBS, 2 mM L-glutamine and 1% penicillin/streptomycin in a humidified, 5% CO2 atmosphere at 37°C.
To transfect pMG plasmid, the cells were plated 1 day before transfection onto 60mm plates at a density of approximately 5x10⁵ cells/plate, in a 4ml of final volume of complete medium, in order to be 60-70% confluent the following day.
3.1.2 Bacteria: conservation and manipulation
Chemically Competent Escherichia coli cells were used for cloning, plasmid propagation and protein expression. Competent bacteria were prepared using calcium chloride protocol (J. F. Sambrook and D.W. Russell 2001). In short, a single colony of E. coli from fresh LB-plate without antibiotics, was pre-inoculated in 5ml of LB medium and incubated overnight, shaking at 37°C. Then, the starter culture of bacteria was inoculated in 100ml of LB medium and grown at 37°C. When the optical density at 600 nm (OD600) reached 0.4, the cells were immediately put on ice. The bacteria culture was split into four parts, centrifuged at 4°C, resuspended in 20ml of ice-cold 50mM CaCl2 each and left on ice for at least 40 minutes. Next, the cells were harvested by centrifugation at 2000g at 4°C. The pellet was resuspended in about 2 mL of ice cold 50mM CaCl2 including 20% glycerol. The suspension was divided in 200µL aliquot into sterile 1.5 mL tubes and stored at -80°C.
Top10 (Invitrogen™) and BLR (DE3) (Novagen-Merck Millipore) strains of
E. coli were used in this thesis.
TOP10 are provided at a transformation efficiency of 1×10⁹ cfu/µg supercoiled DNA and are ideal for high efficiency cloning and plasmid propagation. They allow stable replication of high-copy number plasmids.
Genotype: F- mcrA Δ(mrr-hsdRMS-mcrBC) φ80lacZΔM15 ΔlacX74 recA1
28
BLR (DE3) is a recA- derivative of BL21 that improves plasmid monomer yields and can help stabilize target plasmids containing repetitive sequences. DE3 indicates that the host is a lysogen of λDE3, and therefore carries a chromosomal copy of the T7 RNA polymerase gene under control of the
lacUV5 promoter. Such strains are suitable for production of protein from
target genes cloned in vectors by induction with Isopropyl β-D-1-thiogalactopyranoside (IPTG).
Genotype: F- ompT hsdSB(rB- mB-) gal lac ile dcm Δ(srl-recA)306::Tn10 (tetR)(DE3).
3.1.3 Plasmid constructs
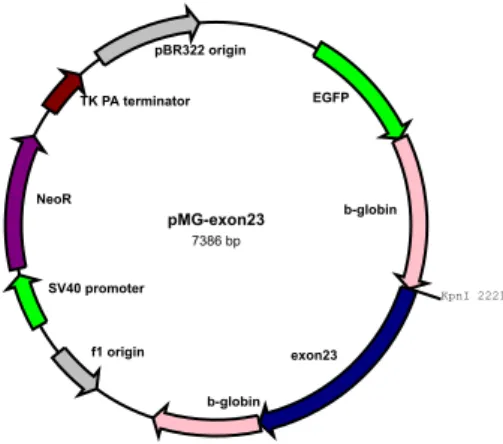
To study the effect of genetic variants on splicing pattern, a minigene construct (pMG) was used. This plasmid results from introducing some modifications to pEGFP-C3 vector (Amato et al. 2012). The artificial minigene contains the human ß-globin gene fragment amplified from genomic DNA of the HEK293 cell line. A KpnI restriction site was inserted in the middle of the second intron of the ß-globin gene and was used to clone genomic DNA fragments for splicing studies. The graphic representation of minigene including exon 23 of MYBPC3 is shown in Figure 11.
Figure 11: graphic representation of the minigene construct with MYBPC3 exon 23
insert (pMG-exon23). The sequences related to ß-globin include exon 1, exon2, exon 3 and related intron sequences; whereas for MYBPC3 the exon 23 together with its flanking regions were cloned between exon 2 and exon 3 of the ß-globin.
The proteins used for biophysical characterization were engineered and expressed using pT7 and pQE80L plasmids, respectively (Figure 12 A, B). Expression of proteins from pQE80L results in the addition of a His-tag at the N-terminus of the proteins, and a Cys-tag at the C-terminus. In order to avoid
24/9/2018 rf-cloning.org/cgi-bin/savvy.cgi pMGexon23 7386 bp KpnI 2221 NeoR EGFP pBR322 origin SV40 promoter f1 origin TK PA terminator bglobin bglobin exon23
C-terminal cysteines, pQE80L was modified for the cloning of monomer proteins.
Figure 12: plasmids used for proteins engineerin and expression. Graphic
representation of pT7 (A) and pQE80L (B) including a fragment codified for the C4 domain of cMyBPC.
3.1.4 Primers
The primers were designed using Primer3 tool (http://primer3.ut.ee/). The specification of primers for input PCR template was evaluated with Blat tool from UCSC Genome Browser, analysing multisequence alignments. The quality was evaluated with OligoAnalyzer Tool from IDT-Integrated DNA technologies.
In the Table 2 the primers used and their sequence are summarized. Table 2: List of primers
Primer name Tail Sequence Primer Sequence (5’-3’)
MYBPC3-ex3-4 Fw --- CAAGTCCCAAAGGGTCAAGCTC
MYBPC3-ex6 Rv --- GTGGACACCTCACAGCGGTA
MYBPC3-ex23 Fw CGGGGTACC CCTGGCTCCCTTCATCCTA
MYBPC3-ex23 Rv CGGGGTACC CACCCCCAGATCCAAAGAG
GFP Fwd --- ACGACGGCAACTACAAGACC
β-globin Rv --- CACACCAGCCACCACTTTC
MYBPC3-ex15 Fw --- CAAGCGTACCCTGACCATCA
MYBPC3-ex20-21 Rv --- GGATCTTGGGAGGTTCCTGC
MYBPC3-ex22-23 Rv --- CACACAGCAGCTTCTTGTCA
cMyBPC C4 Fw CGCGGATCC AAGCTGGAGGTGTACCAGAGCAT
cMyBPC C4 Rv ATAGGTACCTTAGCAACAAGATCT CTCCATGAAGTGGAGCTTGGCTG
cMyBPC C4 I603M Fw --- GTCCACAAACTGACCATGGACGA CGTCACACCT 24/9/2018 rf-cloning.org/cgi-bin/savvy.cgi http://rf-cloning.org/cgi-bin/savvy.cgi 1/1 pT7 2899 bp KpnI 119 BglII 104 BamHI 98 AmpR pBR322 origin f1 origin lac promoter AmpR promoter 24/9/2018 rf-cloning.org/cgi-bin/savvy.cgi http://rf-cloning.org/cgi-bin/savvy.cgi 1/1 pQE80LdomainC4 5018 bp KpnI 429 BglII 420 BamHI 144 lacIq Repressor AmpR ChloramR pBR322 origin domainC4 A B
The primers used for splicing analyses using mRNA from peripheral blood are designed to recognise exon sequences of MYBPC3. The forward primer (MYBPC3-ex3-4 Fw) anneals with the end region of exon 3 and initial sequence of exon 4. The MYBPC3-ex6 Rv recognises the exon 6 of MYBPC3. MYBPC3-ex23 Fw and MYBPC3-ex23 Rv were used to generate the insert of pMG vector. These primers carried a tail region that includes the sequence of KpnI restriction site (GGTACC) The oligonucleotides GFP Fwd and β-globin Rv were designed to amplify by RT-PCR and sequence the mRNA product in Minigene experiments, and anneal with the GFP sequence and the exon 3 of β-globin, respectively. The MYBPC3-ex15 Fw, MYBPC3-ex20-21 Rv and MYBPC3-ex22-23 Rv oligonucleotides anneal with exon 15 of MYBPC3, the region between exon 20 and exon 21, and the sequence straddling exons 22 and 23, respectively. To generate cDNA cloning for the C4 domain, the primers cMyBPC C4 Fw and cMyBPC C4 Rv were used. The Forward primer is complementary to exon 18 of MYBPC3 and carries a tail region with one BamHI restriction site (GGATCC). The reverse primer carries a tail region including KpnI and BglII (AGATCT) restriction sites, codons introducing two extra cysteines (GCAACA, the reverse and complentary sequence of TGT TGC) and a stop codon (TTA, reverse and complementary of TAA). The sequence of cMyBPC C4 Rv anneals with exon 19 of MYBPC3. Finally, the cMyBPC C4 I603M Fw was designed to introduce the mutation I603M in the domain C4.
3.2 Methods
3.2.1 General Molecular Biology
Standard molecular biology techniques (digestion, ligation, agarose electrophoresis, PCR, etc.) were performed according to standard protocols (J. F. Sambrook and D.W. Russell 2001).
3.2.2 Screening of HCM patients
Genomic DNA was isolated from peripheral whole blood with the Nucleon BACC2 kit (GE Healthcare, Life Sciences, Little Chalfont Buckinghamshire, UK). All coding exons, and 5′ and 3′ UTRs of genes involved in inherited cardiomyopathies associated to sudden death were amplified by PCR and analysed by automatic sequencing using previously reported protocols (F. Girolami et al. 2018). Thirty out of 249 patients were analysed using Next Generation Sequencing methodology for a large number of target genes. Informed consent to perform genetic analysis was obtained from patients according to the Helsinki Declaration. The nomenclatures are indicated
following HGVS recommendations for the descriptions of sequence variants (den Dunnen et al. 2016).
3.2.3 Bioinformatics assessment of mutations
Alamut software (Alamut® Visual, Interactive Biosoftware)was used for in silico prediction of splice-affecting nucleotide variants (Houdayer 2011). Genomic sequences (WT and mutant) were processed by this predictor software using five splicing prediction tools (SpliceSiteFinder-like, MaxEntScan, Neural Network Splice, GeneSplicer, and Human Splicing Finder). Each tool is based on different algorithms: SpliceSiteFinder-like uses position weight matrices computed from a set of human constitutive exon/intron junctions for donor and acceptor sites; MaxEntScan and
NNPLICE are based on the Maximum Entropy principle and neural networks,
respectively. GeneSplicer combines several splice site detection techniques, namely Markov models; and HSF is based on position weight matrices with some position-dependent logic.
Missense mutation at the protein level were evaluated with three independent bioinformatics tools which predict possible impact of amino acid substitutions on the structure and function of the protein (PolyPhen-2, SIFT, Provean).
PolyPhen-2 (Polymorphism Phenotyping v2) evaluates the impact of amino
acid allelic variants via analysis of multiple sequence alignments and protein 3D-structures (Adzhubei et al. 2015). SIFT (Sorting Intolerant From Tolerant) presumes that important amino acids will be conserved in the protein family, so changes at well-conserved positions tend to be predicted as deleterious (Ng and Henikoff 2003). PROVEAN (Protein Variation Effect Analyzer) is a software tool which predicts whether an amino acid substitution has an impact on the biological function of a protein using pairwise sequence alignment scores (Choi and Chan 2015).
3.2.4 Homology modelling for protein structure
For modelling of cMyBPC’s C4 domain, the protein sequence Q14896 from the UniProt database was used. The structure was modelled using I-TASSER tool using slow-MyBPC (2YUZ PDB) as template. I-TASSER (Iterative Threading ASSEmbly Refinement) is a hierarchical approach to protein structure and function prediction (Zhang 2008). It first identifies structural templates from the PDB by the multiple threading approach LOMETS. Then, full-length atomic models are constructed by iterative template fragment assembly simulations. PyMol software was used for molecular representation (DeLano 2002).
3.2.5 Splicing Analysis of mRNA from peripheral blood
Total RNA was extracted from 5-10 mL of patients’ peripheral blood. Five volumes of 0.2% NaCl was added in order to lyse red blood cells and isolate a pellet that includes lymphocyte cells. Then, the RNA was isolated from this peleet using Trizol Reagent (Thermo Fischer Scientific, Waltham, MA, USA). RNA retro-transcription was performed by SuperScript VILO (Life Technologies) starting from 1µg of total RNA and using random primers. The cDNA obtained was amplified using specific consecutive-exon-spanning primers (Table 2). The same primers were used for sequencing of PCR fragment. Sequence was aligned with reference and analysed with CodonCode Aligner software (CodonCode Corporation, Dedham, MA, USA).
3.2.6 RNA Splicing Analysis by Minigene strategy
3.2.6.1 Insert Generation
Genomic DNA of patient carrying MYBPC3-c.2308+3G>C mutation was isolated from peripheral whole blood with the Nucleon BACC2 kit (GE Healthcare, Life Sciences, Little Chalfont Buckinghamshire, UK). The genomic regions affected by non-coding mutations were amplified by PCR using PCR Master Mix (Promega, Madison, WI, USA). The sizes of inserts obtained by PCR were approximately 1000 base pairs. The PCR amplicons contained the exon 23 and the 5′ and 3′ intronic flanking regions. The primers contained a KpnI restriction sequence at the 5′ terminus (Table 2). The PCR product was cloned in TOPO TA (Invitrogen™) amplification vector. The resulting E. coli colonies grown in LB plate with Ampicilin were used for mini-prep purification of plasmid DNA (QUIAGEN). The TOPO TA positive plasmids were Sanger-sequenced for insert verification. Since the patient was heterozygote both WT and 2308+3G>C fragments were obtained in the same cloning.
3.2.6.2. Minigene Plasmid Construction, Expression, and Transcript Analysis
The TOPO TA WT and mutated vectors and pMGgene vector were digested with the KpnI restriction enzyme (Gaildrat et al. 2010; Amato et al. 2012). The open pMGene vector was then dephosphorylated. The digested inserts were then cloned into the pMGene vector using the LigaFast Rapid DNA Ligation System (Promega). Top10 E. coli competent cells were transformed and grown in selective LB plate with Kanamicin. All clones were sequenced, and theWT and mutated forms were selected for expression experiments.
HEK-293 cells were transiently transfected with FuGene®HD (Promega) according to the manufacturer’s instructions, using 2µg of WT or mutated pMGene and 3µl of FuGene®HD transfection reagent in 100µl absolute DMEM medium without FBS. After six hours the medium of cells was substituted with complete DMEM. Forty-eight hours after transfection cells were collected and RNA was extracted by Trizol Reagent (Life Technologies). RNA retrotranscription was performed by SuperScript VILO (Life Technologies) starting from 1µg of total RNA and using random primers. The cDNA obtained was amplified with GFP Fw and β-globin Rv primers. Since the forward primer annealed in the GFP-coding region, only located in the transcripts derived from the plasmid construct, the PCR did not select endogenous β-globin or MYBPC3 transcripts. The amplification products were analysed by Sanger sequencing.
3.2.7 Biophysical characterization of proteins 3.2.7.1 Protein expression and purification
The C4 domain sequence used to generate recombinant proteins and heteropolyproteins, corresponds to entry Q14896 (MYBPC3_HUMAN) of the UniProt databases.
The cDNA fragment including exons 18 and exon 19 of MYBPC3, was amplified from cardiac RNA with cMyBPC C4 Fw and cMyBPC C4 Rv oligonucleotides (see primers section). The primers were designed to clone just the coding sequence and to introduce BamHI, KpnI and BglII restriction sites. The PCR fragment was ligated into pT7 vector after digestion with BamHI and KpnI. Polymerase chain reaction-based site-directed mutagenesis was used with cMyBPC C4 I603M Fw internal primer to introduce the mutation I603M.
Production of monomeric proteins for thermodynamic analysis. The
pT7-C4 WT and pT7-pT7-C4 I603M were digested using BamHI and BglII and the fragments were cloned into modified pQE80L expression vector. Expression plasmids were verified by Sanger sequencing. The resulting constructs, denoted as His6-C4 WT and His6-C4 I603M, encode the WT C4 domain and C4 I603M of cMyBP-C with an N- terminal hexahistidine affinity tag. Full protein sequences are reported in Table 3.
Table 3: amino acid sequences of C4 monomers
Protein Sequence # aa Extinction
coefficients cMyBPC C4 WT MRGSHHHHHHGSKLEVYQSIADLMVG AKDQAVFKCEVSDENVRGVWLKNGK ELVPDSRIKVSHIGRVHKLTIDDVTPAD EADYSFVPEGFACNLSAKLHFMERS 104 0.736 g/L cMyBPC C4 I603M MRGSHHHHHHGSKLEVYQSIADLMVG AKDQAVFKCEVSDENVRGVWLKNGK ELVPDSRIKVSHIGRVHKLTMDDVTPA DEADYSFVPEGFACNLSAKLHFMERS 104 0.724 g/L
Proteins were expressed in BLR (DE3) E. coli strain. Fresh cultures were grown at 37 °C to an OD600 of 0.6-1.0 and induced with 1mM IPTG. After 3 hours of induction at 37ºC and 250 rpm, C4 WT cultures were harvested. In the case of the C4 I603M, optimal expression was obtained by induction overnight at 14°C and 250 rpm. Cells were lysed by a combination of tip sonication and passes through a French Press. Proteins were purified from the soluble fraction using Ni-NTA agarose chromatography (Qiagen) with a column volume of 3 mL and pre-equilibrated with phosphate buffer (50 mM sodium phosphate pH 7 and 300 mM NaCl) supplemented with 10 mM DTT. Elution was performed in two steps with increasing imidazole concentration (from 20mM to 250mM). Further purification was achieved by size-exclusion chromatography in an AKTA Pure 25L system using a Superdex 200 Increase 10/300 GL column (GE Healthcare). The proteins were eluted in phosphate buffer, which is also the buffer used in circular dichroism (CD) and differential scanning calorimetry (DSC) experiments. The eluent was monitored by ultraviolet absorbance at 280nm. Concentrations of purified proteins were determined using theoretical extinction coefficients as estimated by the ProtParam tool (Table 3). Purity of samples was evaluated using SDS-PAGE.
Production of polyproteins for single-molecule experiments. To analyse the
mechanical stability of C4 domain, heteropolyproteins were generated with two different markers, Protein-L and Sumo1 (Sadler et al. 2009; Kotamarthi et al. 2013)(Figure 13). Starting from pT7-C4 WT and pT-C4 I603M, the heteropolyproteins were generated with directional DNA concatemerization by self-ligation of the sticky ends of BamHI and BglI restriction sites (Alegre-Cebollada et al. 2010). Final cDNAs were inserted in the pQE80L expression plasmid using BamHI and KpnI and the resulting plasmids were verified by Sanger sequencing.
C4domain Protein-L Sumo1
Figure 13: schematic representations of (C4-L)4 and (C4-Sumo1)4 heteropolyproteins.
The heteropolyproteins were expressed in BLR (DE3) E. coli cells. Fresh cultures (OD600 = 0.6-1.0) were induced with 1mM IPTG for 3 hours at 37ºC and at 250 rpm. Purification was achieved following the same procedure as for monomers (see above). The buffer used for the size-exclusion chromatography was 10 mM Hepes, pH 7.2, 150 mM NaCl, 1 mM EDTA, which is the same one used in AFM experiments. The eluent was monitored by the ultraviolet absorbance at 280nm. Then, the proteins fractions concentrations were determined using predicted extinction coefficients (ProtParam) and their purity was evaluated using SDS-PAGE gels.
3.2.7.2 Circular Dichroism (CD)
CD is defined as the unequal absorption of left-handed and right-handed circularly polarized light. The difference in absorbance of clockwise (ER) and counterclockwise (EL) polarized light is reported in units of ΔE, or in degrees ellipticity, defined as the angle whose tangent is the ratio of the minor to the major axis of the ellipse (Greenfield 2006). In particular, the CD data are reported as molar ellipticity 𝜃 in units of 𝑑𝑒𝑔 ∙ 𝑐𝑚)∙ 𝑑𝑚𝑜𝑙,-.
CD spectra of cMyBPC domain C4 were collected for both the WT and I603M C4 samples with a Jasco-810 spectropolarimeter. The temperature was controlled using a Peltier thermoelectric system.
Purified proteins in phosphate buffer (20 mM sodium phosphate pH 6.5 and 50 mM NaCl) were loaded into a 0.1cm or 1cm path-length quartz cuvettes for data collection from far-UV (195-250nm) and near-UV (250-350nm) respectively. The proteins were analysed at concentration of 0.3 and 1 mg/mL for far-UV and near-UV respectively. Spectra were collected for the protein samples and buffer control at 25°C and 85°C with four accumulations of data. The parameters set for CD measurements are summarised in Table 4. The
buffer baseline spectrum was subtracted from each protein spectrum at each corresponding temperature to correct for the background signal.
Table 4: parameters used to measure the spectrum collection from far-UV (195-250nm) and near-UV (250-350nm)
Thermal denaturation analyses were carried out collecting the variations of ellipticity at 205nm and 230nm as a function of temperature (25°C-85°C). The thermal renaturation was also analysed with a temperature ramp-down (85°C-25°C).The spectrum measurement parameters are summarised in Table 5. Table 5: parameters of thermal denaturation analysed at 215nm or 230nm
Variable Temperature measurement
Wavelength 215/230nm Start temperature 25ºC End temperature 85ºC Data pitch 0.5 ºC Delay Time 0 Temperature Slope 30°C/h
Protein unfolding was plotted versus temperature and the data points were fit with a Boltzmann sigmoidal curve using Igor Pro software to obtain midpoint unfolding temperatures (Tm) for WT and I603M C4 domain. The changes in CD as a function of temperature, at characteristic wavelengths, can be used to determine the van't Hoff enthalpy (ΔHv) of unfolding (Greenfield 2007). To fit the change of CD at a single wavelength as a function of temperature, the Gibbs-Helmholtz equation was used considering a two-state process:
ΔG= ΔH (1-T/Tm)- ΔCp((Tm-T)+Tln(T/Tm)) Spectrum Measurement
Start wavelength 250/350nm End wavelength 195/250nm
Data pitch 0.2nm
Scanning mode continuous Scanning speed 50nm/min
response 1sec
Band width 1