www.nat-hazards-earth-syst-sci.net/12/3151/2012/ doi:10.5194/nhess-12-3151-2012
© Author(s) 2012. CC Attribution 3.0 License.
and Earth
System Sciences
Quaternary active tectonic structures in the offshore Bajo Segura
basin (SE Iberian Peninsula – Mediterranean Sea)
H. Perea1,2, E. Gr`acia2, P. Alfaro3, R. Bartolom´e2, C. Lo Iacono2, X. Moreno2, E. Masana4, and
EVENT-SHELF Team*
1LATTEX – IDL, GeoFCUL, Universidade de Lisboa, Ed.C6, Campo Grande 1749-016 Lisbon, Portugal
2Unitat de Tecnologia Marina – CSIC, Centre Mediterrani d’Investigacions Marines i Ambientals, Psg. Mar´ıtim de la Barceloneta, 37–49, 08003, Barcelona, Spain
3Dept. de Ciencias de la Tierra y del Medio Ambiente, Universidad de Alicante, Apdo. 99, 03080 Alicante, Spain 4RISKNAT, Dept. Geodin`amica i Geof´ısica, Universitat de Barcelona, Mart´ı Franqu´es, s/n, 08028 Barcelona, Spain *M. Farran (ICM-CSIC), E. Andara (IGME), S. P´erez and M. Rom´an Alpiste (UG)
Correspondence to: H. Perea ([email protected])
Received: 23 March 2012 – Revised: 19 July 2012 – Accepted: 6 August 2012 – Published: 23 October 2012
Abstract. The Bajo Segura fault zone (BSFZ) is the
north-ern terminal splay of the Eastnorth-ern Betic shear zone (EBSZ), a large left-lateral strike-slip fault system of sigmoid geom-etry stretching more than 450 km from Alicante to Almer´ıa. The BSFZ extends from the onshore Bajo Segura basin fur-ther into the Mediterranean Sea and shows a moderate instru-mental seismic activity characterized by small earthquakes. Nevertheless, the zone was affected by large historical quakes of which the largest was the 1829 Torrevieja earth-quake (IEMS98X). The onshore area of the BSFZ is marked by active transpressive structures (faults and folds), whereas the offshore area has been scarcely explored from the tec-tonic point of view. During the EVENT-SHELF cruise, a to-tal of 10 high-resolution single-channel seismic sparker pro-files were obtained along and across the offshore Bajo Segura basin. Analysis of these profiles resulted in (a) the identi-fication of 6 Quaternary seismo-stratigraphic units bounded by five horizons corresponding to regional erosional surfaces related to global sea level lowstands; and (b) the mapping of the active sub-seafloor structures and their correlation with those described onshore. Moreover, the results suggest that the Bajo Segura blind thrust fault or the Torrevieja left-lateral strike-slip fault, with prolongation offshore, could be consid-ered as the source of the 1829 Torrevieja earthquake. These data improve our understanding of present deformation along the BSFZ and provide new insights into the seismic hazard in the area.
1 Introduction
The present-day crustal deformation of the southeastern Iberian margin is driven mainly by the NW–SE convergence (4–5 mm yr−1) between the African and Eurasian plates (Ar-gus et al., 1989; DeMets et al., 1990; Serpelloni et al., 2007; Vernant et al., 2010; Koulali et al., 2011). This con-vergence is accommodated over a wide deformation zone with significant seismic activity south of the Iberian Penin-sula (Buforn et al., 1995; Grimison and Cheng, 1986; Morel and Meghraoui, 1996). In the southeastern Iberian margin (Fig. 1), the Neogene and Quaternary faulting activity is dominated by a large left-lateral strike-slip fault system of sigmoid geometry known as the Eastern Betic Shear Zone (EBSZ) (De Larouzi`ere et al., 1988; Silva et al., 1993). The EBSZ stretches more than 450 km from Alicante to Almer´ıa, and includes, from north to south, the Bajo Segura, Carras-coy, Alhama de Murcia, Palomares and Carboneras faults (e.g. Bousquet, 1979; Silva et al., 1993). Instrumental seis-micity is mainly characterized by low to moderate magnitude events. Nevertheless, historically, major destructive events such as the 1522 Almer´ıa (IEMS98IX), the 1829 Torrevieja (IEMS98IX-X) and the 1910 Adra (IEMS98VIII) earthquakes occurred in the area (IGN, 2011).
In this paper, we focus on the northern termination of the EBSZ, the Bajo Segura fault zone (BSFZ). This area is marked by moderate instrumental seismic activity and low magnitude earthquakes (Figs. 1 and 2). Nevertheless, this
( ( ( ( ( ( ( ( ( ( ( ( ( ( ( ( ( ( ( ( ( ( ( ( ( ( ( ( ( ( ( ( ( ( ( ( ( ( ( ( ( ( ( ( ( ( (( ( ( ( ( ( ( " " " " " " ! ! ! ! ! ! ! ! ! ! ! ! ! ! ! ! ! ! ! ! ! ! ! ! ! ! ! ! ! ! ! ! ! ! ! ! ! ! ! ! ! ! ! ! ! ! ! ! ! ! ! ! ! ! ! ! ! ! ! ! ! ! ! ! ! ! ! ! ! ! ! ! ! ! ! ! ! ! ! ! ! ! ! ! ! ! ! ! ! ! ! ! ! ! ! ! ! ! ! ! ! ! ! ! ! ! ! ! ! ! ! ! ! ! ! ! ! ! ! ! ! ! ! ! ! ! ! ! ! ! ! ! ! ! ! ! ! ! ! ! ! ! ! ! ! ! ! ! ! ! ! ! ! ! ! ! ! ! ! ! ! !! ! ! ! ! ! ! ! ! ! ! ! ! ! ! ! ! ! ! ! ! ! ! ! ! ! ! ! ! ! ! ! ! ! ! ! ! ! ! ! ! ! ! ! ! ! ! ! ! ! ! ! ! ! ! ! ! ! ! ! ! ! ! ! ! ! ! ! ! ! ! ! ! ! ! ! ! ! ! ! ! ! ! ! ! ! ! ! ! ! ! ! ! ! ! ! ! ! ! ! ! ! ! ! ! ! ! ! ! ! ! ! ! ! ! ! ! ! ! ! ! ! ! ! ! ! ! ! ! ! ! ! ! ! ! ! ! !
^
_
^
_
^
_
^
_
^
_
^
_
^
_
^
_
^
_
^
_
^
_
^
_
^
_
^
_
^
_
^
_
^
_
CRF CBF AMF PF CAF CAFZ BSFZ -1000 -2000 -2000 Lorca Almería Alicante Cartagena Torrevieja 0°30'W 1°0'W 1°30'W 2°0'W 2°30'W 38°0'N 37°30'N 37°0'N 36°30'N 0° 5° W 40° N±
0 10 20 40 60 80 Kilometers ! Earthquake with magnitude ≥ 4.0Fault Inferred fault Left Lateral Strike-slip Right Lateral Strike-slip (
( Thrust
^
_
Earthquake with intensity ≥ VIII Neogene-Quaternary basins Neogene volcanics External Zones Malaguide complex Alpujarride complex Nevado-Filabride complex Figure 2Figure 1
Fig. 1. Regional bathymetric (contour interval 250 m) and simplified geological map (Sanz de Galdeano et al., 1995) of the southeastern
Iberian margin with historical (gray stars) and instrumental (black dots) seismicity (IGN, 2011). Fault kinematics refers to Upper Neogene. BSFZ: Bajo Segura fault zone; CRF: Crevillente fault; AMF: Alhama de Murcia fault; PF: Palomares fault; CAFZ: Corredor de las Alpujarras fault zone; CBF: Carboneras fault; CAF: Carrascoy fault. The black outlined rectangle shows the study area corresponding to Fig. 2. Inset: Iberian Peninsula map, where the black outlined rectangle corresponds to the area depicted in this figure.
zone has been affected by moderate to large historical quakes of which the largest is the 1829 Torrevieja earth-quake (IEMS98IX–X) (L´opez Marinas, 1976; Mezcua, 1982; Rodr´ıguez de la Torre, 1984; Mu˜noz et al., 1984; Albini and Rodr´ıguez de la Torre, 2001; Mart´ınez Solares and Mezcua, 2002). The onshore portion of the BSFZ comprises active faults and folds resulting from the transpressive setting es-tablished in the Plio-Pleistocene (Montenat, 1977; Taboada et al., 1993; Silva et al., 1993; Alfaro et al., 2002a, b, 2012). By contrast, the offshore area is almost devoid of tectonic data (Alfaro et al., 2002b).
In September 2008, using high-resolution single chan-nel seismic (SCS) sparker system, the marine geophysical EVENT-SHELF cruise sought to obtain images of the sub-seafloor structures in the offshore area of the EBSZ to be integrated with the onshore data to better understand the
re-cent faulting history of the SE Iberian margin and character-ize its seismic potential. The specific objectives in the BSFZ were (a) to identify the main seismo-stratigraphic units of the area and localize the main tectonic structures in the off-shore basin; (b) to correlate the offoff-shore structures with the well-known onshore structures; (c) to determine which struc-tures have been active during the Quaternary and are poten-tial sources of future earthquakes; and (d) to consider the pos-sibility that an offshore structure could be the source that pro-duced the 1829 Torrevieja earthquake. The lack of offshore data is a common problem in coastal areas and particularly in the Mediterranean. This work shows how critical the integra-tion of onshore and offshore data is to a better understand-ing and characterization of the seismic potential of the active faults located in these areas.
( ( ( ( ( ( ( ( ( ( ( ( ( ( ( ( ( ( ( ( ( ( ( ( ( ( ( ( ( ( ( ( ( ( F F F M F F F M M F M M M M F M F F F F M M ( ( ( ( ( ( ( ( ! A
^
_
^
_
^
_
^
_
^
_
" " " " " " " -500 S-81B -09A S-81B -07A S-81 B-12 S-81B-06 S-81B -09B S-81B -11A S-81B-14 B S-81 B-04 S-81 B-02 S-81B-10 A S-81B -05A S-81B-08 S-81B-16 B S-81B -13A S-81 B-10B EV S-26 EV S-27 EV S-25 EV S-24 EVS-32 EV S-29 EVS-28A EVS-28 EVS-30 EV S-31 B EV S-23 EV S-31 TORREVIEJA MARINA C-1 Orihuela Torrevieja Santa Pola Crivillente Guardamar de SeguraSan Miguel de Salinas
El Pilar de la Foradada 0°20'W 0°30'W 0°40'W 0°50'W 38°10'N 38°0'N Historical earthquakes
^
_
Intensity IX-X^
_
Intensity VIIIInstrumental earthquakes (magnitude)
< 4.0 4.0 - 4.5 > 4.5 0 2 4 8 12 16 km
±
Geology Holocene Holocene (Alluvial fan) Holocene (Colluvium) Late Pliocene and Pleistocene Early PlioceneLate Miocene
Basement (Betic Internal Zone)
Structures
F
AnticlineF
Inferred anticlineM
Syncline ( ( Thrust Strike-slip faultFigure 2
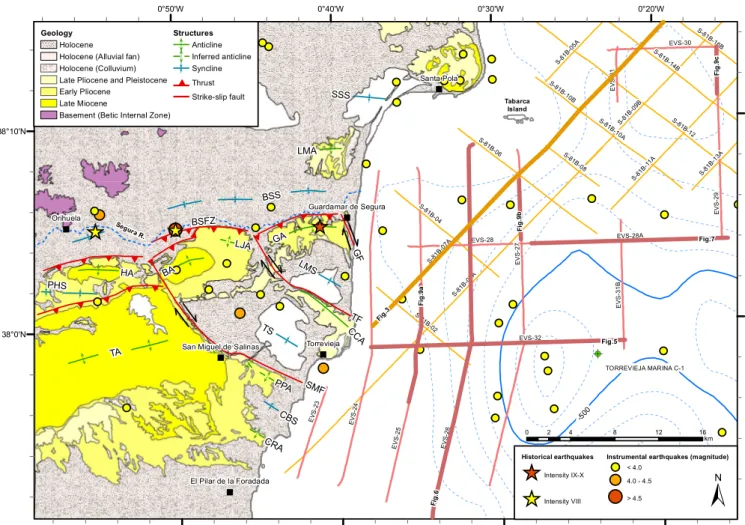
SSS BSS LMA BSFZ PHS HA BA LJA GA GF LMS TF CCA SMF TA PPA CBS CRA TS Fig .3 Fig.7 Fig. 6 Fi g. 9a Fi g. 9b Fi g. 9c Fig.5 Segura R. Tabarca IslandFig. 2. Bathymetric (dashed blue lines with contour interval 100 m) and geological (Alfaro et al., 2002a, b) map of the Bajo Segura basin.
Stars and dots show the historical and instrumental epicenters, respectively (IGN, 2011). Orange lines correspond to commercial MCS profiles (survey S-81B 25/81; Archivo T´ecnico de Hidrocarburos, 2012) and pink lines to SCS sparker profiles obtained during the EVENT-SHELF cruise. Fault kinematics refers to Upper Neogene. Faults: BSFZ: Bajo Segura fault zone; GF: Guardamar fault; SMF: San Miguel de Salinas fault; TF: Torrevieja fault. Folds: BA: Benej´uzar anticline; BSS: Bajo Segura syncline; CBS: Cala del Bosque syncline; CCA: Cabo Cervera anticline; CRA: Cabo Roig anticline; GA: Guardamar anticline; HA: Hurchillo anticline; LJA: Lomas de la Juliana anticline; LMA: La Marina anticline; LMS: La Mata syncline; PHS: Pino Hermoso syncline; PPA: Punta Prima anticline; SSS: Salinas de Santa Pola syncline; TA: Torremendo anticline; TS: Torrevieja syncline.
2 Geodynamic and seismicity settings of the Bajo
Se-gura basin
2.1 The onshore Bajo Segura basin
The Bajo Segura basin is located in the Eastern Betic Cordillera (SE Spain), in the northern terminal splay of the EBSZ and extends eastwards into the Mediterranean Sea (Figs. 1 and 2). The basin is infilled by a succession of Upper Miocene to Quaternary sedimentary units that can be sum-marized (Montenat, 1977), from bottom to top, as the fol-lowing: (a) Upper Miocene (Upper Tortonian) shallow ma-rine (conglomerates and sandstones), slope and pelagic facies (marls and turbidites); (b) Upper Miocene (Late Tortonian– Messinian) slope and pelagic basin facies topped by
shal-low marine facies (evaporites, sandstones and coral reefs); (c) Pliocene unit comprising (Montenat, 1977), from bottom to top, the following: Hurchillo marls formation (pelagic ma-rine facies), Rojales sandstone formation (coastal and shal-low shelf facies), variegated lutite formation (river floodplain facies), and Segura conglomerates formation (fluvial chan-nelized facies); and (d) Quaternary units, about 30 m thick, with the upper 20 m dated between 14 570 yr BP (14C age; Soria et al., 1999) and the present, and characterized by iso-lated outcrops of Pleistocene alluvial fans, marine terraces and a cover of unconsolidated sediments deposited along the present Segura River valley (Fig. 2). The Upper Miocene– Quaternary sedimentary cover overlies a basement forming part of the Internal Zone of the Betic Cordillera (Triassic cal-careous metamorphic rocks of the Alpujarride complex).
From the Upper Miocene to the present, the Bajo Segura basin area has been distinguished by a transpressive regime (Silva et al., 1993; Alfaro et al., 2002a, b), with a NNW– SSE compressive stress field. In this geodynamic setting, the basement and the Upper Miocene to Quaternary sedimen-tary cover of the Bajo Segura basin have been folded and faulted (Fig. 2). This basin is bordered by two main faults: the Crevillente fault (Focault, 1974) to the north (Fig. 1), and the BSFZ (Montenat, 1977) to the south, both running ap-proximately ENE–WSW. The BSFZ is characterized by sev-eral ENE–WSW blind thrusts that offset the Triassic base-ment of the Internal Zone and fold the Upper Miocene to Quaternary sedimentary cover (Montenat, 1977; Bousquet, 1979; L´opez Casado et al., 1987; Somoza, 1993; Taboada et al., 1993; Alfaro, 1995; Alfaro et al., 2002a, 2012). The activity of these blind thrusts has produced an anticlinorium constituted by several north verging folds (Fig. 2), the most important being the Torremendo, Hurchillo, Benej´uzar, Lo-mas de la Juliana and Guardamar anticlines, and the Bajo Segura, Torrevieja and La Mata synclines. Other secondary folds, hectometric in scale, are also present in the basin. The folds are generally gentle or open with limbs usually dip-ping less than 30◦, although strata of the Pliocene Segura conglomerate formation are sub-vertical in the northern limb of the Hurchillo anticline (Alfaro et al., 2002a). These ac-tive growth folds are interpreted as the result of several im-bricated ENE–WSW blind thrusts limited by NW–SE San Miguel de Salinas (SMSF), Torrevieja (TF) and Guardamar dextral transfer faults (Alfaro et al., 2002a). The age of for-mation of the folds was established from the analysis of suc-cessive progressive unconformities in the fold limbs, and it is not synchronous along the entire basin. For instance, the E–W folds, such as La Marina and Santa Pola anticlines, initiated their activity during the Upper Miocene, whereas the NW–SE folds, such as the Cabo Cervera anticline and the Torrevieja syncline, became active during the Pliocene (Alfaro et al., 2002a; Gim´enez et al., 2009). A vertical up-lift rate of about 0.2 mm yr−1 has been calculated compar-ing high-precision levelcompar-ing measurements obtained in 1976, 1997 and 2003 along a 30 km profile cutting across the BSFZ (Gim´enez et al., 2009). This result confirms the recent activ-ity of the faults and folds in the Bajo Segura basin.
2.2 The offshore study area
The offshore Bajo Segura basin is characterized by a wide shelf with an average width of 15 km and a smooth depres-sion in its center (Fig. 2). The maximum depth in the area is around 700 m and is located to the east of the central de-pression. Tabarca island is located in the north of the basin where the shelf is wider. The integration of seismic reflec-tion profiles, gravimetry, seismicity, cores and outcrop data showed that the compressive active structures described on-shore propagate towards the east into the Mediterranean Sea (Alfaro et al., 2002b; Perea et al., 2010). The main feature
already known and described in the offshore is the Tabarca anticline ridge (Fig. 3), which extends around 80 km from the coast in an ENE–WSW direction and is 20 to 30 km wide (Alfaro et al., 2002b). This ridge is bounded by thrust faults (GF4 and GF5, to the south, and SPF2, to the north, Fig. 3) verging in opposite directions and folding the Up-per Miocene unit. The southern thrusts dip to the north and produce the uplift of the Guardamar high, whereas the north-ern thrusts dip to the south and raise the Santa Pola high. In the middle of the Tabarca anticline ridge is the BSFZ, which is composed of thrust faults that dip to the south and fold the Upper Miocene unit. To the north and south of this an-ticline ridge, there are the Alicante and Torrevieja growth synclines, respectively. These two synclines have operated as subsided zones since the start of the folding (Alfaro et al., 2002b). Along the Tabarca anticline ridge are secondary ac-tive anticlines and synclines. These synclines are filled with syntectonic sediments that reach the Quaternary.
2.3 Instrumental and historical seismicity
The Bajo Segura basin shows moderate seismic activity marked by earthquakes with magnitudes lower than 4.0 (Fig. 2). Nevertheless, there have been some earthquakes with higher magnitudes, such as the 1979 San Miguel de Salinas earthquake (mb 4.2), the composed 1919 Jacarilla earthquake characterized by two events (mb 5.2 and 5.1) and the 2003 east Torrevieja earthquake (mb 4.0). The seismicity observed in the onshore basin seems to be related to the main structures such as BSFZ, SMSF and TF faults. In addition, significant seismic activity has been recorded offshore. Given the uncertainty in the location of this seismicity, it is diffi-cult to associate the earthquakes to some specific structures. However, a group of earthquakes shows an E–W strike coin-ciding with the offshore prolongation of the BSFZ (Fig. 2).
The historical seismic catalog (IGN, 2011) shows that the area has been affected by some destructive earthquakes, such as the 1048 (IEMS98= X), the 1482 (IEMS98 VIII) and the 1484 (IEMS98 IX) in Orihuela, the 1523 (IEMS98 VIII) in Guardamar del Segura, the 1746 (IEMS98VII) in Rojales and the 1802, 1828, 1837, 1867 and 1909, all of them (IEMS98 VII) in Torrevieja (Bisbal, 1984; Giner et al., 2003; IGN, 2011). Nevertheless, the most destructive earthquake to have struck the Bajo Segura basin and the SE Iberian Peninsula was the 1829 Torrevieja earthquake (IEMS98 IX–X), which caused 389 fatalities and devastated Torrevieja and other small towns along the Segura River valley (Rodr´ıguez de la Torre, 1984; Mu˜noz and Ud´ıas, 1991; Albini and Rodr´ıguez de la Torre, 2001; Mart´ınez Solares and Mezcua, 2002).
1 SP: 500 1000 1500 2000 2500 3000 3500 4000 4500 5000 5500 6000 6500 7000 7500 8000 8400/1 500 1000 1500 2000 2500 3000 3500 4000 4500 5000 5260
EVS-25 (Fig. 9a)
EVS-28 EVS-26 (Fig. 6) EVS-31 EVS-30 EVS-27 (Fig. 9b) S-81B-02 S-81B-04 S-81B-06 S-81B-08 S-81B-10 S-81B-12 S-81B-14 S-81B-16B S-81B-18B S-81B-20A 0.0 0.5 1.0 TWTT (s) 1.5 2.0 2.5 S-81B-07A SW NE 5 km 350 m Unit III (Upper Miocene) Basement Unit II (Pliocene) Unit I (Quaternary) 1 SP: 500 1000 1500 2000 2500 3000 3500 4000 4500 5000 5500 6000 6500 7000 7500 8000 8400/1 500 1000 1500 2000 2500 3000 3500 4000 4500 5000 5260 0.0 0.5 1.0 TWTT (s) 1.5 2.0 2.5 T abarca Anticline Ridge T orrevieja Syncline Alicante Syncline Cabo Cervera Zone Guardamar Zone La Marina Zone Santa Pola Zone Guardamar high La Mata trough Segura river trough La Marina high
Santa Pola high
Alicante trough Multiple GF5 GF4 GF3 GF2a GF1a LMF2 LMF1 SPF4 SPF3 SPF2 LMF3 BSFZ Figure 3 Fig . 3. Commercial MCS pro file S-81B-07A (Archi v o T ´ecnico de Hidrocarb uros, 2012) and relati v e line dra wing. The names of th e faults depicted in the line dra wing are the same of those in Fig. 8. The small red squares in the line dra wing sho w the penetration of the SCS spark er profiles EVS-25 (Fig. 9a), EVS-26 (Fig. 6) and EVS-27 (Fig. 9 b). Note the dif ferent penetration between both types of pro files. See profile location in Fig. 2 and fault location in Fig. 8.
Figure 4 N EVS-23 EVS-24 EVS-25 EVS-26 EVS-27 EVS-31B EVS-32 Fig.5 Fig.9a Fig.9b Fig.6 Torrevieja Marina C1 (proj.)
Fig. 4. 3-D view from the SE of the SCS sparker profiles
ob-tained during the EVENT-SHELF cruise on the Bajo Segura off-shore basin. Note the shallowness of the Neogene basement (almost transparent seismic facies) to the north of the basin and how the Quaternary sedimentary basin (continuous reflector facies) thick-ens to the east and onlaps the basement to the north. Figures 5, 6, 9a and 9b are located in this figure. Lower-left inset; red lines: displayed profiles; dotted red lines: not displayed profiles; yellow symbol: point of view of the 3-D view. See location of profiles in Fig. 2.
3 Data and methods
In the offshore Bajo Segura basin during the EVENT-SHELF cruise, we sought to explore the prolongation towards the continental shelf of the onshore structures (faults and folds) active in the Quaternary and to provide evidence of their recent activity. To this end, a SCS sparker system was installed onboard the R/V Garc´ıa del Cid (CISC) in or-der to obtain high-resolution profiles to investigate seafloor ruptures and the shallow sub-surface structure. The source was a sparker SPARK 6 kJ manufactured by GEO-RESOURCES BV, specially designed to favor high frequen-cies. The triggering was every 2 s and the source used ranged between 4 and 6 kJ. The receiver consisted of a 9-m-long, 24-hydrophone single-channel streamer. The seismic signal was recorded by the Geo-trace acquisition system with a sam-pling rate of 100 µs and a length of the record between 1.5 and 2.0 s TWTT, allowing up to 30 cm of vertical resolution and 400 m of penetration below the seafloor surface. Post-processing consisted of change of polarity (the system uses a negative electric discharge instead of a positive pulse), de-bias, high-pass filter of 300 Hz and a low-pass band filter of 1400 Hz, AGC (10 ms window applied to the whole trace), gain, spherical divergence correction and a swell filter. Ten SCS sparker profiles (EVS-23 to EVS-32) were obtained, most of them being perpendicular to the onshore structures
(Figs. 2 and 4). The signal was recorded in a SEG-Y format and later analyzed on SMT Kingdom Suite software.
Commercial multichannel seismic (MCS) profiles were obtained and processed by the EXXON Company in 1982 during the S-81B (25/81) survey along the Alicante offshore basin (Archivo T´ecnico de Hidrocarburos, 2012). The source used comprised a tuned array of 6 clusters of 6 airguns, towed at a depth of 9.1 m (30 ft) and fired every 22.5 m (73.8 ft). Seismic data were recorded at 4 ms sampling interval, record length of 5 s TWTT, using a 203-channel Teledyne streamer towed at a depth of 10.6 m (35 ft). The seismic processing flow included exponential gain correction and pre-stack de-convolution (160 ms operator length). Later, CMP sorting, velocity analysis, NMO correction and post-stack deconvo-lution (256 ms operator length) were applied. Then, the pro-files were post-stack wave equation time migrated. Finally, MCS sections were time variant band-pass and time scaled filtered.
The multibeam swath-bathymetry was obtained at the same time as the SCS sparker profiles. The used multibeam-echosounder was an Elac Nautik SeaBeam 1050D, emitting a frequency of 180 kHz. Given that the objective of the cruise was the acquisition of SCS sparker profiles, the bathymetric coverage was limited to the areas crossed during the seismic survey. Thus, about 276 km with an average width of 300 m were recorded during the cruise. Nevertheless, small-scale morpho-structures such as sloping ramps and rocky reliefs up to 4 m high were found in the study area. However, a high-resolution bathymetric map is necessary to understand the significance of these morpho-structures and the active pro-cesses that occur in the area.
4 Seismo-stratigraphy and structures of the offshore
Bajo Segura basin
4.1 Seismo-stratigraphic units
The commercial MCS and SCS sparker profiles enabled us to distinguish seismo-stratigraphic units at different resolutions and depth intervals.
In the commercial MCS profiles three seismo-stratigraphic units were identified (Fig. 3), units I, II and III. Unit I, from top to bottom, is mainly preserved in the depressed areas with a maximum thickness of 0.2 s TWTT. It has sheet drape ge-ometry and does not show internal reflectors at this resolu-tion. Unit II has regional distribution and sheet drape geom-etry. Internal reflectors are roughly continuous and parallel with medium-to-high amplitude and low frequency. Diver-gent reflections can be observed close to the active zones. In the uplifted areas, reflectors from the top of unit II are eroded and onlap the lower unit III. Unit III is recognized in all the profiles. It shows sheet to sheet drape geometry with paral-lel and roughly continuous reflectors of high-to-medium am-plitude and medium-to-low frequency. Comparison with the
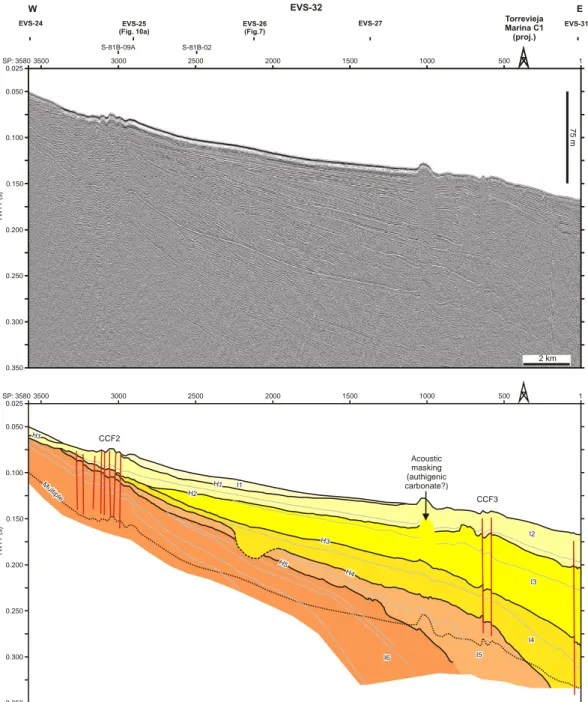
SP: 3580 3500 3000 2500 2000 1500 1000 500 1 0.025 0.050 0.100 0.150 0.200 0.250 0.300 0.350 TWTT (s) S-81B-02 S-81B-09A EVS-26 (Fig.7) EVS-24 EVS-25 (Fig. 10a) EVS-27 EVS-31B W EVS-32 E 2 km 75 m Torrevieja Marina C1 (proj.) SP: 3580 3500 3000 2500 2000 1500 1000 500 1 0.025 0.050 0.100 0.150 0.200 0.250 0.300 0.350 TWTT (s) Acoustic masking (authigenic carbonate?) CCF2 CCF3 Multiple H1 H1 H2 H3 H4 I1 I6 I5 I4 I3 I2 H5 Figure 5
Fig. 5. SCS sparker profile EVS-32 and relative line drawing showing the identified seismo-stratigraphic units and structures. Note that the
CCF2 (Fig. 8) fault zone is offsetting the seafloor surface, thus demonstrating the recent activity on this fault zone. Around shot point (SP) 1000, there is an acoustic masking facies that could be related to authigenic carbonates (Lo Iacono et al., 2011). The position of the Torrevieja Marina C-1 well is projected. See profile and well location in Figs. 2 and 4.
work of Alfaro et al. (2002b) shows that units I and II are equivalent to their Pliocene–Quaternary unit, and unit III to their Upper Miocene unit. These authors established the age of these units based on a correlation with commercial wells located in the area (one of them the Torrevieja Marina C-1 described below and located in Fig. 2) and also with the ge-ological units observed in the onshore basin and explained briefly in Sect. 2.1.
On the SCS sparker profiles (Figs. 2 and 4), up to six units (I1 to I6) have been identified, bounded by five horizons (H1 to H5) that correspond to regional erosion surfaces (Figs. 5, 6 and 7). Units I1 to I6 are divided into several subunits limited by minor discordances (gray lines in Figs. 5, 6 and 7). A to-tal of fifteen subunits were differentiated. Commonly, reflec-tors are continuous and parallel with a decreasing amplitude and frequency in depth. In general, the deeper zones of the basin show concordant geometry and the shallow areas reveal
2 km
75 m
S-81B-09A S-81B-04 S-81B-07A (Fig. 5)
S-81B-02
EVS-32 (Fig. 6) EVS-28
SSW NNE S N EVS-26 SP:1 500 1000 1500 2000 2500 3000 3500 4000 4500 5000 5480 0.025 0.050 0.100 0.150 0.200 0.250 0.300 TWTT (s) H1 H2 H3 H4 H5 Multiple SP:1 500 1000 1500 2000 2500 3000 3500 4000 4500 5000 5480 0.025 0.050 0.100 0.150 0.200 0.250 0.300 TWTT (s) San Miguel
de Salinas Zone TorreviejaZone
Cabo Cervera Zone Guardamar Zone La Marina Zone I2 I1 I1 I3 I4 I5 I6 Figure 6 Neogene basement LMF1 LMF2 LMF3 GF1a GF2a GF3 GF4 GF5 Cabo Cervera Anticline Torrevieja Syncline BSFZ
Fig. 6. SCS sparker profile EVS-26 and relative line drawing showing the seismo-stratigraphic units and structures. Note how the folding
affects unit I3 and some reflectors at the base of unit I2 in the Torrevieja zone and that some faults affect unit I1 in Guardamar and La Marina zones. See location of profile in Figs. 2 and 4.
erosional truncation, although toplaps can occur (Figs. 4, 5, 6 and 7). The base of the units is generally distinguished by onlapping geometry in the uplifted zones. This geome-try progressively becomes concordant and, finally, downlaps towards the center of the basin.
The Torrevieja Marina C-1 commercial exploration well is located close to the EVS-32 SCS sparker profile (Figs. 2, 4 and 5). This well was operated by ENIEPSA in Novem-ber 1978, and the recovered core was 578 m long (Lanaja et al., 1987). Three units were recognized in the well (Lanaja et al., 1987), from top to bottom: (a) 386 m of calcareous clay unit with fine sand layers, Quaternary in age; (b) 109 m of clay unit with fine layers of sand and limestone at the base, Upper Pliocene to Quaternary in age; and (c) 83 m of dolomite and dolomite limestone unit, Upper Pliocene in age. The sedimentary thickness imaged in the SCS sparker
profile EVS-32 above the multiple (0.152 s TWTT) on the projection of Torrevieja Marina C-1 well (shot point 360) is around 120 m (velocity of seismic waves between 1500 and 1600 m s−1) and corresponds to the Quaternary unit in the well. Therefore, units I1 to I5, and most probably I6, must be Quaternary in age. Comparison of the SCS sparker pro-files with commercial MCS propro-files shows that units I1 to I6 (Figs. 5, 6 and 7) coincide to the upper unit I (Fig. 3). Thus, unit I must be Quaternary in age.
Unit I1 is the upper unit distinguished in the offshore basin. This unit becomes thinner and discontinuous from the coastline towards the basin, and its lower boundary corre-sponds to horizon H1, which is a regional erosional surface (Figs. 5, 6 and 7). Close to the coast, unit I1 attains a thick-ness of 15 m. Onshore, the last 20 m of the Quaternary unit were deposited during the last 14 570 yr BP. Thus, unit I1
2 km 75 m EVS-31B W EVS-28A E SP:1860 2000 2500 3000 3500 4000 45004640 TWTT (s) 0.075 0.100 0.150 0.200 0.250 0.300 Paleoshoreline position H1 Left inset Left inset Paleoshoreline position H2 Paleoshoreline position H3 ? Paleoshoreline position H4 (?) Paleoshoreline position H5 (?) Paleoshoreline deposits ? H1 I1 I5 I6 H2 H3 H4 H5 Multiple H1 I1 I1 I2 I3 I4 SP:1860 2000 2500 3000 3500 4000 45004640 TWTT (s) 0.075 0.100 0.150 0.200 0.250 0.300 Figure 7 I1 I2 I3 H1 H2
Fig. 7. SCS sparker profile EVS-28A and relative line drawing showing the seismo-stratigraphic units. Note the presence of large erosional
surfaces that in some cases end in ancient paleoshorelines indicated by the change in reflector slope and by the probable presence of shoreline deposits (detail in the left inset). These surfaces were used to determine the age of the seismic horizons H1 to H5. See profile location in Fig. 2.
must be the continuation of the Quaternary onshore unit and it may be the offshore sedimentary unit deposited since the last glacial maximum (LGM). Accordingly, H1 may be re-lated to the last global sea level lowstand, which is associated with Marine Isotopic Stage 2 (MIS2) and dates 20 ± 5 ka. In some SCS sparker profiles, this erosional surface ends in an abrupt change in slope (Fig. 8). This might corre-spond to the position of the LGM paleoshoreline, which at present is located approximately at 106 m below the present sea level (b.p.s.l.) (considering that the velocity of seismic waves propagation on sea water is 1500 m s−1and in the first hundreds of meters of the sedimentary layer 1600 m s−1). In the Gulf of Lions, the LGM paleoshoreline was placed be-tween 102 and 107 m b.p.s.l. (Rabineau et al., 2006). These
results are in agreement with the observations made in the Bajo Segura basin and support the hypothesis that H1 is the erosional surface developed during the LGM lowstand.
Given that horizon H1 could be attributed to the LGM sea level lowstand, it is reasonable to assume that the other hori-zons, H2 to H5, correspond to other global sea level low-stands and could therefore be associated with different MIS (e.g. Rabineau et al., 2006; Ridente et al., 2008). Neverthe-less, it should be noted that the present evolution of the Bajo Segura basin is controlled by Quaternary active structures. Comparison with other zones located in tectonically passive environments is therefore not straightforward. To avoid the effects of tectonic deformation, the following depth calcula-tions of probable ancient paleoshorelines were made in the
(( (( ( ( ( (
F
M
F
F
F
M
M
F
M
M
M
F
M
F
F
F
(( (( ( ( ( (M
M
M
@@ @@F
F
F
F
F
F
@@M
M
M
F
F
F
F
F
F
F
@@F
@@ @@M
@@F
F
M
M
F
F
F
F
F
F
F
F
F
@@ @@ @@ @@F
F
F
F
F
F
F
F
F
F
F
F
M
M
M
M
M
M
F
F
F
F
F
F
F
F
F
M
M
M
F
F
F
F
F
F
F
F
F
M
M
M
M
M
M
M
M
M
F
F
F
M
M
M
M
M
M
M
F
F
F
F
F
F
@ @ " " " " " " -500 -10 00 To rre vie ja Sa nta P ola G ua rda m ar d e S eg ura Sa n M igu el d e S alin as El P ila r d e la F ora da da 0°0 ' 0°1 0'W 0°2 0'W 0°3 0'W 0°4 0'W 38 °1 0'N 38 °0 'N O ffs ho re ac tiv e s tru ctu re s F An tic lin e F Infe rre d a ntic lin e F@@ An tic lin e w ith u nk no w n e nd ing Fa ult Infe rre d fa ult @@ Fa ult w ith un kn ow n e nd ing M Sy nc lin e M Infe rre d s yn clin e M@@ Sy nc lin e w ith u nk no w n e nd ing G eo lo gy H olo ce ne H olo ce ne (A llu via l fa n) H olo ce ne (C ollu viu m ) La te P lio ce ne an d P leis toc en e Ea rly P lio ce ne La te M ioc en e Str uc tu re s F An tic lin e F Infe rre d a ntic lin e M Sy nc lin e (( Th ru st Str ike -sli p fa ult±
0 5 10 15 20 2,5 km SS S BSS LM A BS FZ LJ A GA GF LM S TF CC A SM F PP A CB S CR A TS Sa lin as d e To rre vie ja Zo ne Sa nta P ola Zo ne G ua rd am ar Zo ne C ab o C erv era Zo ne La M ari na Zo ne Sa n M ig ue l d e Sa lin as Z on e Fig ure 8 Ta ba rca Isla nd Se gu ra R. SP F1 SP F2 b SP F2 a SP F3 SP F4 LM F1 LM F2 LM F3 G F1 a G F1 b BS FZ G F2 a G F2 b G F3 G F4 G F5 C C F1 C C F2 C C F3 SM SF 1 SM SF 2 SM SF 3 Fig . 8. Geological (Alf aro et al., 2002a, b) and bath ymetric map of the Bajo S egura ba sin sho win g the of fshore geological structures (f aults and folds). The deformation zones described in the te xt are sho wn. F aults: BSFZ: Bajo Se gura fault zone; GF: Guardamar fault; SMF: San Miguel de Salinas fault; TF: T orre vieja fault. F olds: BSS: Bajo Se gura syncline; CBS: Cala del Bosque syncline; CCA: Cabo Cerv era anticline; CRA: Cabo Roig anticline; GA: Guardamar anticline; LJ A: Lomas de la Juliana anticline; LMA : La Marina anticlin e; LMS: La Mata syncline; PP A: Punta Prima anticlin e; SSS: Salinas de Santa Pola syncline; TS: T orre vieja syncline.E–W profiles that are parallel to the main active structures (Figs. 5 and 7).
Horizon H2 is located at the base of unit I2 (Figs. 5, 6 and 7) and is interpreted as a regional erosional surface. In line with the assumptions made to date H1, H2 might also be ascribed to a global sea level lowstand. In profile EV-28A, the erosional surface ends in an abrupt change in slope where some possible paleoshoreline deposits could be iden-tified (Fig. 7). The depth of this ancient paleoshoreline is 121 m b.p.s.l., 15 m below H1. In the Gulf of Lions, the pale-oshoreline associated with MIS6 is located 16 m below MIS2 (Rabineau et al., 2006). Because of the similar values ob-tained in both areas, it may be assumed that H2 developed during MIS6 (135 ± 5 ka). Minor discontinuities in unit I2 could correspond to (a) minor sea level oscillations similar to those in the Adriatic Sea that have been attributed to dif-ferent stages of MIS5 (Ridente et al., 2008), or (b) tectonic activity.
Horizon H3 is located at the base of unit I3 (Figs. 5, 6 and 7). As in the case of the aforementioned horizons, H3 is a regional erosional surface with an associated ancient pale-oshoreline located at 125 m b.p.s.l., 4 m below H2 and closer to the present shoreline (Fig. 7). Given its regional character and after comparison with H1 and H2, H3 could also be cor-related with an older global sea level lowstand. In the Gulf of Lions, the difference between the second and the third dis-continuities ascribed to sea level drops is also 4 m, the lat-ter discontinuity being assigned to MIS8.2 (Rabineau et al., 2006). Considering this and the similarities to the other hori-zons, H3 could correspond to MIS8.2 (247.6 ± 5 ka).
The fourth horizon is H4 located at the base of unit I4 (Figs. 5, 6 and 7). This horizon also seems to be a regional erosional surface. The uncertainty is related to the fact that the zones where it can be best observed are uplifted and folded. Nevertheless, an ancient paleoshoreline related to H4 was identified approximately at 144 m b.p.s.l. (Fig. 7). Be-cause of the similarities to H1, H2 and H3, horizon H4 could have been formed during a global sea level lowstand corre-sponding to MIS10 (341 ± 5 ka).
Finally, the last regional discontinuity is horizon H5, which is located at the base of unit I5 (Figs. 5, 6 and 7). This is the last and the deepest regional erosional surface ob-served in the SCS sparker profiles. A probable ancient pa-leoshoreline was identified between 130 and 168 m b.p.s.l. (Fig. 7). This large range in the depth of the paleoshoreline is attributed to the difficulty of observing it in areas without deformation. Compared with the other horizons, H5 could also be related to a global sea level lowstand and assigned to MIS12 (434 ± 5 ka).
4.2 Offshore faults and fold systems
As stated above, the Tabarca anticline ridge is the main structure in the offshore Bajo Segura basin (Fig. 3). The analysis of the commercial MCS and SCS sparker profiles
that cross the area enabled us to identify different structures (faults and folds) that produced the uplift of the Tabarca an-ticline ridge. Most of the structures trend WSW–ENE to W– E and have a compressive component in their kinematics, which is in agreement with the present regional stress field. The geological structures were grouped into six deformation zones coinciding with the main structures observed onshore and bounded by regional synclines. From north to south, these deformation zones are (a) Santa Pola zone, (b) La Ma-rina zone, (c) Guardamar zone, (d) Cabo de Cervera zone, (e) Salinas de Torrevieja zone, and (f) San Miguel de Salinas zone. These structures were correlated between the different commercial MCS and SCS sparker profiles and with the on-shore geology (Fig. 8).
The Santa Pola zone is located in the north of the study area (Fig. 8). This deformation zone is bounded to the north and south by two synclines with an E–W direction that ex-tends at least 50 km from the coastline into the sea. The northern syncline, which is a prominent regional fold that bounds the Tabarca ridge towards the north, marks the begin-ning of the Alicante syncline (Fig. 3). The southern syncline is a smooth fold that could be correlated with the Salinas de Santa Pola syncline observed onshore (Montenat, 1977; So-moza, 1993; Alfaro, 1995), although with some uncertainty. Between these two synclines is the Santa Pola high (Fig. 3), an E–W trending smooth ridge comprising narrowly spaced anticlines associated with faults with the same direction. The faults in the north dip slightly towards the south, whereas in the center of the zone these are sub-vertical (Figs. 3 and 9c). The commercial MCS profiles show that these faults affect unit III, but whether they disturb unit II is not clear. Never-theless, the SCS sparker profiles show that the faults clearly offset reflectors under horizon H2 (fault SPF3 in Fig. 9c), indicating their Quaternary activity.
South of the Santa Pola zone, La Marina zone (Fig. 8) has a WSW–ENE direction, extends at least 50 km and is located between two synclines: the Salinas de Santa Pola to the north, and the marine continuation of the onshore Bajo Segura syn-cline (Montenat, 1977; Taboada et al., 1993; Alfaro et al., 2002a, b; Gim´enez et al., 2009) to the south (Fig. 3), which continues along the offshore basin. The main faults are local-ized to the south and north of those synclines, respectively (Fig. 3). Associated with faults LMF1 and LMF2 is an an-ticline which in some areas has a double hinge, producing a small syncline in between. Towards the east, this anticline probably joins the southern anticline of the Santa Pola zone, leading to the disappearance of the Salinas the Santa Pola syncline. The faults dip slightly towards the central part of the zone. In the commercial MCS profiles, the faults affect unit III, and fault LMF3 affects unit II (Fig. 3). The higher resolution of the SCS sparker profiles shows that these faults are sealed by horizon H1, although in some places this hori-zon might be displaced (Fig. 6). The anticlines fold horihori-zon H2 and probably fold H1.
EVS-32 S-81B-09A S-81B-02 S N EVS-25 SP: 2800 2400 2000 3200 S-81B-09A S N EVS-27 SP: 1000 800 600 520 1200 TWTT (s) 0.0625 0.100 0.150 0.065 0.100 0.150 . 100 0 0.150 0.200 1 km 1 km 35.25 m 35.25 m 35.25 m 1 km S-81B-16B/EVS-30 S N EVS-29 2200 2400 2600 2800 SP: H1 I1 I2 I3(?) H2 BSFZ GF1a SPF3 GF2a H2 H2 I2 I3 I5 (?) I6 H3 H3 La Mata Syncline Cabo Cervera anticline H5 H5 H5 Multiple Multiple Guardamar anticline Multiple Basement Basement Basement H2 a b c H1 I1 I2 I5 I5 I6 H2 SP: 2800 2400 2000 3200 SP: 1000 800 600 520 1200 TWTT (s)0.100 0.0625 0.150 0.065 0.100 0.150 0.100 0.150 0.200 2200 2400 2600 2800 SP: Figure 9 Fig . 9. Details of SCS spark er profiles EVS-25 around the Cabo Cerv era zone (a) , EVS-27 around the Guardamar zone (b) and EVS-29 around the Santa Pola zone (c) and relati v e line dra wings sho wing the seismo-stratigraphic units, faults and fo lds. Note ho w the deformation structures af fect the most recent Quaternary units. See location of profiles in Figs. 2 and 4.
The Guardamar zone is a large deformation area with a WSW–ENE direction and a length of up to 50 km. It is located between the Bajo Segura and La Mata synclines (Gim´enez et al., 2009), to the north and south, respec-tively (Figs. 3 and 8). The La Mata syncline propagates around 20 km from the onshore towards the sea, progres-sively changing its direction from NW–SE to WSW–ENE. The faults located on both sides of the Guardamar zone pro-duced the uplift of the area and a regional antiform. As a result, the Neogene basement is elevated and, in some ar-eas, exposed on the seafloor (Figs. 6 and 9b). The structures located to the north of the antiform may be correlated with the BSFZ and the Guardamar anticline (Figs. 3, 6 and 9b). Both structures extend along the study area. The commer-cial MCS profiles show that the BSFZ is composed of thrust faults that dip towards the south (i.e. are folding units III and II). Moreover, the SCS sparker profiles show that the BSFZ separates in some minor sub-vertical faults that offset hori-zon H1. The structures located to the south of the Guardamar high are not correlated with specific onshore structures and taper off towards the center of the shelf. In the commercial MCS profiles, the faults usually dip towards the center of the antiform and affect units III and II. The analysis of the SCS sparker profiles shows that most of the faults are sealed by horizon H1. However, some faults could displace reflectors above H1 (Figs. 6 and 9b). The folds clearly deform units III and II, which are very close to the seafloor surface. The hori-zons developed above these folds are apparently not folded in the SCS sparker profiles.
The Cabo Cervera zone (Fig. 8) is located between the La Mata syncline to the north (Fig. 9a) and some small synclines to the south (Fig. 6). The structures located along the Cabo Cervera zone have an E–W to WSW–ENE direction and con-tinue up to 15 km offshore. In the commercial MCS pro-files, the faults are sub-vertical and offset unit III and prob-ably unit II, which is folded (Alfaro et al., 2002b). The SCS sparker profiles show some faults reaching and deforming the seafloor (Fig. 5). The TF extends offshore with some un-certainty. Nevertheless, the CCF2 faults have been recently active (Fig. 5) and could be related to TF. The Cabo Cervera anticline also extends offshore. This anticline probably folds horizon H1, but decreases in amplitude before tapering off around 10 km from the coastline.
The Salinas de Torrevieja zone is located south of the Cabo Cervera zone (Fig. 8). A number of synclines and anti-clines continue offshore around 15 to 20 km from the coast-line (Fig. 6). These folds have two different directions. The northeastern ones have an E–W trend, a low amplitude and do not deform the reflectors above horizon H2. In contrast, the folds identified in the south have a WNW–ESE trend, a larger amplitude and slightly fold the reflectors above H2 and near H1 (Fig. 6). The Torrevieja syncline described on-shore (Montenat, 1977; Somoza, 1993; Alfaro et al., 2002a; Gim´enez et al., 2009) extends offshore in a WNW–ESE di-rection for more than 20 km.
The southernmost zone is the San Miguel de Salinas zone (Fig. 8). The structures identified in this zone change from WNW–ESE in the north to E–W in the south, and continue for 15 km offshore. Most of the faults are sub-vertical and offset horizon H2 and, in some places, also horizon H1. Both horizons are folded. As a result of the correlation with the structures described onshore (Montenat, 1977; Alfaro et al., 2002a; Gim´enez et al., 2009), the SMSF, the Punta Prima anticline and the Cala del Bosque syncline extend offshore.
5 Discussion
5.1 Style of deformation
As stated above, the present regional stress field in the Bajo Segura basin is compressive and trends NW–SE to N–S. Ac-cordingly, most of the described structures, faults and folds, have a compressive component in their kinematics and trend WSW–ENE to W–E (Figs. 3, 6 and 8). Taboada et al. (1993) considered three hypotheses in an attempt to explain the de-formation undergone in the Bajo Segura basin and to ac-count for the geometrical relationships between the main faults (BSFZ, TF and SMSF) and anticlines (the Guardamar, Cabo Cervera and Punta Prima). The first hypothesis consid-ers that each anticline was created by an independent blind thrust. By contrast, the second and third hypotheses propose that all the faults branch into a common detachment layer at depth. Moreover, the Guardamar and Cabo Cervera an-ticlines would be associated with a thrust system with flat-ramp geometry. The difference between the two hypotheses is that one considers that both anticlines are related to blind thrusts, whereas the other assumes that only the Guardamar anticline is produced by a thrust. Analysis of the commer-cial MCS profiles S-81B-07A (Fig. 3) and S-81B-09 (Alfaro et al., 2002b), which have directions similar to those of the cross section provided by Taboada et al. (1993), shows the following: (a) there is no shallow (1 km depth) detachment layer that could be identified as the flat zone of flat-ramp thrust geometry; by contrast the BSFZ, TF and SMSF seem deeply rooted in the crust since they show high dip angles; (b) there is a predominance of thrust kinematics only in the BSFZ; (c) the TF and SMSF are more vertical and produce less uplift than the BSFZ, indicating that their thrust kine-matics is much lower and that the strike-slip component is prevalent. In line with these observations, the second and third hypotheses of Taboada et al. (1993) could be discarded even though these hypotheses offer a better reproduction of the deformation at the base of the Pliocene. Furthermore, the first hypothesis should consider a main strike-slip component in the TF and SMSF. From the Bajo Segura fault to the north, there is a predominance of compressive structures (thrust faults and anticlines) that uplift the La Marina and Santa Pola highs (Fig. 3). There are few structures in this uplifted area,
the most significant being the anticline associated with fault LMF2, which has been correlated with La Marina anticline.
5.2 Timing of deformation
The activity of faults and folds identified in the Bajo Se-gura basin began in the Upper Miocene and continues during the Quaternary (Alfaro, 1995; Montenat et al., 1990). The commercial MCS profiles show that faults and folds deform units III and II, Upper Miocene and Pliocene in age, respec-tively, but it is not certain whether they affect unit I, which corresponds to the Quaternary (Fig. 3). However, the analysis of the SCS sparker profiles shows that most of the structures that were active during the Pliocene have been active dur-ing the Quaternary (Figs. 5, 6 and 9). As stated above, the different deformation zones show faults and folds that de-form horizon H2. Some of these structures also affect hori-zon H1, and very few reach the seafloor surface (Figs. 5 and 9). In line with these observations and with the ages given to the different horizons, most of the structures were active until 135 ka and in some cases this activity postdates 20 ka. Considering the available slip rates of the main faults in the area, which vary between 0.12 and 0.40 mm yr−1 (So-moza, 1993; Garc´ıa-Mayordomo and Mart´ıniez-D´ıaz, 2006; Gim´enez et al., 2009; Alfaro et al., 2012; Garc´ıa-Mayordomo et al., 2012), some authors have calculated the recurrence in-tervals of the large earthquakes, which range between 1700 and 30 000 yr (Alfaro et al., 2012; Garc´ıa-Mayordomo et al., 2012). Thus, reflectors above horizon H1 were probably de-formed by very few earthquakes. Moreover, the deformation produced by a single event could be distributed over a wide area given that the main structures of the zone are anticlines associated with blind faults. These two reasons would sug-gest that the accumulated offset in not necessarily visible in the resolution of the SCS sparker profiles. In conclusion, fol-lowing this reasoning, the structures affecting the reflectors just below or above horizon H2 can be considered as active during the Quaternary and capable of causing large earth-quakes.
5.3 Possible sources of the 1829 Torrevieja earthquake
On 21 March 1829, the province of Alicante was struck by a large earthquake known as the Torrevieja earthquake (IEMS98 IX–X). This is one of the largest historical earthquakes in Spain and the strongest shock of a seismic sequence that af-fected the province of Alicante during 1828 and 1829 (L´opez Marinas, 1976; Mezcua, 1982; Rodr´ıguez de la Torre, 1984; Mu˜noz et al., 1984; Albini and Rodr´ıguez de la Torre, 2001; Mart´ınez Solares and Mezcua, 2002). According to histori-cal records, the Torrevieja earthquake was felt over a large area, caused a great deal of damage to the epicentral area (e.g. the villages of Almorad´ı, Benej´uzar and Torrevieja were completely destroyed) and about 389 casualties (Larramendi, 1829; Galbis, 1932). Considerable liquefaction occurred in
the Bajo Segura Plain onshore (Larramendi, 1829; Rodr´ıguez de la Torre, 1984; Alfaro, 1995; Alfaro et al., 1999; So-ria et al., 1999). Earthquake magnitudes between 6.0 and 6.9 and focal depths between 3 and 7 km have been esti-mated for this event by different authors (Mu˜noz and Ud´ıas, 1991; Delgado et al., 1993; Giner, 1996; Mart´ınez Solares and Mezcua, 2002; Garc´ıa-Mayordomo and Mart´ınez-D´ıaz, 2006). The question still open is about which fault gener-ated the 1829 Torrevieja earthquake. The most recent com-pilations and reevaluations of intensity data points include 67 localities where the 1829 Torrevieja earthquake caused damage to buildings and/or was felt by the population (Al-bini and Rodr´ıguez de la Torre, 2001; Mart´ınez Solares and Mezcua, 2002). The highest intensities (IEMS98 IX–X and IX) were felt between Benej´uzar and Guardamar, from west to east, and between Almorad´ı and Torrevieja, from north to south. This geographical distribution of the highest inten-sities points to the BSFZ and TF as being the most likely sources of the earthquake (Fig. 10). Moreover, given the lack of information about intensity offshore and the location of some of the highest values close to the coastline, the earth-quake could have resulted from the rupture of an offshore segment of one of these two faults. The analysis of the SCS sparker profiles obtained in this area could provide some new information about the identification of the earthquake source. The first candidate to be the 1829 earthquake source is the BSFZ (Figs. 2, 8 and 10). This is a WSW–ENE trend-ing blind thrust with the hangtrend-ing wall directed towards the NW. This is a blind fault that deforms the surface with sev-eral anticlines affecting the Plio-Quaternary units (Taboada et al., 1993; Alfaro, 1995). Using different geological mark-ers and high-precision leveling data, an uplift rate of around 0.2 mm yr−1has been estimated around the BSFZ (Somoza, 1993; Sanz de Galdeano et al., 1998; Garc´ıa-Mayordomo and Mart´ınez-D´ıaz, 2006; Gim´enez et al., 2009). Alfaro et al. (2002a) interpreted this structure as the most likely source fault and located the focus between the Segura River and Torrevieja, considering the evidence of Quaternary activity and the southward dip of the BSFZ. This would explain the considerable damage and high intensities around Torrevieja as well as the liquefaction and local site effects observed in the basin villages. Analysis of the SCS sparker profiles shows that some minor faults, related to the BSFZ, offset horizon H2 and maybe H1 (Figs. 6 and 9b). Thus, the off-shore part of the Bajo Segura fault has been active during the Upper Quaternary, with possible deformation events in the last 20 ka. The total length of the Bajo Segura fault onshore is 27 km, 10 km corresponding to the Hurchillo, 9 km to the Benej´uzar and 8 km to the Guardamar segments (Alfaro et al., 2012). On the basis of the correlation between the dif-ferent seismic profiles, the BSFZ can be traced for at least 27 km offshore. Considering these different dimensions as the surface rupture length of an earthquake and using empir-ical relationships for reverse faults (Wells and Coppersmith, 1994), a moment magnitude (Mw) ranging between 6.1 and
! H ! H ! H ! H ! H ! ! ! ! ! H !H ! H ! ! ! ! ! ! ! ! ! H ! H ! !H ! E E E Cox Rafal Molins Catral Redovan Callosa La Daya Rojales Algolfa La Daya La Mata Benferri Bigastro Orihuela Almoradí La Granja Jacarilla Benijofar Guardamar Benejuzar Torrevieja San Fulgencio San Bartolomé
San Felipe Neri
Campo de Salinas Puebla de Rocamora
Villa de los Dolores
Formentera del Segura
0°40'W 0°45'W 0°50'W 0°55'W 38°10'N 38°5'N 38°0'N
Figure 10
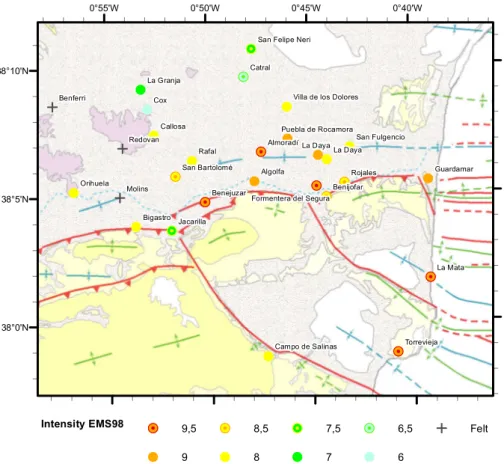
Intensity EMS98 !H 9,5 ! 9 ! H 8,5 ! 8 ! H 7,5 ! 7 ! H 6,5 ! 6 E FeltFig. 10. Geological map of the Bajo Segura basin (Alfaro et al., 2002a, b) showing the distribution of the intensity data points of the
21 March 1829 Torrevieja earthquake (Mart´ınez Solares and Mezcua, 2002). Note that the area where the maximum intensities are located suggests that the BSFZ or the TF are the most likely sources of this earthquake.
6.7 is obtained. Thus, these ruptures would yield magnitudes in the range of magnitudes estimated by other authors for this earthquake. Nevertheless, the highest magnitude (Mw 6.9) is only obtained when the length of the Guardamar and the off-shore segments are considered to be the earthquake rupture (35 km). This maximum magnitude is exceeded when assum-ing that the entire fault (onshore and offshore segments) rup-tures together (54 km, Mw 7.1).
The second candidate, the TF (Figs. 2 and 8), is a NW–SE trending right-lateral strike-slip fault with a reverse compo-nent. Although the fault is difficult to follow along the zone, its present activity is evidenced by the presence of the Cabo Cervera anticline where the Plio-Pleistocene sedimentary units are folded. Besides, the fault could have produced some lateral displacement of the BSFZ, which is active (Fig. 2). The estimated slip rate of the TF is 0.075 mm yr−1because of the displacement of the Upper Pliocene structural surface (Garc´ıa-Mayordomo and Mart´ınez-D´ıaz, 2006). On the basis of a statistical study of the intensities assigned to some local-ities during the 1829 Torrevieja earthquake (L´opez Marinas, 1976; Mu˜noz et al., 1984; L´opez Casado et al., 1992), and as-suming that the source model is linear, Delgado et al. (1993) obtained a fault source that better reproduced these
intensi-ties. This fault trended NW–SE, extended offshore and may be correlated with the TF. Thus, as in the case of the BSFZ, an earthquake along the TF could also have accounted for the destruction in the area. Furthermore, rupture propagation from offshore towards the northwest could explain the con-siderable damage in the Bajo Segura basin. Nevertheless, a shallow earthquake with an estimated magnitude higher than 6.0 would produce surface rupture, which has not been de-scribed in the area. The existing reports concern a large frac-ture in a coastal and rocky outcrop between Torrevieja and La Mata (Larramendi, 1829), which could also be a landslide scar. As in the onshore, the offshore continuation of the TF is uncertain. However, the Cabo Cervera anticline can be iden-tified and extends for around 10 km. The CCF2 faults are as-sociated with both structures and reach and offset the seafloor surface (Fig. 5), indicating recent activity. Assuming that the Cabo Cervera anticline is directly related to the activity of the fault, the onshore and offshore lengths of the TF are similar, about 12 km each (Garc´ıa-Mayordomo and Mart´ınez-D´ıaz, 2006). Considering the length of these individual segments to be the maximum surface rupture and using empirical re-lationships for reverse and strike-slip faults (Wells and Cop-persmith, 1994), a Mw 6.3 is obtained. Magnitude attains 6.7
when both segments are regarded as rupturing together. With this fault source, the maximum estimated magnitude for the earthquake (Mw 6.9) is not reached.
As stated above, the BSFZ and the TF show Upper Qua-ternary activity. In some cases, this activity postdates horizon H1 or even implies the deformation of the seafloor surface. Thus, it may well be that the fault rupture or part of the rup-ture that caused the 1829 Torrevieja earthquake was located offshore. Nevertheless, no tsunami was reported to be asso-ciated with this event. The rupture of individual segments of these two faults or some combinations of them could pro-duce an earthquake with magnitudes in the range estimated for this event.
Much work has been done in the area substantially im-proving the imaging and characterization of the active/recent tectonic structures. However, there is no definite evidence yet about which fault caused the 1829 earthquake. Therefore, further studies (e.g. swath-microbathymetry, sub-bottom pro-filing or more SCS sparker profiles offshore) are warranted to improve our understanding of the recent Quaternary activity of both faults and of the seismic hazard in the northern ter-mination of the EBSZ.
6 Conclusions
The analysis of the SCS sparker profiles obtained in the off-shore Bajo Segura basin allowed us to identify six seismo-stratigraphic units (I1 to I6) limited by five horizons (H1 to H5). These horizons can correspond to regional erosional surfaces produced during the Quaternary global sea level lowstands and then can be correlated with marine isotopic stages (MIS). We propose that (a) H1 may be correlated to MIS2 (20 ka), (b) H2 to MIS6 (135 ka), (c) H3 to MIS8.2 (247.6 ka), (d) H4 to MIS10 (341 ka), and (e) H5 to MIS 12 (434 ka).
A number of faults and folds affecting the Quaternary sed-iments were mapped for the first time in the Bajo Segura off-shore basin. Most of these structures trend WSW–ENE to W–E and show a compressive component in their kinemat-ics, which is in agreement with the present regional stress field. The main faults described onshore were correlated with those identified offshore. Six deformation zones bounded by regional synclines were proposed in line with the main on-shore structures: (a) Santa Pola zone; (b) La Marina zone; (c) Guardamar zone; (d) Cabo Cervera zone; (e) Torrevieja zone; and (f) San Miguel de Salinas zone.
Integrated analysis of the commercial MCS and SCS sparker profiles shows that (a) the main faults (e.g. BSFZ, TF and SMSF) have high dip angles and are deeply rooted in the crust; (b) the thrust kinematics predominates in the BSFZ and to the north, and is underlined by the formation of anti-clines; and (c) the strike-slip kinematics prevails in the TF and SMSF, despite the fact that these faults formed the Cabo Cervera and Punta Prima anticlines, respectively.
The relations between the seismo-stratigraphic discontinu-ities and the faults and folds that deform them provide evi-dence of recent Quaternary activity in the Bajo Segura basin. Most of the faults are sealed or offset horizon H2 (135 ka), and in some cases their activity postdates the formation of horizon H1 (20 ka). The structures that deform horizon H2 may therefore be considered active and capable of producing destructive earthquakes.
Because of the distribution of the intensity data points and of the recent tectonic activity, both the BSFZ and TF could represent the most likely sources for the 1829 Torre-vieja earthquake. Analysis of the length of both faults and fault segments onshore and offshore shows that almost all of the fault segments forming both BSFZ and TF are ca-pable of producing a magnitude in the range of the mag-nitudes estimated for the 1829 earthquake (Mw between 6.0 and 6.9). Nevertheless, the maximum magnitude is at-tained or exceeded in the BSFZ when the rupture involves the Guardamar and offshore segments (Mw 6.9) or the entire fault (Mw 7.1). Further studies are warranted to provide more insight into the recent Quaternary activity of both faults.
Acknowledgements. The authors are indebted to Domenico
Ri-dente, Juan Jos´e Mart´ınez D´ıaz and an anonymous reviewer whose helpful comments and suggestions have considerably improved the manuscript. Thanks are due to Daniela Pantosti for editing this manuscript. The authors acknowledge the support of the Spanish Ministry of Science and Innovation through National Projects IMPULS (REN2003-05996MAR), EVENT (CGL 2006-12861-C02-02) and SHAKE (CGL 2011-30005-2006-12861-C02-02); Acciones Complementarias EVENT-SHELF (CTM 2008-03346-E/MAR) and SPARKER (CTM 2008-03208-E/MAR); and ESF TopoEurope TOPOMED project (CGL 2008-03474-E/BTE). We are grateful to the captain, crew and science party onboard the RV Garcia del Cid. Hector Perea was a researcher at IDL-UL Associated Laboratory under contract no. 3/2010/LAB IDL co-financed by the Portuguese FCT and FEDER and at UTM-CSIC under the Juan de la Cierva contract no. JCI-2010-07502 funded by the Spanish Ministry of Science and Innovation.
Edited by: D. Pantosti
Reviewed by: J. Martinez-Diaz, D. Ridente, and one anonymous referee
References
Albini, P. and Rodr´ıguez de la Torre, F.: The 1828–1829 earthquake sequence in the provinces of Alicante and Murcia (S-E Spain): Historical sources and macroseismic intensity assessment, in: The use of historical data in natural hazard assessments, edited by: Glade, T., Albini, P., and Frances, F., 35–53, 2001.
Alfaro, P.: Neotect´onica en la Cuenca del Bajo Segura (Cordillera B´etica Oriental), PhD Thesis, Universidad de Alicante, Alicante, 217 pp., 1995.
Alfaro, P., Est´evez, A., Moretti, M., and Soria, J. M.: Structures s´edimentaires de d´eformation interpr´et´ees comme s´eismites dans
le Quaternaire du bassin du Bas Segura (Cordill`ere b´etique ori-entale), C. R. Acad. Sci. Paris, 328, 17–22, 1999.
Alfaro, P., Andreu, J. M., Delgado, J., Estevez, A., Soria, J., and Teixid´o, T.: Quaternary deformation of the Bajo Segura blind fault (eastern Betic Cordillera, Spain) revealed by high-resolution reflection profiling, Geological Magazine, 139, 331– 341, 2002a.
Alfaro, P., Delgado, J., Est´evez, A., Soria, J. M., and Y´ebenes, A.: Onshore and offshore compressional tectonics in the east-ern Betic Cordillera (SE Spain), Marine Geology, 186, 337–349, 2002b.
Alfaro, P., Bartolom´e, R., Borque, M.J., Est´evez, A., Garc´ıa-Mayordomo, J., Garc´ıa-Tortosa, F. J., Gil, A. J., Gr`acia, E., Lo Iacono, C., and Perea, H.: The Bajo Segura Fault Zone: Active blind thrusting in the Eastern Betic Cordillera (SE Spain), Jour-nal of Iberian Geology, 38, 271–284, 2012.
Archivo T´ecnico de Hidrocarburos: http://hidrocarburos.mityc.es/ ath/, last access: 27 June 2012.
Argus, D. F., Gordon, R. G., DeMets, C., and Stein, S.: Closure of the Africa-Eurasia-North America Plate Motion Circuit and Tectonics of the Gloria Fault, J. Geophys. Res., 94, 5585–5602, 1989.
Bisbal, L.: Estudio de la distribuci´on de intensidades s´ısmicas en el ´ambito valenciano. Sus incidencias en las obras p´ublicas. Tomo V: Estudio monogr´afico de la serie s´ısmica del 23-3-1748 al 8-4-1748 con epicentro en Estubeny (tradicionalmente llamado ter-remoto de Montesa), Universitat Polit`ecnica de Val`encia, 1984. Bousquet, J. C.: Quaternary strike-slip faults in southeastern Spain,
Tectonophysics, 52, 277–286, 1979.
Buforn, E., Sanz de Galdeano, C., and Udias, A.: Seismotectonics of the Ibero-Maghrebian region, Tectonophysics, 248, 247–261, 1995.
De Larouzi`ere, F. D., Bolze, J., Bordet, P., Hernandez, J., Mon-tenat, Ch., and Ott d’Estevou, Ph.: The Betic segment of the lithospheric Trans-Albor´an shear zone during the Late Miocene, Tectonophysics, 152, 41–52, 1988.
Delgado, J., Giner, J. J., L´opez Casado, C., and Auernheimer, C.: An´alisis de la respuesta del suelo en intensidades. Aplicaci´on al terremoto de Torrevieja, in: Problem`atica geoambiental y desar-rollo. V reuni´on nacional de geolog´ıa ambiental y ordenaci´on del territorio II, edited by: Ortiz, R., 627–636, 1993.
DeMets, C., Gordon, R. G., Argus, D. F., and Stein, S.: Current plate motions, Geophys. J. Int., 101, 425–478, 1990.
Focault, A.: ´Etude g´eologique des environs des sources du
Guadalquivir (provinces de Jaen et de Grenade, Espagne m´eridionale), PhD Thesis, University of Paris VI, 633 pp., 1974. Galbis, J.: Cat´alogo s´ısmico de la zona comprendida entre los meridianos 5E y 20W de Greenwich y los paralelos 45N y 25N, Instituto Geogr´afico Catastral y de Estad´ıstica, Madrid, 807 pp., 1932.
Garc´ıa-Mayordomo, J. and Mart´ınez-D´ıaz, J.J.: Caracterizaci´on s´ısmica del anticlinorio del Bajo Segura (Alicante): Fallas del Bajo Segura, Torrevieja y San Miguel de Salinas, Geogaceta, 40, 19–22, 2006.
Garc´ıa-Mayordomo, J., Insua-Ar´evalo, J. M., Mart´ınez-D´ıaz, J. J., Jim´enez-D´ıaz, A., Mart´ın-Banda, R., Mart´ın-Alfageme, S., Alv´arez-Gomez, J. A., Rodr´ıguez-Peces, M., P´erez-L´opez, R., Rodr´ıguez-Pascua, M. A., Masana, E., Perea, H., Mart´ın-Gonz´alez, F., Giner-Robles, J., Nemser, E. S., Cabral, J., and the
QAFI Compilers Working Group: The Quaternary Active Faults DataBase of Iberia (QAFI v.2.0), Journal of Iberian Geology, 38, 285–302, 2012.
Gim´enez, J., Borque, M., Gil, A., Alfaro, P., Est´evez, A., and Suri˜nach, E.: Comparison of long-term and short-term uplift rates along an active blind reverse fault zone (Bajo Segura, Se Spain), Studia Geophysica et Geodaetica, 53, 81–98, 2009. Giner, J. J.: Sismicidad y peligrosidad s´ısmica en la comunidad
aut´onoma valenciana. An´alisis de incertidumbres, PhD Thesis, Universidad de Granada, 295 pp., 1996.
Giner, J. J., Molina, S., and J´auregui, P. J.: Sismicidad en la Comu-nidad Valenciana (C.V.), F´ısica de la Tierra, 15, 163–187, 2003. Grimison, N. and Cheng, W.: The Azores-Gibraltar plate boundary:
focal mechanisms, depths of earthquakes and their tectonic im-plications, J. Geophys. Res., 91, 2029–2047, 1986.
IGN: Cat´alogo de terremotos en el ´area de la Pen´ınsula Iberica e Islas Canarias (http://www.01.ign.es/ign/layoutIn/ sismoFormularioCatalogo.do), last access October 2011. Koulali, A., Ouazar, D., Tahayt, A., King, R. W., Vernant, P.,
Reilinger, R. E., McClusky, S., Mourabit, T., Davila, J. M., and Amraoui, N.: New GPS constraints on active deformation along the Africa–Iberia plate boundary, Earth Planet. Sci. Lett., 308, 211–217, 2011.
Lanaja, J. M., Querol, R., and Navarro, A.: Contribuci´on de la ex-ploraci´on petrol´ıfera al conocimiento de la Geolog´ıa de Espa˜na. IGME, Madrid. 465 pp., 1987.
Larramendi, J. A.: Memoria y relaci´on circunstanciada de los estra-gos que la terrible cat´astrofe de los terremotos de 21 de Marzo y siguientes, principalmente el S´abado Santo 18 de Abril hasta el presente d´ıa, han causado en Torrevieja y dem´as pueblos de la Gobernaci´on de Orihuela y sus inmediaciones, en la ciudad de Murcia y algunos pueblos de este nombre, Imprenta Real, Madrid, 24 pp., 1829.
Lo Iacono, C., Sulli, A., Agate, M., Lo Presti, V., Pepe, F., and Catalano, R.: Submarine canyon morphologies in the Gulf of Palermo (Southern Tyrrhenian Sea) and possible implications for geo-hazard, Marine Geophys. Res., 32, 127–138, 2011. L´opez Casado, C., Est´evez, A., Pina, J., and Sanz de Galdeano, C.:
Alineaciones sismotect´onicas en el sudeste de Espa˜na, Ensayo de delimitaci´on de fuentes s´ısmicas, Serie de Estudios Geol´ogicos, 6, 5–39, 1987.
L´opez Casado, C., Peinado, M. A., Delgado, J., Pel´aez, J. A., and Fuentes, C.: La serie s´ısmica de Torrevieja de 1828 y 1829, I Congreso Iberoamericano sobre t´ecnicas aplicadas a la gesti´on de emergencias para la reducci´on de desastres naturales, Valencia, 1992.
L´opez Marinas, J. M.: Sismo del 21 de Marzo de 1829, Madrid, 1976.
Mart´ınez Solares, J. M. and Mezcua, J.: Cat´alogo s´ısmico de la Pen´ınsula Ib´erica (880 a.C. – 1900), Instituto Geogr´afico Na-cional – Monografia no. 18, 444 pp., 2002.
Mezcua, J.: Cat´alogo general de isosistas de la Pen´ınsula Ib´erica, IGN, Madrid, 320 pp., 1982.
Montenat, C.: Les bassins n´eog`enes et quaternaires du levant d’Alicante `a Murcie (Cordill`eres B`etiques Orientales, Espagne), Stratigraphie, pal´eontologie et ´evolution dynamique, PhD The-sis, Laboratoire G´eologique, University of Lyon, 345 pp., 1977. Montenat, C., Ott D’Estevou, P., and Coppier, G.: Les bassins