DISI - Via Sommarive, 14 - 38123 POVO, Trento - Italy http://disi.unitn.it
ResEval: A Mashup Platform for
Research Evaluation
Muhammad Imran, Florian Daniel, Fabio Casati,
Maurizio Marchese
September 2010
Abstract
Bibliometrics has changed out the way the research evaluation con-ducted, and it is widely used to evaluate research groups, individual research’s, department and many more. However establishing fair cri-teria to evaluate the scientific community, as well as individual pub-lications and researcher, is a tough task and constitutes a challenge that has not been achieved yet. This paper addresses the problem of research evaluation and introduces ResEval, a mashup platform that enables the creation of customize metrics and their computation in order to make the scientific evaluation easier. This platform addresses various problems with current approaches such as data incomplete-ness, flexibility in defining new metrics, fixed UI restrictions for the customization of metrics and to apply filters.
Keywords: mashups, research evaluation, bibliometrics
1
Introduction
The evaluation of researchers and research artifacts (e.g., a scientific paper) is important for a variety of reasons, ranging from hiring and promotion (for people)[1] to selection of contributions (for journals or conferences) and to searching for interesting content within an ocean of scientific knowledge. However, there is little consensus today on how research evaluation should be done, and it is commonly acknowledged that the quantitative metrics avail-able today are largely unsatisfactory. Indeed, today people evaluate research contributions mainly through publication in venues of interest and through citation-based metrics (such as the h-index), which attempt to measure re-search impact. While these metrics are typically considered to be better than nothing, currently significant compilations of research indicators heavily rely on contributions and citations and some other sophisticated techniques. These techniques mainly rely on citation analysis which is used to evalu-ate research performance of individual researcher as well as research groups. However there are different opinions on how citation statistics would be used, and they have well-known flaws. For instance[3] pointed out shortcomings, biases, and limitations of citation analysis.
In ECSS last year and in other papers [2] we showed that peer review (todays gatekeeper for publications) is essentially applicable only to filter clearly bad papers, and many studies show that (i) citations are to a very
large extent affected by the effort made by the authors to promote the pa-per, and (ii) the cited papers are rarely read by the citing authors [4, 5]. Furthermore, current metrics are limited to papers as the unit of scientific knowledge, while today there are many other artifacts that do contribute to science, such as blogs, datasets, experiments, or even reviews, but that are not considered for research evaluation. In this paper we describe our ideas, preliminary results, and ongoing work on a mashup platform for research evaluation.
Besides the flaws of current metrics, the fact remains that people have - and we believe will always have - different opinions on which criteria are more effective than others, also depending on the task at hand (that is, the reason why they are conducting the evaluation). For example, in our de-partment, the evaluation criteria for researchers are defined in a detailed document of 10 pages full of formulas and are mostly based on publications in venues considered important in the specific community and normalized following some shared and agreed criteria. Other institutions use citation counts normalized by the community to which the authors belong and then grouped by research programs to assess each research group, not individuals. Examples are countless and, much like in the soccer world cup, everybody has an opinion on how it should be done. Not only people may select dif-ferent metrics, but also difdif-ferent sources (e.g., Google Scholar1 vs. Scopus2), different normalization criteria (e.g., normalizing the value of metrics with respect to averages in a given community), different ways to measure individ-ual contributions (e.g., dividing metrics by number of authors), or different ways to compare (e.g., compare a candidate with the group that wants to hire them to assess the autonomy and diversity of the candidate from the group), with different aggregation functions (e.g., aggregated h-index of a scientists co-authors, aggregated citation count, etc.).
For example, in order to assess the independence of young researchers, we typically look at which contributions the researcher has published without the cooperation of his/her PhD supervisor, and whether he/she was able to publish on new topics independently. As a more detailed analysis, we might, for instance, want to measure the h-index of the researcher without considering papers co-authored by the supervisor, and then compare the cleaned h-index with that of other young researchers in the same field. In
1http://scholar.google.com
order to evaluate the supervisor, instead, we might want to compute his/her impact on the h-index of all his/her PhD students, that is, the aggregated h-index values of all papers co-authored with the supervised PhD students. Of course, the sum of h-index values is not an h-index again, but we can still use the result as a measure of the supervisors capability to (i) attract PhD students (in terms of quantity) and (ii) produce high-quality PhDs.
These observations and examples suggested us the following approach to address the problem of research evaluation and provide a platform for it:
1. We need to provide a platform that allows the computation of a variety of scientific metrics from a variety of sources.
2. We believe that people will want to define their own metrics and these metrics can be very complex. Therefore, we need to enable each person to define the metric computation logic, including the specification of the logic, the sources, the normalization, the aggregation criteria, the comparisons desired and the like.
3. In addition to the above, while the platform above should allow one to include publication and citations as basic metrics and operators, we need a way to provide the means to have alternative metrics that better reflect the opinion and reputation of scientist and contributions with respect to what peer review and citation count do.
In the following paper we focus on the first two items. For the third aspect (which is orthogonal to the issue of defining a platform for research evaluation as it refers to having another base metric in addition to the tra-ditional ones), we refer the reader to our work on liquid journals described at liquidjoural.org.
2
Reseval Concepts and Model
To support research evaluation, we propose a domain-specific information mashup language and platform through which users (possibly with no pro-gramming skills) can define, execute, and visualize the metric combination logic and its result.
We provide a mashup platform, because we expect users to need to com-bine both UI components (widgets that can show charts and trends) and information from a variety of (web) sources. We aim for a domain-specific
language because we believe the only way in which we can have a mashup platform that can be used by non-programmers is to constrain the concepts and possibly even the functionality of the platform for the sake of ease of use. Finally we talk about information mashup as we see the platform not so much as a generic composition tool (a la BPEL) but more like a pipe that channels, filters, cleans, aggregates, and transforms information flowing from sources (e.g., repositories of publications such as DBLP3 or Springer4, or
Liquid Journals5) to obtain indicators corresponding to the desired scientific
metrics.
We now describe the main elements of the language and of the platform. ResEval provides to its users a mashup model that consists of the following entities:
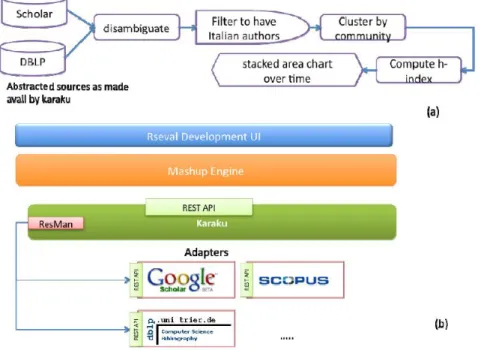
Figure 1: ResEval (a) mashup modeling example and (b) architecture
• Data sources (and an associated model, which is a subset of the Re-sEval model) that provide the appropriate input to the specific metric
3http://www.informatik.uni-trier.de/∼ley/db/ 4http://www.springer.com/
computation (i.e., publication metadata, like authors, affiliations, title, citation, etc.);
• Operators that allows the extraction, elaboration and aggregation of the information as well as the definition of specific and personalized metrics;
• A set of filters that support the transformations of the information; UI components that support the interaction with the final users and the visualization of the computed metric;
• Flow pipes that allow the user to interactively define the flow and transformation of the selected information from the data sources; • A conceptual model that fixes the main concepts and operators used in
the platform. This is part of the essence of the mashup being domain-specific, as discussed later. The model is materialized via an ER dia-gram (processed by ResEval components) and XML schemas that de-fine the structure of the information flowing through the pipes.
Figure 1 shows a simple example where sources, operators, filters, and UI components are used to compute a metric, Figure 1(b) a first draft of the ResEval architecture.
The data source components constitute the bridge between the ResEval domain-specific world and the Web at large. Because all information on sci-entific dissemination and the reputation is available on the Web (but not always as a service with an API), we need a way for ResEval to access this information. This implies having a layer that exposes Web sources as ser-vices, and in particular as data sources available to ResEval users. This is a complex endeavor because Web sources keep changing, they are intrinsi-cally heterogeneous and not all of them expose standard software interfaces on the Web (such as SOAP or RESTful services). To bridge this gap we developed Karaku6 and its engine Resman7, a tool that facilitates
expos-ing web applications as services with a stable API and that also provides caching and crawling of scientific entities (e.g., papers as contributions, jour-nals as collections) to relieve the users of the sources from these tedious tasks.
6http://project.liquidpub.org/karaku/ 7http://project.liquidpub.org/resman/
Furthermore, Karaku allows exposing these sources in accordance with the conceptual model of ResEval.
Incidentally this implies that the effort of adding new sources is depen-dent on programmers to write a wrapper for each source in order to provide services to upper layers. We also assume that expert developers will provide a library of components (such as filters, operators) and make them available to the final users. Final users will instead develop the mashup flows (the metric computation logic).
3
Status
The current public version of ResEval (http://reseval.org) does not yet make available the complete mashup platform. For the time being it allows to com-pute a predefined set of metrics on top of Karaku, and it allows for creation and comparison of groups of researchers with these metrics. It provides above mentioned exiting metrics and it is continuously increasing its performance and coverage in the sense of data sources. ResEval is a tool for evaluating re-search contributions and rere-searcher by using citation based indicators. These indicators include popular citation based metrics such as h-index, g-index, noise ratio, citation count. More importantly, this tool allows one to separate citations from self-citation, that is citations coming from the author itself. Moreover, ResEval provides other functionalities, as the possibility to find top co-authors and top citers of a researcher. In our current work we will progressively begin to release on reseval.org both the initial mashup platform as well as functionality to combine information from other sources to define new metrics.
References
[1] Bertrand Meyer, Christine Choppy, Jrgen Staunstrup, Jan van Leeuwen. Research evaluation for computer science, 2008.
[2] F. Casati, M. Marchese, K. Mirylenka, and A. Ragone. Re-viewing peer review: a quantitative analysis of peer review. http://eprints.biblio.unitn.it/archive/00001813/, Feb. 2010.
[3] A. Chapman. Assessing research: citation count shortcomings. The Psy-chologist, 2:336–44, 1989.
[4] A. Haque and P. Ginsparg. Positional effects on citation and readership in arXiv. Journal of the American Society for Information Science and Technology, 60(11):2203–2218, 2009.
[5] M. Simkin and V. Roychowdhury. Stochastic modeling of citation slips. Scientometrics, 62(3):367–384, 2005.