Journal of Electroanalytical Chemistry 498 (2001) 117 – 126
Advances in multiple square wave techniques for ion-exchange
voltammetry at ultratrace levels: the europium(III) case
Ligia M. Moretto
a, Jean Chevalet
b, Gian Antonio Mazzocchin
a, Paolo Ugo
a,*
aDepartment of Physical Chemistry, Uni6ersity of Venice, S. Marta
2137, I-30123Venice, Italy
bLI
2C, Laboratoire d’Electrochimie, Uni6ersite´ P. et M. Curie, UMR7612CNRS, boite51,4place Jussieu,75252Paris Cedex05, France Received 30 March 2000; received in revised form 31 July 2000; accepted 31 July 2000
In honour of Fred Anson for his dedication to and excellence in the field of electrochemistry.
Abstract
This paper reports on the use of multiple square wave voltammetry, MSWV, for the determination of europium(III) preconcentrated by ion-exchange at glassy carbon electrodes coated with Nafion®. For this aim, a double-differential (DD) mode
of MSWV is implemented; with this mode, background signals are always straight lines while the analyte signal is given as a twin opposite peak system which corresponds approximately to the instrumental double differential of the classical voltammetric wave. The influence of scan parameters and experimental conditions on MSW-DD responses for europium(III) determinations at the modified electrode is examined. Detection limits and sensitivities obtained using MSW-DD are significantly superior to those achievable by classical pulsed techniques. The method is applied to the determination of ultratrace europium(III) concentrations in the 10− 11– 10− 10 M range in the cooling water of a nuclear plant; results obtained by the MSW-DD ion-exchange
voltammetric approach compare well with those obtained by ICP-MS. © 2001 Elsevier Science B.V. All rights reserved.
Keywords:Nafion®; Europium; Ultratrace analysis; Multiple pulse; Ion-exchange; Voltammetry
1. Introduction
With the continuing effort of developing more sensi-tive electroanalytical methods suitable for ultratrace analysis, new possibilities have been opened up by the use of electrodic systems able to preconcentrate and detect selectively low concentrations of the analyte, as in the case of polymer coated electrodes [1,2], which have found wide electroanalytical application in a vari-ety of fields giving rise to a new sensitive technique named ion-exchange voltammetry (IEV) [3 – 5]. The pre-concentration capabilities of electrodes modified with coatings of ion-exchangers can be better exploited for electroanalytical purposes when coupled to new instru-mental techniques able to increase the signal to noise ratio and to lower detectable concentrations even below the (good) limits already reachable by using ‘classical’ pulsed techniques, such as differential pulse
voltamme-try and Osteryoung’s square wave voltammevoltamme-try. Pro-gress in this direction has recently come from the application of a new pulsed technique named multiple square wave voltammetry (MSWV) [6,7].
MSWV is based on the principle of repeated addition of the integrated transient currents produced after each transition of a multiple potential step sequence applied at the electrode [6,7]. MSWV is a multi-pulse technique which implies a combination of a square wave signal with a staircase waveform, the latter scanning the entire domain of electroactivity of the system under analysis. This perturbation mode is similar to Barker’s square wave voltammetry [8,9] with the difference that onto each step of the staircase, more than one pair of square pulses of opposing sign are applied. Proper sampling of the charge during the pulse sequence allows the im-provement of the signal to noise ratio so that it is possible to achieve detection limits lower than those obtained with conventional pulsed techniques. It was shown that this technique enhances the signal to noise ratio and the sensitivity [10,11] mostly because of the
* Corresponding author: Fax: + 39-041-2578594.
E-mail address:[email protected] (P. Ugo).
0022-0728/01/$ - see front matter © 2001 Elsevier Science B.V. All rights reserved. PII: S 0 0 2 2 - 0 7 2 8 ( 0 0 ) 0 0 2 9 9 - 0
averaging effect of the repeated perturbations and of the enhanced separation of the faradic and capacitative currents. It can be successfully applied for trace analysis even in complex samples [11 – 14].
More recently, it was shown that multiple square wave ion-exchange voltammetry at Nafion® coated
electrodes allows determination of the methylmercury cation in aqueous solutions at significantly low (nanomolar and even subnanomolar) concentration lev-els [15]. For this purpose, and more generally for all measurements at trace concentration levels, a new MSWV mode called double differential square wave (MSW-DD where DD is double differential) has been implemented and successfully applied.
MSW-DD performs combinations of summations and differences of the integrals of the multiple tran-sients in correlation with the polarity of the transitions and with the inversion of the superimposed square wave signal of amplitude DEamp. The response of this
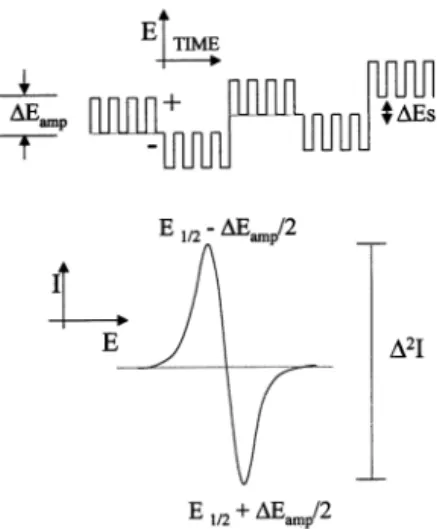
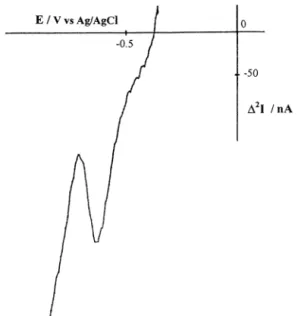
particular mode of MSW-DD has the shape of the first derivative of the usual mode (i.e. second derivative of the polarographic wave) and offers a further increase in the signal to noise ratio. A schematic drawing of the waveform used in MSW-DD and the response obtained for a reversible one-electron process is sketched in Fig. 1. For the reversible case, the twin peaks of opposite sign appear at potentials equal to (E1/2−DEamp/2) and (E1/2+DEamp/2), respectively.Note that the amplitudes
of the responses are presented using the nanoampere scale, not charges as would be expected from the princi-ples of MSWV. This comes from an instrumental pro-cedure which calculates the average value of all the
transient currents at each potential step of the staircase. The sum of the recorded charges is in fact normalised with respect to the sum of integration times; therefore the output is the current given by Eq. (1):
D2I = 1/NS(Q/T
int) (1)
where Tintis the integration time applied to each
tran-sient;D2I is used to indicate that the signal corresponds
really to the double derivative of I.
If such a normalisation were omitted, all measure-ments would stay numerically directly affected by the value of N. What is relevant from an analytical point of view is that the responseD2I is directly proportional to
the concentration of the electrochemical species. The baseline of MSW-DD becomes a flat back-ground line at a nearly zero charge value for concentra-tions down to ppb level (using e.g. anodic stripping voltammetry), while in the worst cases, as in ultra trace analysis far below the ppb range, the baseline of the DD response is (close to) a sloping straight line. It is important to mention that the double level of deriva-tion of MSW-DD is produced in real time using only specific arrangements of the transient charges, i.e. oper-ating directly on the physical elements of the electrical response and without any subsequent mathematical treatment. This result is close to the response that would give the operation of derivation (numerical) of the baseline of the normal MSWV response which is (close to) a parabola (as well as for SWV, under similar conditions), however the added ‘noise’ is much less with the DD mode. The quasi-linear background component obtained by MSW-DD is then easy to subtract or to compensate for during the potential scan and this al-lows further improvement of the real sensitivity of the measurement.
In practice, MSW-DD acts, at a first level, on the non-faradic components of the electrochemical re-sponse, leaving a quasi-linear baseline which remains practically unchanged during a set of experiments (pro-vided that no major modification of the electrolyte solution occurs). This allows one to obtain accurate significant determinations by a simple direct peak to peak measurement even for very low concentration applications. At another level, as well as MSWV, the DD mode performs a fast real time filtering and averag-ing for each data point of the voltammogram; this is due to the procedure (repeated integration, etc.) of the measurement itself. The corresponding time window (10 ms to 100 ms) is such that the main noises which may pollute the faradic component (electrochemical and me-chanical fluctuations, electrical perturbations due to non-ideal signals and circuits, own noise of the closed loop potentiostatic system and current conversion am-plifiers, etc.) are strongly damped.
When working with analytical methods for the deter-mination of subnanomolar concentrations, great care
Fig. 1. Schematic drawing of the sequence of pulses and the response obtained for a MSW in the double differential mode (MSW-DD) for a reversible one-electron redox process. The sequence is reduced to
N = 4. The sum of the element of charges corresponding to theDE+
pulses produces one component of the response; the other one comes from theDE− part of the signal. The final response is the sum of these two components. DEs pulse height of the staircase; DE pulse
must be taken in order to avoid artefacts coming from possible sample contamination or analyte losses caused, for instance, by adsorption of the analyte on the vessel walls or by its volatilisation. With respect to such constraints, even using all possible experimental care, methylmercury does not represent the best choice. It is in fact volatile and tends to adsorb on hydropho-bic surfaces [16]. The influence of this limitation for the determination of the detection limits of MSW-DD was clearly stated in Ref. [15].
The analyte of choice for testing the level of perfor-mances of the MSWV-Nafion®coated electrode
combi-nation should be a multiple-charged cation of well known and, possibly, simple electrochemical be-haviour, which is preconcentrated by Nafion® and
which is not usually widespread as a possible source of contamination (at ultratrace levels) of the glassware or of the laboratory atmosphere. On the basis of this statement and on previous experience gained in our laboratory [17,18], Eu(III) was chosen as a target ana-lyte on which to test the limit of the performance offered by the MSW-IEV approach.
It was recently shown, in fact, that europium(III) is preconcentrated efficiently at Nafion® coated
elec-trodes [17]. At the modified electrode this rare earth cation undergoes a (quasi-)reversible one-electron re-duction process and the analytical performances of the ion-exchange voltammetric determination of Eu3 +
(and of ytterbium as well) are improved by using differential pulse detection of the preconcentrated ana-lyte [18]. A detection limit of 3 × 10− 8 M was
ob-tained.
In a recent preliminary note [19], we have shown that the preconcentration capabilities of Nafion®
to-wards Eu(III) in water solutions are superior to those of other cation exchangers such as the Eastman Kodak AQ55. It was also shown that the use of MSW-DD at Nafion® coated electrodes allows an improvement of
trace europium determination, pushing the detection limit below the nanomolar concentration level.
In this paper we present the results of a study aimed at clarifying the role of the MSWV parameters on the double differential responses gained for the system un-der study and to optimise the method for ultratrace analysis in real samples.
It is worth pointing out that such an effort can find a variety of applications linked to the widespread inter-est in europium determination related to its use in many advanced technological applications [20], as well as in biological, geochemical and environmental studies [21,22]. With the aim of testing the relevance and the potentialities of this new technique in such fields of high interest, we present in this paper an application of the MSW-DD-IEV method to the determination of
ultratrace europium in the cooling waters of a nuclear plant.
2. Experimental
2.1. Chemicals and procedures
All chemicals used were of analytical grade quality, apart from NaCl, HCl and CH3COONa which were of
Suprapur® grade (Merck). Europium solutions were
prepared by dissolving the proper amount of EuCl3·6H2O (Aldrich) or using europium 1000 ppm
standard solution (Merck).
Milli-Q water was used throughout to prepare the solutions. The measurements were performed in a clean laboratory, under a Class 100 laminar flow hood. All electroanalytical measurements were carried out at room temperature (2291°C) under a nitrogen atmo-sphere. A conventional single compartment cell equipped with a platinum coil counter electrode and a Ag AgCl KClsat reference electrode were employed. The working electrode was a PTFE shrouded glassy carbon disk (area 0.2 cm2) polished to a mirror finish
with graded alumina powder. The electrochemical cell was shielded from outer electric fields by a Faraday cage.
2.5% w/v Nafion® solutions were prepared by 1:1
dilution with methanol of 5% w/v Nafion® solutions
(Aldrich). Nafion® coated electrodes (NCE) were
pre-pared by droplet evaporation of 3 ml of the 2.5% w/v Nafion® (film coating 0.375 mg cm− 2 and film
thick-ness of 2 mm, calculated using 1.58 g cm− 3 as the
density of the wet Na+ form of Nafion® [23]).
Preconcentration of europium was carried out under open circuit conditions in stirred solutions.
Nuclear plant waters were sampled from the cooling system of a nuclear pool type reactor B&W design (IEA-R1, IPEN/CNEN-SP, Brazil). The reactor pool is divided in two sections: one is the core pool (where the core and irradiation facilities are located) and the other is the spent fuel pool, where the spent fuel storage is located [24]; sampling was carried out at 4 m from the reactor while it was operating at a power of 5 MW. The electrochemical measurements were carried out in 10 ml of the water sample, spiked with 0.1 M NH4Cl
and 0.2 M HCl up to a final concentration of 10− 3M
and 10− 4 M, respectively.
2.2. Instrumentation
Multiple square wave voltammetric experiments were carried out using a prototype instrument ‘MPulse’, controlled by its own software, which is currently un-der development for commercial production [10].
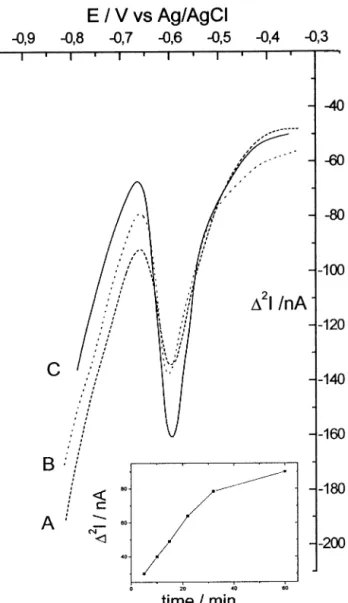
Fig. 2. Reduction scans recorded in MSW-DD at a NCE in 10 nM Eu3 +, 0.1 M NaCl, pH 4.0, for different incorporation times: (A) 5
min, (B) 20 min and (C) 60 min. Other experimental conditions: DEs= 5 mV,DEamp= 50 mV, N = 10, integration time 20 ms, initial
potential Ein= − 0.350 V. Insert: dependence of peak height (peak to
peak amplitude in current units) on the incorporation time.
3. Results and discussion
3.1. MSW-DD 6oltammogram
As shown in Fig. 2, when a NCE is dipped in a solution containing 10 nM Eu3 +, the progressive
in-crease of the MSW-DD signal with dipping time is observed. As shown in the insert, signals start to reach an asymptotically steady value at times longer than 30 min. Note that under these experimental conditions no signal is obtained in the explored potential region by using MSWV at an unmodified glassy carbon electrode or DPV at a NCE. The morphology of the DD re-sponse can be roughly explained as follows: the positive going and negative going parts of the peak (with respect to what would be the baseline) are approximately the respective signal responses to each part (positive and negative) of the sequence of pulses applied to the electrode; i.e. the pulses DEamp+ (as indicated in Fig. 1), if they were the only overimposed perturbation on a given Es, would produce a MSWV signal corresponding
to the positive going peak of Fig. 1 (or Fig. 2 as well); symmetrically theDEamp− alone would give rise to the
opposite (negative going) peak. The overall response in Figs. 1 and 2 is the sum of these components.
In practice, each point of the response signal (i.e. for one value of Es) is built from the integrals of the
transient currents taken as indicated in Figs. 4 and 5 (see below). The integrals are added sequentially, with a convenient sign for accumulating the passing charges, during the N pulses DEamp+ (positive part of the charge response) and during the N subsequent pulses DEamp− (negative contribution). This construction is
then a linear combination of elements (faradic charges) which are individually proportional to the bulk concen-tration of the analyte.
For this reason the easy to measure peak to peak amplitude in the DD mode is proportional to the concentration of the electroactive species when, of course, only simple electron transfer is involved, as for other electroanalytical pulsed methods.
It should be noted that the determination of the baseline in Fig. 1 is obvious, while in Fig. 2 it is much more difficult to define (unless a blank experiment is performed); however, quantitative measurement of the concentrations only requires the peak to peak ampli-tude, provided that between a series of experiments this baseline stays nearly unmodified.
The twin opposite peaks are located at potential values which are symmetrical with respect to E1/2. This
is confirmed by the agreement between the E1/2 value
calculated from the MSW-DD curves as E1/2= (Epf+
Epb)/2 (which gives − 0.660 V) and the E1/2 values
obtained by cyclic voltammetry at NCE in solutions containing higher europium concentrations [17]. The chronoamperometric curves were recorded with
a two channel oscilloscope Nicolet model 3091 (Nicolet Instrument Corporation, Madison, Wisconsin, USA). The rotating disk electrode unit was the EG&G Princeton Applied Research (PARC) model 636 elec-trode rotator.
For inductively coupled-plasma mass spectrometry (ICP-MS) measurements an Element instrument (dou-ble-focusing ICP-MS, Finnigan MAT, Bremen, Ger-many) was used. The instrument has predefined resolution settings of 300 (low-resolution mode, LRM), 3000 (medium-resolution mode, MRM) and 7500 (high-resolution mode, HRM) m/Dm (10% valley definition), which allow the signal of the analyte to be separated from those of most of the interferences.
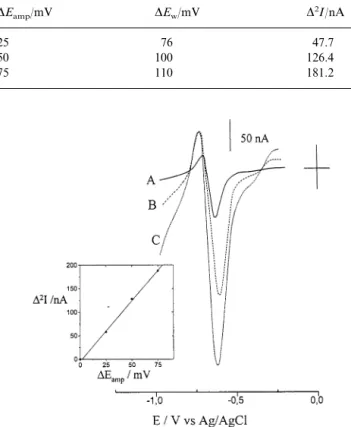
The peak to peak width measured experimentally (DEw) (see Table 1) results in higher than DEampvalues. This parameter in the MSW-DD pattern depends, in fact, on the number of electrons exchanged, n, and on the reversibility of the process. In the case of europium, the evidence that values are higher than DEamp agrees
with the quasi-reversible behaviour reported for the Eu3 + /2 + couple on glassy carbon electrodes [25,26]. As
shown in Fig. 3 and Table 1, the peak heights measured as the peak to peak amplitude on the current axis, increase linearly withDEamp. This agrees with previous literature findings obtained by applying MSWV in the normal mode at a HMDE for copper determination [27], and by applying MSWV in DD mode at a NCE for methylmercury determination [15]. Concerning the asymmetry in amplitude of the opposite peaks which appears in Fig. 3, it should be noted that even in the ideal case (reversible reactions under semi-infinite pla-nar diffusion) this asymmetric shape can be observed. In the present situation, which is far from the ideal case, the asymmetry could be ascribed to several possi-ble causes: difference in the diffusion coefficients of the
reduced and oxidised species, differences in the residual capacitive currents, depletion effects in the reaction layer, low reversibility and differences in the values of the transfer coefficients.
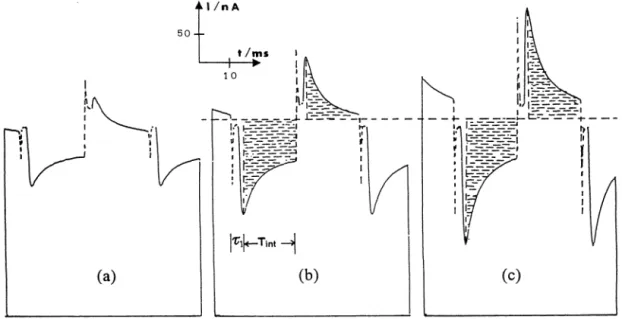
Fig. 4 shows the chronoamperometric decays of the currents for Eu3 + incorporated into a NCE, when
different DEamp values are applied. The current
dis-played is recorded after a delay time (~1) of 5.5 ms,
which allows the charging current (broken line) to decay. The capacitive decay is picked up on a test point of the instrument where shift and compensation are not total; the zero current is not shown on these diagrams. Note that in the instrument, the capacitive contribution is separated from the faradic content of the transient using a commutation in the sensitivity of the current measurement; a reduced sensitivity range is, in fact, applied during the short initial period (~1) to allow the capacitive charge to pass through without saturating the circuits, after that a high sensitivity is activated and the low faradic current component can be measured. This double scaling is clearly visible in Fig. 4 (and Fig. 5, see below).
Faradic currents decays give linear I versus t− 1/2
plots, indicating that in the pulse time scale used (typi-cally 5100 ms), charge transfer at the elec-trode Nafion® interface is diffusion controlled [28].
Note that at the modified electrodes, when the pulse time, tp, is too long the diffusion layer can widen so
much as to extend (theoretically) out of the thickness of the coating, ; this happens when tp]2p/Dapp, where
Dapp is the apparent diffusion coefficient which deter-mines the charge transfer process in the coating [4,28]. If this were the case, the current would not follow pure Cottrellian behaviour, but the transition from Cottrel-lian to thin-layer behaviour should be observed. Under our experimental conditions, considering that p:2
mm and Dapp(Eu3 +) = 1.2 × 10− 8 cm2 s− 1 [17], the
transition between semi-infinite linear diffusion and thin layer-like behaviour is expected to happen only for time pulses larger than 3.3 s.
As shown in Fig. 4, faradic chronoamperometric currents increase with the pulse amplitude. Since the signal being recorded in MSW-DD is really the charge sampled after ~1, it is clear that the increase in DEamp
reflects an increase in signals. On the other hand, the MSW-DD patterns in Fig. 3 show that the increase of DEamp produces more sloping baselines. The insert in
Fig. 3 shows that a compromise can be found in order to optimise the sensitivity with a flat baseline and small peak to peak width; in the case of nanomolar levels of europium, we considered that DEamp= 50 mV gives a
satisfactory response, with high D2I and flat enough
background signals.
Fig. 5 shows the effect of the pre-sampling time on the signals.~1should be long enough to allow the decay
of the charging current (full line), but not so long as to
Table 1
Effect ofDEampon the peak to peak width (DEw) and on the peak to
peak height (D2I) for MSW-DD of Eu3+at NCE; other experimental
conditions as in Fig. 3 DEamp/mV DEw/mV D2I/nA 47.7 76 25 100 50 126.4 110 75 181.2
Fig. 3. MSW-DD scans recorded at a NCE equilibrated in 50 nM Eu3 +, 0.1 M NaNO
3. DE values: (A) 25, (B) 50 and (C) 75 mV.
Other experimental parameters:DEs= 5 mV, N = 10, integration time
20 ms; Ein= − 0.250 V. Insert: dependence of peak height (peak to
Fig. 4. Chronoamperometric decays of currents recorded by an oscilloscope during a MSW-DD for differentDEamp: (a) 25 mV, (b) 50 mV, (c)
75 mV. Other experimental conditions as in Fig. 3. Note that the sensitivity on the Y axes during the pre-pulse time (charging current decay) is about 100 times less than the value used for recording the faradic current decay. Localisation of a pair of integrals is represented on the second part of the graph.
Fig. 5. Chronoamperometric decays of currents recorded by an oscilloscope during MSW-DD scans carried out using two different pre-sampling times: (a) 5.5 ms, (b) 10.0 ms. Other experimental conditions as in Fig. 3.
depress the faradic component of the signals (broken line). For Eu3 + determinations at NCE, we found 5.5
ms to be the best value for this parameter.
In principle, the effect of increasing the number of pulses, N, should be to increase the voltammetric sig-nal. However, by an instrumental procedure (see Eq. (1)), the signal is normalised by the number of pulses superimposed on each step of the staircase; as a result
the peak to peak height (faradic current) does not increase, but the noise (capacitive and background cur-rents) is minimised. As a consequence, the signal to noise ratio is increased and a better resolution of the voltammogram is reached. Fig. 6 shows the voltammet-ric response at a NCE in solution containing only the supporting electrolyte for different N values. The effect of the number of pulses in decreasing the slope of the
baseline is evident; however, increasing N increases the total scan time. Statistical evaluation of sets of scans in blank solutions at different N values is presented in Table 2. These data reveal that the experimental back-ground noise (|b), given as the standard deviation of 15 independent background current measurements, de-creases with increasing N; on the other hand, the scan time increases with the same parameter. Again a com-promise will drive the choice, which in our case, re-sulted in a N value of 15 (when the integration time applied during each pulse is set at 20 ms).
3.2. Optimisation of experimental conditions and
analytical parameters
In order to shorten the duration of the preconcentra-tion step, a rotating NCE was applied; in fact the enhancement of the mass transfer rate obtained by
Fig. 7. MSW-DD curves recorded at a NCE equilibrated in 0.3 nM Eu3 +, 0.1 M NH
4Cl. Other experimental parameters: DEs= 5 mV,
DEamp= 50 mV, N = 10, integration time 20 ms, Ein= − 0.250 V.
Fig. 6. MSWV voltammetric responses at a NCE in blank solution (0.1 M NaCl) for different N values. Other experimental parameters: DEs= 5 mV, DEamp= 25 mV, integration time 20 ms, Ein= 0 V.
operating under mixed convective – diffusive conditions should accelerate the achievement of the ion-exchange equilibrium. On the basis of previous studies [18], the ion-exchange preconcentration step was carried out at 2000 rpm. The time required to reach ion-exchange equilibrium conditions depends on the analyte concen-tration and this time increases when lowering the ana-lyte concentration [18]. From a qualitative point of view this can be explained by the fact that, under open circuit conditions, the rate of mass transport of the analyte from the solution to the polymer is driven by the concentration gradient existing between the bulk solution and the solution polymer interface (and gener-ated by the ion-exchange incorporation of the analyte); the lower is the bulk concentration, the smaller is this gradient. In the concentration range explored more deeply in the present work, i.e. in the nM range, a preconcentration time of 20 min at 2000 rpm is long enough to produce a steady signal.
Fig. 7 shows the MSW pattern recorded at sub-nanomolar europium concentration levels (namely 0.3 nM for Fig. 7); in this case the supporting electrolyte is 0.1 M NH4Cl. Signals increase linearly with the analyte concentration so that quantification of the concentra-tions can also be carried out at such low concentration levels. Table 3 compares the analytical parameters ob-tained using supporting electrolytes of different nature and concentration. The higher signals obtained using NH4+ agree with the pH buffering capability of this
cation which improves the reversibility of the reduction of rare earth cations at electrodes coated with Nafion®
[17]. The increase of signal with decreasing concentra-tion of supporting electrolyte is explained by the ion-ex-change nature of the preconcentration process itself; the
Table 2
Statistical evaluation of series of 15 scans at different N values, in MSW-DD at a NCE dipped in 0.1 M NaCl solution (blank); other experimental parameters: DEs= 5 mV,DEamp= 25 mV, integration
time 20 ms
Iaverage/nA |b/nAa Scan time/s
N 419 1 41.10 20 94 5.96 189 5 124 10 6.07 188 73.3 6.32 20 373 a|
b: standard deviation of 15 independent background
lower is the supporting electrolyte concentration, the less it competes with the analytes for the ion-exchange sites of Nafion®. The detection limit achieved using
10− 3 M NH
4Cl supporting electrolyte is remarkably
low.
On the basis of relevant E1/2 values and on the
preconcentration capabilities of Nafion® coatings, a
possible interference with the europium determination in water solutions could be Pb2 +. It was shown that
this cation is preconcentrated in Nafion® and gives
voltammetric signals centred around an E1/2 value not
too far from the E1/2 of the Eu3 + /2 + couple [15]. For
this reason the influence of the presence of increasing amounts of lead on the europium MSW-DD responses was investigated. Preliminary tests carried out in NH4Cl supporting electrolyte and Eu3 + and Pb2 +
solution concentrations in the nanomolar range showed that under these experimental conditions just one unre-solved MSW-DD twin opposite peak system is ob-served. Under these conditions, signals for the analyte (Eu3 +) and the interference (Pb2 +) are unresolved.
This situation changes dramatically when acetate is
added to the solution. Fig. 8 shows that under the latter experimental conditions (i.e. in the presence of acetate) two separated MSW-DD pairs of twin opposite peaks are observed. Increasing the amount of lead causes an increase of the system centred at about − 0.450 V, which therefore was attributed to the reduction of interfering lead. The increase of the concentration of lead really does not influenceD2I values relevant to the
Eu3 + /2 + system (centred at − 0.650 V) which increase
linearly with the europium solution concentration, at least until the level of excess Pb2 + is less than 50 times
the Eu3 +concentration. This evidence suggests that for
Eu3 + determination in samples containing significant
amounts of Pb2 +, the use of acetate electrolyte is
recommended; the different complexation of the two cations by acetate [29] is reflected in different shifts in relevant E1/2values, so that two separated peak systems are observed. It is worth noting that the peak to peak width (DEw) of the europium system is approximately double that of the lead system. This agrees with the above mentioned dependence of peak to peak potential width on the number of electrons exchanged, which is two for lead(II) reduction and one for europium(III) reduction.
3.3. Application to real samples
The suitability of the proposed method to the analy-sis of real samples was checked by determining the europium(III) concentration in the water from a pool type, light water moderated and graphite reflected re-search nuclear reactor. The pool water quality is excel-lent, the pH is kept between 5.5 and 6.5, the conductivity is around 2mS cm− 1and chlorides are less
than 0.5 ppm. Despite these excellent water characteris-tics, pitting corrosion can give rise to the presence of trace metals in this water. Among these, the presence of europium is of interest since it can be indicative of problems of corrosion in the spent fuel elements de-posited in the pool [24].
The procedure used for the analysis of the MSW-DD-IEV of the pool water is summarised as follows. 1. The water sample was acidified with HCl Suprapur to pH 4.0, bubbled with nitrogen in order to elimi-nate carboelimi-nate which can complex the Eu(III) ion [21], and then spiked with NH4Cl to give a final supporting electrolyte concentration of 10− 3M.
2. The ion-exchange preconcentration was carried out for 15 min in a stirred solution (400 rpm).
3. The NCE was conditioned by five potential scans from 0 to − 0.900 V using DEs= 10 mV, N = 1,
DEamp= 25 mV.
4. The measurement scan was carried out starting from − 0.350 V to − 0.800 V using the following MSW-DD parameters: DEs= 5 mV, N = 15, DEamp= 50
mV.
Table 3
Analytical parameters: background noise (|b), sensitivity (m) and
detection limits (DL) obtained for Eu3+determinations in MSW-DD
at a NCE using supporting electrolytes of different nature and concentration; other experimental conditions:DEs= 5 mV,DEamp=
50 mV, N = 15, integration time 20 ms
Supporting electrolyte |b/nA m/nA nM−1 DL/nM 59 6.25 0.1 M NaCl 0.30 4.10 0.1 M NH4Cl 123 0.10 6.32 0.001 M NH4Cl 1800 0.01
Fig. 8. MSW-DD voltammograms recorded at a NCE in 0.1 M NaCl, 5 nM Eu3 +, 200 nM Pb2 +, 0.1 M CH
3COONa, pH 4.0. Other
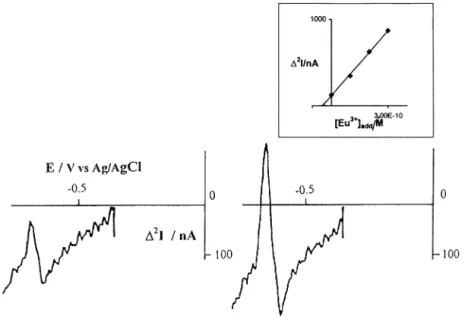
Fig. 9. MSW-DD voltammogram recorded at a NCE in a water sample from the cooling system of a nuclear reactor unspiked (left) and spiked (right) with 0.1 nM Eu3 +. In both cases the sample contained added NH
4Cl + HCl (final concentrations 10− 3 M and 10− 4M, respectively).
Other experimental parameters:DEs= 5 mV,DEamp= 50 mV, N = 15, integration time 20 ms, Ein= − 0.350 V, ion-exchange equilibration time
15 min. Insert: relevant standard additions.
The concentration of Eu(III) was quantified by stan-dard additions. Typical DD-voltammograms recorded in the IEA-R1 water sample before (left) and after spiking (right) with the europium standard solution are shown in Fig. 9; the insert in the figure presents the quantification of the analyte by standard additions. No interference from Pb2 + was found in these samples.
The europium concentration in the sample is (3.49 0.9) × 10− 11 M (average9|
n − 1, with n = 3).
As a comparison method, the concentration of eu-ropium in the same sample was analysed via ICP-MS spectrometry. The amount of europium present was determined with a calibration plot after subtracting the blank from the signal obtained for153Eu, and
consider-ing the contribution from the formation of barium oxides. These are the main spectral interferences which hamper accurate europium ICP-MS determination; in the samples analysed in this work (which contain 1 × 10− 8M Ba2 +) the role of such interference cannot be
neglected. After this correction, the amount of eu-ropium determined via ICP-MS was (2.290.4)×10− 11
M. Note that blank Eu concentrations was 1 × 10− 13
M (determined via ICP-MS). The good agreement be-tween MSW-DD-IEV data and ICP-MS data confirms the reliability and the high sensitivity of the MSW method.
4. Conclusions
The detailed analysis of the experimental parameters which determine voltammetric responses obtained by MSW-DD at Nafion® coated electrodes allowed
opti-misation of the ion-exchange voltammetric determina-tion of europium(III) at subnanomolar concentradetermina-tion levels. The method developed here has been applied for ultratrace europium determinations in real samples. The procedure used in order to optimise experimental parameters of the MSW-DD technique, can in princi-ple, be extended to a variety of analytical challenges involving the ultratrace electroanalysis of electroactive ions preconcentrated at electrodes modified with ion-ex-change coatings.
Acknowledgements
Financial support from MURST (Rome) and CRUI (Rome) is gratefully acknowledged. The authors thank IPEN-CNEN/SP Brazil for the nuclear reactor water sample and Dr C. Barbante (University of Venice) for kindly and competently performing the ICP-MS measurements.
References
[1] N. Oyama, F.C. Anson, J. Electrochem. Soc. 127 (1980) 247. [2] I. Rubinstein, A.J. Bard, J. Am. Chem. Soc. 102 (1980) 6641. [3] M.W. Espenscheid, A.R. Ghatak-Roy, R.B. Moore III, R.M. Penner, M.N. Szentirmay, C.R. Martin, J. Chem. Soc., Faraday Trans. I 82 (1986) 1051.
[4] P. Ugo, L.M. Moretto, Electroanalysis 7 (1995) 1105.
[5] P. Ugo, L.M. Moretto, S. Bellomi, V.P. Menon, C.R. Martin, Anal. Chem. 68 (1996) 4160.
[6] N. Fatouros, J.P. Simonin, J. Chevalet, R.M. Reeves, J. Elec-troanal. Chem. 213 (1986) 1.
[7] D. Krulic, N. Fatouros, J. Chevalet, J. Electroanal. Chem. 287 (1990) 215.
[8] G.C. Barker, A.W. Gardner, AERE Harwell, UK, Reports C/G 2297 (1958) G.
[9] G.C. Barker, A.W. Gardner, Analyst 77 (1952) 685.
[10] J. Chevalet, G.Y. Champagne, L. Gastonguay, R. Lacasse, M. Ladouceur, N. Fatouros, D. Krulic, J. Chim. Phys. 93 (1996) 804.
[11] G.Y. Champagne, J. Chevalet, International Patent pending, No. PCT/CA97/00593, 20 August 1997.
[12] R. Lacasse, G.Y. Champagne, L. Gastongay, M. Ladouceur, J. Chevalet, Report HydroQuebec, IREQ 97-207, December 1997. [13] R. Lacasse, L. Gastongay, M. Ladouceur, J. Chevalet, Report
HydroQuebec, IREQ 97-277, December 1997.
[14] R. Lacasse, G.Y. Champagne, L. Gastongay, M. Ladouceur, J. Chevalet, L.M. Moretto, Report HydroQuebec, IREQ 97-269 C, December 1997.
[15] L.M. Moretto, P. Ugo, R. Lacasse, G.Y. Champagne, J. Chevalet, J. Electroanal. Chem. 467 (1999) 184.
[16] M. Leermakers, P. Lansens, W. Baeyens, Fresenius J. Anal. Chem. 336 (1990) 655.
[17] P. Ugo, B. Ballarin, S. Daniele, G.A. Mazzocchin, J. Elec-troanal. Chem. 291 (1990) 187.
[18] P. Ugo, B. Ballarin, S. Daniele, G.A. Mazzocchin, Anal. Chim. Acta 244 (1991) 29.
[19] L.M. Moretto, B. Brunetti, J. Chevalet, P. Ugo, Electrochem. Commun. 2 (2000) 175.
[20] R.G. Bautista, N. Jackson (Eds.), Rare Earths, Resources, Sci-ence, Technology and Applications, TMS, USA, 1991. [21] J.-C.G. Bu¨nzli, G.R. Choppin (Eds.), Lanthanide Probes in Life,
Chemicals and Earth Sciences, Elsevier, Amsterdam, 1989. [22] C. Moulin, J. Wei, P. Van Iseghem, I. Laszak, G. Plancque, V.
Moulin, Anal. Chim. Acta 396 (1999) 253.
[23] K.A. Mauritz, C.J. Hora, A. Hopfinger, J. Polym. Prep. Am. Chem. Soc. Div. Polym. Chem. 19 (1978) 324.
[24] J.A. Perrotta, L.A.A. Terremoto, C.A. Zeituni, Ann. Nucl. Energy 25 (1998) 237.
[25] R. Lange, K. Doblhofer, W. Storck, Electrochim. Acta 33 (1988) 385.
[26] C.A. McDermott, K.R. Knetern, R.L. McCreery, J. Elec-trochem. Soc. 140 (1993) 2593.
[27] D. Krulic, PhD Thesis, Universite´ Paris 6, 1989.
[28] N. Oyama, A. Yamaguchi, Y. Nishiki, K. Tokuda, H. Matsuda, F.C. Anson, J. Electroanal. Chem. 139 (1982) 371.
[29] R.M. Smith, A.E. Martell, Critical Stability Constants, vol. 3, Plenum, New York, 1989.