QCL BASED PHOTOACOUSTIC SPECTROMETER
FOR FOOD SAFETY
L. FIORANI Fusion and Technology for Nuclear Safety
and Security Department Frascati Research Centre, Rome G. GIUBILEO Formerly at Fusion and Technology for Nuclear Safety
and Security Department and Security Department Frascati Research Centre, Rome
S. MANNORI, A. PUIU
Fusion and Technology for Nuclear Safety and Security Department
Frascati Research Centre, Rome W. SALEH
ENEA guest, Department of Physics, College of Science, University of Baghdad, Baghdad, Iraq
University of Baghdad, Baghdad, Iraq
RT/2019/1/ENEA
ITALIAN NATIONAL AGENCY FOR NEW TECHNOLOGIES, ENERGY AND SUSTAINABLE ECONOMIC DEVELOPMENT
L. FIORANI
Fusion and Technology for Nuclear Safety and Security Department Frascati Research Centre, Rome
G. GIUBILEO
Formerly at Fusion and Technology for Nuclear Safety and Security Department Frascati Research Centre, Rome
QCL BASED PHOTOACOUSTIC SPECTROMETER
FOR FOOD SAFETY
S. MANNORI, A. PUIU
Fusion and Technology for Nuclear Safety and Security Department
Frascati Research Centre, Rome
W. SALEH
ENEA guest, Department of Physics, College of Science, University of Baghdad, Baghdad, Iraq
RT/2019/1/ENEA
ITALIAN NATIONAL AGENCY FOR NEW TECHNOLOGIES, ENERGY AND SUSTAINABLE ECONOMIC DEVELOPMENT
I rapporti tecnici sono scaricabili in formato pdf dal sito web ENEA alla pagina www.enea.it I contenuti tecnico-scientifici dei rapporti tecnici dell’ENEA rispecchiano
l’opinione degli autori e non necessariamente quella dell’Agenzia
The technical and scientific contents of these reports express the opinion of the authors but not necessarily the opinion of ENEA.
QCL BASED PHOTOACOUSTIC SPECTROMETER FOR FOOD SAFETY L. Fiorani, G. Giubileo, S. Mannori, A. Puiu, W. Saleh
Abstract
The Diagnostics and Metrology Laboratory (FSN-TECFIS-DIM) of the Italian National Agency for New Technologies, Energy and Sustainable Economic Development (ENEA) applied for years photoacoustic spectroscopy with CO2 lasers to food safety. In order to make available to control authorities a por-table and user-friendly instrument, smaller lasers and automated controls are necessary. This report presents a new instrument, based on a QCL source, in which each measurement is fully managed by a dedicated software. Then, some characterizations of the whole system and its components are pro-vided. Finally, its first results in the framework of the Metrofood project are briefly described. Key words: QCL applications, Laser spectroscopy, Photoacoustic technique, Agro-food chain, Food safety
Riassunto
Il Laboratorio Diagnostiche e Metrologia (FSN-TECFIS-DIM) dell’Agenzia Nazionale per le Nuove Tec-nologie, l’Energia e lo Sviluppo Economico Sostenibile (ENEA) ha applicato da anni la spettroscopia fotoacustica con laser CO2 alla sicurezza alimentare. Allo scopo di rendere disponibili alle autorità di controllo uno strumento portatile e di facile utilizzo, sono necessari laser più piccoli e controlli auto-matici. Questo rapporto presenta un nuovo strumento, basato su una sorgente QCL, in cui ogni misura è completamente gestita da un software dedicato. Quindi, alcune caratterizzazioni dell’intero sistema e delle sue componenti sono fornite. Alla fine, i suoi primi risultati nel quadro del progetto Metrofood sono brevemente descritti.
Parole chiave: Applicazioni del QCL, Spettroscopia laser, Tecnica fotoacustica, Filiera agroalimen-tare, Sicurezza alimentare
1. Introduction
2. Instruments and methods 2.1 QCL emission profile 2.2 Cell frequency response 2.2 Signal linearity test 3. Results and discussion 4. Conclusions
Acknowledgements References
Appendix - Characteristics of the instrument components
7 8 8 9 10 11 13 14 15 16
INDEX
7 1. Introduction
The food safety testing market is expected to grow at a compound annual growth rate of 7.2% (2016-2021) [1] and is projected to reach 18.54 billion $ by 2022 [2]. A preceding report [3] tried to outline the main features of the global problem of food safety, whose importance explains why The Consumer Goods Forum [4] - organization that gathers consumer goods retailers and manufacturers - launched the Global Food Safety Initiative [5] that brings together key actors of the food industry to collaboratively drive continuous improvement in food safety management systems around the world.
The Diagnostics and Metrology Laboratory (FSN-TECFIS-DIM) [6] of the Italian National Agency for New Technologies, Energy and Sustainable Economic Development (ENEA) applied for years laser photoacoustic spectroscopy (LPAS) [7] to food safety. Up to now, CO2 lasers were used, as in the prototype developed in the framework of the SAL@CQO Project [8]. These sources are good candidates for this research because they are discretely tunable from 9 to 11 μm, inside the fingerprint region.
In recent years, QCLs1 [9] tunable in the fingerprint region have become commercially available. Although their power is still lower than CO2 lasers, they are significantly smaller and their tunability is continuous and broader, thus allowing to record spectra that provide more information on the sample.
Having in mind that control authorities that routinely verify food quality will greatly benefit from a portable and user-friendly system, we decided to develop a QCL based photoacoustic spectrometer fully managed by a dedicated software. In our mind, this prototype is an intermediate step toward a field instrument.
8 2. Instrume A block dia (cw) emitte photoacoust adiabatic ex by the micr meter by the Figure 1. B A dedicated min num and simply measuremen average of m 2.1 QCL em The QCL e mW) was a delivered. A wavelength ents and me agram of the ed by the Q
tic (PA) cell xpansion and rophone coup e beam splitt Block diagram o d software fu nimum wave mber of meas y start the in nt. Usually, microphone mission profil emission pro achieved at Although a s between 8.3 ethods e QCL based QCL is chop l. The radiati d pressure w pled with th ter. A person of the instrume ully manages length, maxi surements at nstrument fr each point o signals and t le
file has been 10.1 μm wi step of 0.1 μm 3 to 11.1 μm. d photoacous pped at an ion is absorb wave generati he lock-in am nal computer nt (cw: continu the spectra a imum wavele a given wav om the PC of the LPAS the average o n characteriz ithout chopp m has been . stic spectrom audio frequ bed by the sa ion. Acousti mplifier. A sm r (PC) contro uous wave. M: m acquisition. T ength and wa velength (eac that records spectrum (p of laser powe zed from 8.3 ping: if the c used in this meter is give uency and ir ample, with t c resonance mall part of ols the experi
microphone. PA
The user has avelength ste ch measurem s microphon photoacousti ers. 3 to 11.1 μm chopper is a characteriza n in Figure rradiates a the conseque amplifies th f the laser be iment. A: photoacousti s to input on ep, ment lasts 1 s) ne signal and c signal) is g m (Figure 2). activated, on ation, the sou
1. The conti food sample ent temperatu he signal tha eam is sent t ic. PC: personal the interface ), nd laser pow given by the . Maximum nly half of t urce can be t inuous wave e inside the ure increase, at is detected to the power l computer). e:
wer per each e ratio of the power (38.4 the power is tuned at any e e , d r h e 4 s y
9
Figure 2. QCL emission profile.
2.2 Cell frequency response
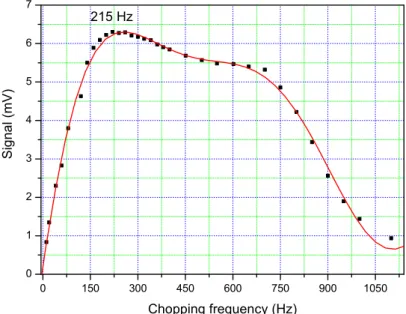
The cell frequency response has been determined measuring photoacoustic signal vs chopping frequency. A sample of charcoal powder2 has been irradiated at 10.1 μm (Figure 3). A 10× amplifier has been interposed between microphone and lock-in amplifier. Each point represents the average of 10 measurements. Each measurement lasts 1 s. A clear resonance at about 100-900 Hz can be observed. The maximum is at 215 Hz and the full width at half maximum (FWHM) is 800 Hz.
Figure 3. Microphone signal for a sample of charcoal powder vs chopping frequency.
2 The charcoal powder has been obtained by grinding for some minutes charcoal activated granules (Carlo Erba, Batch
Number Q1D099281F). 8,0 8,5 9,0 9,5 10,0 10,5 11,0 11,5 5 10 15 20 25 30 35 40 QCL emission profile current: 1100 mA Power (mW) Wavelength (m) 0 150 300 450 600 750 900 1050 0 1 2 3 4 5 6 7 215 Hz Signa l (mV) Chopping frequency (Hz)
10 2.2 Signal l The linearit sample of measuremen correlation c inearity test ty between t charcoal po nt lasts 1 s. T coefficient (R Figure4. Micr the micropho owder (Figur The microph R=0.991). rophone signal one signal an re 4). Each hone signal is for a sample of nd the laser h point repre s proportiona f charcoal powd power has b esents the a al to the laser
der vs laser pow
been tested average of 1 r power with wer. R: correlati at 10.1 μm 10 measurem h zero interce ion coefficient. irradiating a ments. Each ept and good a h d
3. Results a In the fram procedure w Sam mm The The corr 10 s Care has be 1. Cen 2. Fill 3. Che The task ass easily this g fortunately, The followi 1. Bas 2. Bas 3. Car 4. Met 5. NIS Six samples average of t and discussi ework of the was as follow mple prepara m thickness an e pellet was p e LPAS spe responding t spectra were een taken to: nter the laser l the sample h eck that the g
signed to our goal simply l principal co ing types of r smati sold by smati sold by rnaroli sold b trofood, ST. s of each typ the six measu
on e project Me ws: ation: grains nd 20 mm di put on the sa ectrum of ea to 26 measur e averaged. r footprint in holder. grain size of r lab was to looking at th omponent ana Figure 5. LP
rice flour hav y Eurospin, y Coop, by Eurospin, pe of rice w urements, wh etrofood [10] were grinde iameter (abo ample holder ach sample rements (1 s p the sample h the flour wa discriminate he LPAS spe alysis (PCA) PAS spectrum (l ve been exam were prepared hile each PC ], some type d for some m out 1 g). . was acquire per each mea
holder. as smaller tha e between dif ectra (even if ) [11] could e
left) and PCA (
mined: d and measu CA point (Fig es of rice flo minutes and ed from 8.5 asurement). an the laser f fferent types f it they were easily perfor (right) of differe ured. Each L gure 5 right) ur were anal pressed (12-to 11 μm w footprint. of rice. It w e normalized rm this assign
ent rice flours.
LPAS spectru corresponds lyzed. The m -15 tons) in with a step was impossibl d to their ma nment (Figur um (Figure 5 to one samp 11 measurement a pellet of 2 of 0.1 μm, le to achieve ximum) but, re 5). 5 left) is the ple. t 2 , e , e
12
4. Conclusions
A QCL based photoacoustic spectrometer has been developed at the Diagnostics and Metrology Laboratory (FSN-TECFIS-DIM) of the Italian National Agency for New Technologies, Energy and Sustainable Economic Development (ENEA).
At first, the LPAS instrument has been carefully examined: QCL emission, frequency response and signal linearity have been characterized. The conditions for optimum operation have been determined.
Then, some food samples have been measured and the photoacoustic spectrometer demonstrated its discrimination capability in the case of different types of rice flour.
This new system is an intermediate step toward the realization of a portable and user-friendly tool that would help control authorities to quickly verify food safety.
13 Acknowledgements
The authors are grateful to ENEA, in general, and Aldo Pizzuto, Roberta Fantoni and Antonio Palucci, in particular, for constant encouragement.
This work is the follow up of the SAL@CQO Project. The support by its coordinator (Luca Mangione) and its funder (Ministero dello Sviluppo Economico, Programma Industria 2015) is gratefully acknowledged.
14
References
[1] https://www.prnewswire.com/news-releases/global-food-safety-testing-market-report-2018-300600540.html
[2] https://www.marketsandmarkets.com/PressReleases/food-safety-testing-market.asp [3] L. Fiorani, G. Giubileo, L. Mangione, A. Puiu, W. Saleh, Food fraud detection by laser
photoacoustic spectroscopy, Technical Reports of the Italian National Agency for New
Technologies, Energy and Sustainable Economic Development (ISSN 0393-3016), Rome, Italy, RT/2017/41/ENEA (2017)
[4] https://www.theconsumergoodsforum.com/ [5] https://www.mygfsi.com/
[6] A. Palucci (ed.), 2017 Activity Report. Diagnostic and Metrology Laboratory, Italian National Agency for New Technologies, Energy and Sustainable Economic Development, Frascati (2018) [7] C. Haisch, Photoacoustic spectroscopy for analytical measurements, Measurement Science and
Technology 23 (2012) 012001 (17 pp.)
[8] G. Giubileo, I. Calderari, A. Puiu, High resolution spectroscopy of sweeteners, in P. A. Ribeiro, M. Raposo (eds.), Proceedings of the 3rd International Conference on Photonics, Optics and Laser Technology, Scitepress (2015) 91-95
[9] J. Faist, F. Capasso, D. L. Sivco, C. Sirtori, A. L. Hutchinson, A. Y. Cho, Quantum Cascade Laser, Science 264 (1994) 553-556
[10] http://www.metrofood.eu
15 Appendix - Characteristics of the instrument components
Pulsed and cw tunable mid-IR external cavity laser, model MIRcatTM
Operating Parameters Pulsed Laser CW Laser Operation Mode Pulsed only CW or Pulsed
Current Range Factory-set Factory-set
Laser Temperature Factory-set Factory-set
Relative Temperature Range Up to ± 5.0 °C Up to ± 5.0 °C
Cooling Requirements None Must use water cooler in CW mode
Beam Properties
Pointing Stability < 1 mrad < 1 mrad
Height Above Base 1.5” (38 mm) without pedestals 1.5” (38 mm) without pedestals
Profile Elliptical Gaussian, non-astigmatic Elliptical Gaussian, non-astigmatic
Minimum Spot Size < 2.5 mm < 2.5 mm
Beam Waist approximately 30 to 50 cm from laser approximately 30 to 50 cm from laser
Divergence < 5 mrad < 5 mrad
Pulsed Parameters
Pulse to Pulse Power Variation < 5% < 5%
Long Term (1 hr) Power Variation < 2% < 2%
Pulse Repetition Range 100 Hz - 100 kHz user selectable in 0.1kHz increments 100 Hz - 100 kHz user selectable in 0.1kHz increments Pulse Width Minimum 40 nsec 40 nsec
Pulse Width Maximum 500 nsec 500 nsec
Minimum Step Size 20 nsec 20 nsec
Duty Cycle 0.4 - 5% 0.4 - 5%
Tuning Parameters
Tuning Range Factory-set Factory-set
Center Wavelength Factory-set Factory-set
Maximum Tuning Rate Full Range < 1 sec Full Range < 1 sec
Set and Read Resolution 0.1 cm-1 0.1 cm-1
Absolute Accuracy ± 0.5 cm-1 ± 0.5 cm-1
Output Power (for max. operating current)
Peak Pulse Power Up to 350 mW Up to 350 mW
Average Power Min. 1 mW 1 mW
Average Power Max. Up to 50mW
Up to 50mW
(check with Daylight Solutions for your MIRcat configuration)
Line width
Line width Pulsed : < 1 cm-1 Pulsed : < 1 cm-1
CW : < 0.003 cm-1
Polarization
Linear > 100:1, vertically polarized, perpendicular to laser base > 100:1, vertically polarized, perpendicular to laser base
QCLs are a type of semiconductor laser which utilizes epitaxially grown quantum wells that contain electrons in lasing states. In a QCL the lasing transition occurs between states within a given quantum well. One advantage of this construction is that the electron responsible for the emission of the photon tunnels into the next quantum well and as a result, multiple photons can be generated by a single electron, thereby making them extremely efficient. The tunneling from one well to the next is where the term “quantum cascade” comes from. Furthermore, the well depths can be engineered by controlling layer depths during the fabrication process and hence the wavelength of the lasing transition is dependent on the physical structure of the device.
The gain profile of a quantum cascade laser can be quite broad (> 500 cm-1 in some cases). By providing monochromatic feedback - either through the use of distributed feed back or by constructing an external
16 cavity (ECq 0.00002 cm A.1. A number spectrum is transparent it possible t visible thro transmission applications illumination portion of th rich in info including e discriminati Figure A.2. qcL™) - the m-1 (~0.5 MH of applicatio s interesting at these wav to detect and ough the mi n exist in th s. Free-spac n are all enab
he spectrum ormation for explosives, n ion between Transmission o e free-runnin Hz). The ECq Figure ons have be because of velengths and d identify the id-infrared p he mid-IR an ce communi bled by QCL with a numb r those wishi nerve agents similar spec of light through ng linewidth qcL™ config e A.1. External en well serv f a combina d many speci em. Figure A portion of t nd can be ex ication, infr Ls at an appro ber of specie ing to probe s, and toxin ies are possib
the atmosphere of the emis guration emp cavity quantum ved by mid-ation of two ies of interes A.2 is a depic the electrom xploited to tr rared count opriate wave es placed wh e, detect, im ns. Detection ible.
e from the visib also indicated. ssion can be ployed at Da m cascade laser -IR quantum facts. The st have strong ction of the tr magnetic spe ransmit powe ermeasures, elength. Figu ere their stro mage, or qua n limits in
ble to the mid-IR . practicably aylight Solut design. m cascade las atmosphere g fundament ransmission ctrum. Sign ers at these remote im ure A.3 is a g ong absorptio antify these a the parts pe R. The sources narrowed to tions is show sers. This re is (at least tal absorption of the atmos nificant regio wavelengths maging, beac graph of the m ons occur. Th and many o er trillion r of the major ab o as little as wn in Figure egion of the t somewhat) ns that make sphere in the ons of high s for various coning, and mid-infrared he mid-IR is other species range and/or bsorptions are s e e ) e e h s d d s s r
[https://ww Figure A.3. ww.daylights . Graphical repr solutions.com resentation of th m/]
he location of sstrong absorptioons of moleculees of interest.
18
Thermoelectric chiller, model THERMOCUBE 200/300/400
Operating Range (Set Point)
5°C to 50°C standard
(down to -5°C with low temp option - LT)
(up to 65°C with high temp option – HT, 60°C for centrifugal pumps)
Ambient Temperature Range 0°C to 40°C non-condensing
Stability / Repeatability ±0.05°C with constant load (even near ambient)
Cooling Capacity (typical1) 200, 300 or 400 Watts @ 20°C in 20°C ambient air
1 Cooling capacity will vary with configuration.
Heating Capacity (typical) 400, 600 or 800 Watts @ 20°C in 20°C ambient air
Noise Level (at 1 meter) < 63 dBA (down to 49 dBA with “-VS” variable speed fan option)
Coolant / Process Fluid
Koolance (27% propylene glycol / water mix) or 27-50% ethylene glycol / water mix
Options available for PAO, Fluorinert / Galden or HFE (contact SSCS for advice on other fluids)
Process Fluid Fittings 1/4” John Guest standard (see options section for other fitting types)
Pumps Diaphragm, Centrifugal or gear pumps available
Tank Volume 300 ml with level sensor
Wetted Materials Aluminum, stainless steel and polymers or Copper, stainless steel and polymers (“-CU” option) Dimensions (L x W x H) 13” x 11” x 13” (32cm x 28cm x 32cm)
Weight 28 lbs (12.7 kg) – standard model
Power Input Universal: 115-230 VAC, 50/60 Hz, 7-5 amps max.
Controls Digital PID controller for heating and cooling
Communications Keypad or optional RS232 interface
Alarms Temperature, fluid level, system or component failure (display and RS232 option) Standards TUV listed to UL, CAN/CSA and EN 61010-1, CE 61010-1
19 Optical chopper, model SR540
Chop frequency 4 Hz - 400 Hz (5/6 slot blade) 400 Hz - 3.7 kHz (25/30 slot blade) Frequency stability 250 ppm/°C (typ.)
Frequency drift < 2 %, 100 Hz < ƒ < 3700 Hz
Phase jitter (rms) 0.2° (50 Hz - 400 Hz) 0.5° (400 Hz - 3.7 kHz)
Frequency display 4-digit, 1 Hz resolution and accuracy
Frequency control
10-turn pot with 3 ranges: 4 Hz - 40 Hz
40 Hz - 400 Hz 400 Hz - 3.7 kHz
Input control voltage 0 - 10 VDC for 0 - 100 % of full scale Control voltage overrides frequency dial Reference modes ƒinner, ƒouter, 5 × ƒouter, ƒinner + ƒouter, ƒouter – ƒinner
Dimensions Controller: 7.7” × 1.8” × 5.1” (WHD) Head: 2.8” × 2.1” × 1.0” (WHD) Blade diameter 4.04” ± 0.002”
Cable length 6 ft.
Power 12 W, 100/120/220/240 VAC, 50/60 Hz
20 High sensit Absorber Type Spectral Range Aperture (mm) Maximum Beam Power Mode Power Range(*) Power Scales Power Noise L Thermal Drift (3 Maximum Aver Response Time Power Accurac Linearity with P Energy Mode Energy Range Energy Scales Minimum Ener Maximum Ener <100ns 0.5ms 2ms 10ms Cooling Weight (kg) Fiber Adapters Part number: S Note (*): Depe using removable Note (**): The s range to the ab accuracy will be spectral range 1 Absorber Type P HE/HE1 BB EX PE, Metallic PE, BB PE-DIF PE BB-DIF [www.ophi tivity therm e e (μm) m Divergence ) evel 30min)(*)
rage Power Den e with Meter (0-9 cy +/-%(**) Power +/-% rgy rgy Density (J/c s Standard Senso nding on room a e snout averagin sensor has a rel bove specified a e ±3% as above f 190 - 3000nm.
e Max Energy Pulse Lengt 10ns 1μ 10 10 5 10 0.3 0.5 0.5 0.6 0.1 0.3 1.5 3 0.2 0.3 3 3 iropt.com/ph al sensor, m nsity (kW/cm2) 95%) typ. s m2) r
airflow and temp g and offset subt latively large spe accuracy. Nova, for 532nm, 905n Density J/cm² th μs 300μs 0 10 0 100 5 5 6 4 2 3 0.2 0.3 3 3 hotonics] model 3A (10 Broad band 0.19 - 20 Ø 9.5 NA 10μW - 3W 3W to 300μW 1μW 5 - 20μW 1 1.8 3 1 20μJ - 2J 2J to 200μJ 20μJ 0.3 1 2 4 convection 0.2 ST, FC, SMA, S 7Z02621 perature variation traction. ectral variation in
Orion and Laser m, 1064nm and 1 0μW - 3W) SC ns. Lowest meas n absorption and rStar meters do 10.6μm but there surable powers a has a calibrated not support this e will be an additi are achieved by d spectral curve s feature and wh onal error of up t thermally quiet at all wavelengt hen used with th to 3% at other wa
room conditions, hs in its spectral hose meters, the avelengths in the , l e e
21 Display system, model Laserstar
Input Specifications - Thermal, Photodiode
Input Ranges 15nA - 1.5mA full scale in 16 ranges
A to D sampling rate 15Hz
A to D resolution 17 bits plus sign. (0.0009% resolution)
Electrical accuracy ±0.25% ± 20pA new; ±0.5% ±50pA after 1 year
Electrical input noise level 500nV or 1.5pA + 0.0015% of input range @3Hz.
Dynamic range 9 decades (1:109)
Input Specifications - Pyroelectric Heads
Input Ranges 23mV - 6V full scale in 9 ranges
A to D Sampling rate 40KHz maximum
A to D resolution 12 bits no sign, 11 with sign (0.02-0.05% resolution)
Electrical accuracy +/-2mV new, +/-4mV after 1 year
Electrical input noise level 2mV
Dynamic range) 3.5 decades (1:4000)
General Specifications
Detector Compatibility Thermopile, photodiode and pyroelectric
Analog output 0-1 Volt with 3mV (0.03%) resolution. 100 ohms impedance
Analog output accuracy ±0.2% ±2mV relative to display
Dimensions (mm) 228W x 195D x 54H
Mass 1.45 Kg.
Display 240 x 64 pixel super twist LCD
Display digit height 17mm
Backlight EL: Operates from charger or battery
Bargraph segments 240
Battery 3 x D size. 4.0A-h NiCd battery built in.
Charger input DC: 12 - 25V, 5W; AC: 9 - 18V RMS, 5W Charge time 10 - 14Hr, 15 - 20Hr if operating
Operation between charges 18 Hrs, thermal and photodiode, 14 Hrs, pyroelectric heads.
Data Logging and Com.
RS232 output
Max real time data logging rate* >30Hz Onboard data logging rate* >200Hz
Data transfer from instrument to PC ~500 points/s Max points stored onboard 59,400
* The above refers to the rate for logging every single point. Above that rate the instrument will sample points but not log every single point.
IEEE 488.1 GPIB
Compliance: IEEE488.1
Max real time data logging rate* >1500Hz Onboard data logging rate* 1500Hz
Data transfer from instrument to PC >1500 points/s
* The above refers to the rate for logging every single point. Above that rate the instrument will sample points but not log every single point.
General Maximum communication rate 38400 baud
Can store up to 10 files for a total of 54,000 points (Max points stored onboard per power file is 5400). Data is not lost when instrument is turned off.
22
Lock-in amplifier, model SR830 DSP
SIGNAL CHANNEL
Voltage Inputs Single-ended (A) or differential (A-B).
Current Input 106 or 108 Volts/Amp.
Full Scale Sensitivity 2 nV to 1 V in a 1-2-5-10 sequence (expand off).
Input Impedance Voltage: 10 MW+25 pF, AC or DC coupled. Current: 1 kW to virtual ground.
Gain Accuracy ±1% from 20°C to 30°C (notch filters off), ±0.2 % Typical.
Input Noise 6 nV/ÖHz at 1 kHz (typical).
Signal Filters 60 (50) Hz and 120(100) Hz notch filters (Q=4).
CMRR 100 dB to10 kHz (DC Coupled), decreasing by 6db/octave
Dynamic Reserve Greater than 100 dB (with no signal filters).
Harmonic Distortion -80 dB.
REFERENCE CHANNEL
Frequency Range 1 mHz to 102 kHz
Reference Input TTL (rising or falling edge) or Sine. Sine input is1 MW, AC coupled (>1 Hz). 400 mV pk-pk minimum
Phase Resolution 0.01°
Absolute Phase
Error <1°
Relative Phase Error <0.01°
Orthogonality 90° ± 0.001°
Phase Noise External synthesized reference: 0.005° rms at 1 kHz, 100 ms, 12 dB/oct. Internal reference: crystal synthesized, <0.0001° rms at 1
Phase Drift <0.01°/°C below 10 kHz. <0.1°/°C to 100 kHz
Harmonic Detect Detect at Nxf where N<19999 and Nxf<102 kHz.
Acquisition Time (2 cycles + 5 ms) or 40 ms, whichever is greater.
DEMODULATOR
Zero Stability Digital displays have no zero drift on all dynamic reserves. Analog outputs: <5 ppm/°C for all dynamic reserves.
Time Constants 10 μs to 30 s (reference > 200 Hz). 6, 12, 18, 24 dB/oct rolloff. Up to 30000 s (reference < 200 Hz). 6, 12, 18, 24 dB/oct rolloff. Synchronous filtering available below 200 Hz.
Harmonic Rejection 80 dB
INTERNAL OSCILLATOR
Frequency 1 mHz to 102 kHz.
Frequency Accuracy 25 ppm + 30 μHz
Frequency
Resolution 4 1/2 digits or 0.1 mHz, whichever is greater.
Distortion f<10 kHz, below -80 dBc. f>10 kHz, below -70 dBc.1 Vrms
Output Impedance 50 W
Amplitude 4 mVrms to 5 Vrms (into a high impedance load) with 2 mV resolution. (2 mVrms to 2.5 Vrms into 50W load).
Amplitude Accuracy 1%
Amplitude Stability 50 ppm/°C
Outputs Sine output on front panel. TTL sync output on rear panel. When using an external reference, both outputs are phase locked to the external reference. DISPLAYS
Channel 1 4 1/2 digit LED display with 40 segment LED bar graph. X, R, X Noise, Aux Input 1 or 2. The display can also be any of these quantities divided by Aux Input 1 or 2. Channel 2 1/2 digit LED display with 40 segment LED bar graph. Y, q, Y Noise, Aux Input 3 or 4. The display can also be any of these quantities divided by Aux Input 3 or 4.
Offset X, Y and R may be offset up to ±105% of full scale.
Expand X, Y and R may be expanded by 10 or 100.
Reference 4 1/2 digit LED display. Display and modify reference frequency or phase, sine output amplitude, harmonic detect, offset percentage (X, Y or R), or Aux Outputs 1-4. Data Buffer 16k points from both Channel 1 and Channel 2 display may be stored internally. The internal data sample rate ranges from 512 Hz down to 1 point every 16 seconds. Samples can also be externally triggered. The data buffer is accessible only over the computer interface. INPUTS AND OUTPUTS
Channel 1 Output Output proportional to Channel 1 display, or X. Output Voltage: ±10 V full scale. 10 mA max output current.
Channel 2 Output Output proportional to Channel 2 display, or Y. Output Voltage: ±10 V full scale. 10 mA max output current.
X and Y Outputs Rear panel outputs of cosine (X) and sine (Y) components. Output Voltage: ±10 V full scale. 10 mA max output current.
Aux. Outputs 4 BNC Digital to Analog outputs. ±10.5 V full scale, 1 mV resolution. 10 mA max output current.
Aux. Inputs 4 BNC Analog to Digital inputs. Differential inputs with1 MW input impedance on both shield and center conductor. ±10.5 V full scale, 1 mV resolution.
Trigger Input TTL trigger input triggers stored data samples
Monitor Output Analog output of signal amplifiers (before the demodulator).
GENERAL
Interfaces IEEE-488 and RS232 interfaces standard. All instrument functions can be controlled through the IEEE-488 and RS232 interfaces.
Preamp Power Power connector for SR550 and SR552 preamplifiers.
Power 40 Watts, 100/120/220/240 VAC, 50/60 Hz.
Dimensions 17”W x 5.25”H x 19.5”D
Weight 30 lbs.
23 Microphone, model EK-23024-000.
Dimensions 5.56mm x 3.98mm x 2.21mm (.219in x .157in x .087in) Sensitivity (1 kHz) -53 Port location 12S Response Std Directional Omni-directional Peak Frequency 3500-5500 Dc supply 1.3 V
Amplifier current Drain in 50 μA max.
Output impedance (Ohm) Min. 2800, Nor. 4400, Max. 6800
ENEA
Servizio Promozione e Comunicazione www.enea.it
Stampa: Laboratorio Tecnografico ENEA - C.R. Frascati gennaio 2019