Electronic nose predicts high and low fumonisin contamination in maize cultures
Emanuela Gobbi
a,b,⁎
, Matteo Falasconi
c, Emanuela Torelli
a, Giorgio Sberveglieri
ca
Dipartimento di Scienze Agrarie ed Ambientali, Università di Udine, Via delle Scienze, 208, I-33100, Udine, Italy
b
Biodiversity s.p.a., Via Corfù 71, I-25124, Brescia, Italy
cSensor Laboratory, Dipartimento di Chimica e Fisica per l'Ingegneria e i Materiali, Università di Brescia & CNR-IDASC, Via Valotti 9, I-25123, Brescia, Italy
a b s t r a c t
a r t i c l e i n f o
Article history: Received 26 November 2010 Accepted 27 February 2011 Keywords: Zea mays Fusarium Fungi Volatiles Chemical sensorsThe ability of an electronic nose, based on a 6 metal oxide semiconductor chemical sensors array, to diagnose fungal contamination, to detect high fumonisin content and to predict fumonisin concentration was evaluated in vitro. Maize cultures were inoculated with Fusarium verticillioides, F. proliferatum, F. oxysporum, F. semitectum, F. solani and F. subglutinans. Sterilised maize cultures were used as reference. Fungal colonies and fumonisin content of the maize samples were used as covariates for statistical analyses and for electronic nose training. Univariate and multivariate exploratory data analysis showed that the electronic nose discriminated the inoculated maize culture samples according to their fumonisin content. Partial Least Square was also implemented to build a multivariate regression model based on EN signals for quantitative fumonisin prediction. The EN could correctly recognize high and low fumonisin content of maize cultures and provide a fair quantitative estimation. The validity of EN technology to perform a rapid screening of maize cultures in order to identify levels of fumonisin contamination below the acceptability threshold was established.
© 2011 Elsevier Ltd. All rights reserved.
1. Introduction
Rapid and specific techniques with improved sensitivity and discriminatory powers for the early detection of food spoilage are of increasing importance in the food industry where fast quality assurance systems are essential for appropriate management. Gener-ally their primary objective is to detect spoilage before it becomes unmanageable, allowing for simple management practice implemen-tation to reduce both the effects of potential contaminations and the associated economic costs. This is especially true for mycotoxins, fungal secondary metabolites (by-products of growth) that occur worldwide as contaminants of agricultural products, in thefield or during storage, and have often been associated with, and implicated in human and animal disease (Jay, 1996).
Maize (Zea mays) is the most abundant cereal commodity in the world and about one tenth (93Mio t), of the total world yield is produced in Europe (FAOSTAT, 2008).
Insects and fungi generate various quality problems in maize, with the mycotoxins produced by the Fusarium species being one of the major contributors to its spoilage. An important group of mycotoxins is represented by the fumonisins produced by Fusarium proliferatum and by F. verticillioides, the most diffuse pathogen of maize, with fumonisin B-1 (FB-1) being the most prevalent and also believed to be the most toxic. The fact that FB-1 is regarded as a possible cause of human
oesophageal cancer (Chu & Li, 1994; Rheeder et al., 1992), equine leukoencephalomalacia, a serious disease in horses (Marasas, 2001) and pulmonary oedema syndrome in pigs (Harrison, Colvin, Greene, Newman, & Cole, 1990), induced the European Union (EU) to set the maximum level of FB-1 and B-2 for “unprocessed maize, with the exception of unprocessed maize intended to be processed by wet milling,” to 4000 μg/kg (4 mg/kg) for human consumption
(Commission regulation, 2007). In the USA the Food and Drug
Administration has recommended levels varying from 2 to 4 mg/kg as advisory limits (U.S. Food and Drug Administration, 2001).
Therefore there is an ongoing need for rapid detection methods able to quantitatively diagnose fumonisin contamination, possibly on large grain batches, in order to prevent contaminated grains entering the food chain and being eaten by the consumer (de Boer & Beumer, 1999; Prieto-Simon, Noguez, & Campas, 2007).
Changes in the emitted volatile compounds (VOC) due to fungal spoilage of food or feed (Hodgins & Simmonds, 1995; Schnürer, Olsson, & Börjesson, 1999) and to mycotoxin contamination (Demyttenaere, Moriña, De Kimpe, & Sandra, 2004; Demyttenaere, Moriña, & Sandra, 2003; Jelen, Mirocha, Wasowicz, & Kaminski, 1995; Zeringue, Bhatnagar, & Cleveland, 1993) have already been reported. The analyses of VOC stimulated increasing interest since the early 1980s when the electronic nose (EN) instrumentation was developed (Persaud & Dodd, 1982). This technology aims at mimicking the mammalian sense of smell by producing a composite response that is unique to each odorant. It comprises an array of sensors that detects the odour and transduces the input into electrical signals that can be successively analysed by using pattern recognition strategies. The overall combination of the response patterns defines the odorant under investigation. Further information on ⁎ Corresponding author at: Permanent address: Dipartimento di Scienze Agrarie e
Ambientali, Università di Udine, Via delle Scienze, 208, I-33100, Udine, Italy. Tel.: +39 0432 558503; fax: +39 0432 558501.
E-mail address:[email protected](E. Gobbi).
0963-9969/$– see front matter © 2011 Elsevier Ltd. All rights reserved. doi:10.1016/j.foodres.2011.02.041
Contents lists available atScienceDirect
Food Research International
j o u r n a l h o m e p a g e : w w w. e l s e v i e r. c o m / l o c a t e / f o o d r e ssensor technologies, data analysis approaches and EN applications as an on-line, rapid diagnostic test for food spoilage can be found in the literature (Kralj Cigić & Prosen, 2009; Peris & Escuder-Gilabert, 2009; Röck, Barsan, & Weimar, 2008).
In the last decade, ability of the EN to detect fungal spoilage (Keshri, Voysey, & Magan, 2002; Magan & Evans, 2000; Marín et al., 2007; Paolesse et al., 2006) and mycotoxin or mycotoxigenic fungi contamina-tions (Abramson, Hulasare, York, White, & Jayas, 2005; Balasubramanian, Panigrahi, Kottapalli, & Wolf-Hall, 2007; Cheli, Campagnoli, Pinotti, Savoini, & Dell'Orto, 2009; Evans et al., 2000; Karlshøj, Nielsen, & Larsen, 2007; Keshri & Magan, 2000; Olsson, Borjesson, Lundstedt, & Schnurer, 2002; Perkowski, Buśko, Chmielewski, Góral, & Tyrakowska, 2008; Presicce et al., 2006) have been explored extensively.
In our previous study (Falasconi, Gobbi, et al., 2005) clear evidence of the capability of EOS835to detect fungal contamination in maize
cultures was provided. Moreover the EN's ability to discriminate between fumonisin-producing and non-producing strains of Fusarium verticillioides was assessed. However, in this previous study, the fumonisin prediction ability of the EN was not tested, because of the absence of covariate values and the protocol was not validated on a large fungal population.
Thus, a rapid discrimination of high and low levels of fumonisins (above or below the legal limit) is still a main challenge in bin-stored bulk grains and it was the main goal of this study. Here, a wider study with 18 fungal strains of six Fusarium species (F. verticillioides, F. proliferatum, F. oxysporum, F. semitectum, F. solani and F. subglutinans) has been undertaken in order to verify the capacity and performance of the EN in quantitatively predicting the fumonisin content in maize cultures in the presence of a more complex microbiological set. To the best of our knowledge, such a task has not been undertaken to date. 2. Materials and methods
2.1. Micro-organisms and microbiological techniques
The strains of six Fusarium species most commonly reported in maizefields and the samples considered in this work are listed in
Table 1. The number of strains for each species varied from one to nine, depending on availability. All the isolates obtained from the University of Udine collection had been isolated from maizefields in the Friuli Venezia Giulia (FVG) region, Italy, in a survey conducted in 1997 (Gobbi, Torelli, Rekab, Locci, & Firrao, 2005), and were kept in culture since then. Their identification was carried out in accordance with the taxonomic system ofNelson, Toussoun, and Marasas (1983)
and those, originally identified as F. moniliforme Sheldon, were arbitrarily named F. verticillioides herein for simplicity, without ascertaining their actual species.
The fungi obtained from other culture collections were revitalized following the manufacturer's instructions. All the fungi were main-tained and cultivated on Malt Extract Agar (MEA).
Mycelial cultures were incubated at 26 °C forfive days, and conidia suspensions in water were then prepared to be used to inoculate the maize.
2.2. Sample preparation
Maize culture samples were prepared by autoclaving 25 g of coarsely cracked corn kernels (Zea mays L. unknown commercial hybrid) added to 5 ml deionised H2O at 121 °C for 40 min in 500 ml
Duran bottles with a lateral inlet and outlet into which two syringe filters (0.45 μm) were inserted after autoclaving, ensuring a sterile air flow and to avoid cross-contamination of samples. Once sterilized, each bottle received another 5 ml of sterile deionised H2O and was
inoculated with 107fungal conidia; all the samples were incubated at 26 °C for 11 weeks. One bottle was prepared per strain, except when only one strain per species was used; in these cases two replicate
bottles were prepared. Five bottles with sterilized uninoculated maize were also prepared as described above and used as references (Table 1).
2.3. Colony forming units counting and fumonisin analysis
At 11 weeks of incubation, after the last EN measurement, the cracked maize kernels were ground and aliquots suspended in deionised H2O, 100μl were then plated onto MEA and incubated for
five days at 26 °C for colony forming units (CFU) ml− 1calculations.
After 11 weeks of incubation, fumonisins were also extracted from the maize samples. Five grams of the ground samples were suspended in 25 ml of 70% methanol and vigorously shaken for 3 min. The extract was filtered through a cotton plugged syringe and 100 μl of the collected samples were tested. The presence of fumonisins was detected using the commercial competitive direct enzyme-linked immunosorbent assay (CD-ELISA) kit (Veratox, Neogen, Lansing, USA) following the manufacturer's instructions. This analysis provides quantification in the range of 1–6 mg/kg. Therefore samples with a higher fumonisin contents were subsequently diluted in methanol until the measured value was in the proper range.
2.4. Electronic nose
The electronic nose EOS835(SACMI IMOLA scarl, Imola, Italy) was
used in this study (Falasconi, Pardo, Sberveglieri, Riccò, & Bresciani, 2005; Pardo & Sberveglieri, 2004). It comprises a sampling unit, a MOX sensor array with its own read-out electronics, a software interface for data acquisition and a signal processing toolbox.
The sampling unit consists of a pump and aflow controller that conveys the air sample containing the odorant under investigation into the sensor array chamber. The sensor array was made up of six different thinfilm MOX conductimetric gas sensors (Falasconi, Gobbi, et al., 2005). The sensors are partially selective towards different Table 1
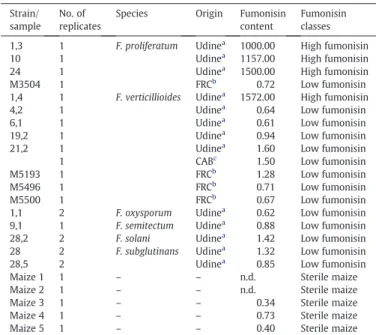
Fusarium strains and maize samples tested by the EN. For each sample, the actual fumonisin content (ppm) and its consequent fumonisin class are reported. When more than one replicate of the same strain were used, the fumonisin content is reported as their mean value.
Strain/ sample
No. of replicates
Species Origin Fumonisin content
Fumonisin classes 1,3 1 F. proliferatum Udinea 1000.00 High fumonisin
10 1 Udinea 1157.00 High fumonisin 24 1 Udinea 1500.00 High fumonisin M3504 1 FRCb 0.72 Low fumonisin 1,4 1 F. verticillioides Udinea 1572.00 High fumonisin 4,2 1 Udinea 0.64 Low fumonisin 6,1 1 Udinea 0.61 Low fumonisin 19,2 1 Udinea 0.94 Low fumonisin
21,2 1 Udinea 1.60 Low fumonisin 1 CABc 1.50 Low fumonisin M5193 1 FRCb 1.28 Low fumonisin M5496 1 FRCb 0.71 Low fumonisin M5500 1 FRCb 0.67 Low fumonisin 1,1 2 F. oxysporum Udinea 0.62 Low fumonisin 9,1 1 F. semitectum Udinea 0.88 Low fumonisin 28,2 2 F. solani Udinea 1.42 Low fumonisin 28 2 F. subglutinans Udinea 1.32 Low fumonisin 28,5 2 Udinea 0.85 Low fumonisin Maize 1 1 – – n.d. Sterile maize Maize 2 1 – – n.d. Sterile maize Maize 3 1 – – 0.34 Sterile maize Maize 4 1 – – 0.73 Sterile maize Maize 5 1 – – 0.40 Sterile maize
a
Fungal collection, Dept. Plant Biology and Protection, University of Udine, Udine, Italy.
b Fusarium Research Center (FRC), Pennsylvania State University, University Park, PA,
USA.
c
volatile organic compounds and when the chemical species interact with the MOX layer, redox reactions occur at the surface causing a measurable change in the electrical resistance of the thinfilm.
MOX sensors need to be kept under a constant airflow in order to reach a steady state conductance. To set this baseline, ambient air was inlinefiltered through a charcoal filter before being passed over the sensors in order to remove humidity and VOCs. Theflow rate was 180 cm3min− 1.
A commercial relative humidity (RH) sensor was also placed within the sensor chamber in order to constantly monitor the humidity level of the samples. The chamber temperature was kept constantly at 50 °C. The measured RH within the sensors chamber was around 30% (with a 2% mean variation) for all the samples.
Measurements were performed using a dynamic headspace mode by extracting the headspace through the 0.45μm syringe filter outlet to prevent environmental spore contamination. Each measurement cycle consisted in: exposure of the sensors to cleanfiltered ambient air; sensors for 60 s, exposure of the sensors to the sample headspace for 60 s; andfinally, sensors exposure to filtered ambient air for 4 min for baseline recovery before the next analysis.
Five EN measurement sessions were performed, at 5, 6, 7, 8 and 11 weeks after the inoculations and/or the beginning of the incubation of the samples; in each session some sterile maize samples were measured as reference in order to monitor the system stability over time. Samples were incubated, measured and kept at 26 °C between measurement sessions.
2.5. Data analysis
Approximately 150 measurements were carried out by the EN. All of the sensor response patterns were digitized and recorded using the software package included with the EOS835.
In order to reduce dimensionality, representative features were extracted from each sensor curve. The widely used static feature R/R0 was chosen, where R0 is the sensor resistance in air and R is the minimum sensor resistance in the presence of the odour. This feature essentially measures the amplitude of the response but does not provide any information on the dynamic of the signal during the sensor's exposure to the samples; as a consequence it may not be effective in discriminating the samples. InFig. 1it is evident as R/R0 assigned the same value to the two different samples A (sterile maize) and B (F. verticillioides strain 21.2). For this reason, three other features were added, namely the slope of the response curve at 20 s, 40 s, and 60 s after odour injection (termed Slope20, Slope40 and Slope60 respectively). These account for dynamic changes in the response curve profile due to the interaction of the VOCs with the sensing layer providing further information; and so, as shown inFig. 1for the feature Slope20, by scoring opposite values, the 2 samples are differentiated more effectively, thereby improving the EN discrimination.
The data were then analyzed by Exploratory Data Analysis software (EDA software), an in-house written software package based on MATLAB® (Vezzoli et al., 2008). EDA software includes typical univariate and multivariate descriptive statistical functions, such as: feature plots, box plots, Pearson correlation analysis of variables, and Principal Component Analysis (PCA) (Massart et al., 1997a). Addition-ally it possesses utilities for the definition of a data structure (both the measurement matrix and the data covariates), easy data manipulation (e.g. data sub sampling and data set fusion) and plot customization.
Box plots were use to assess individual sensors and features performance and to identify outliers. Box plots provide a summary of the statistical information: in each box plot the lower line indicates thefirst quartile, the line in the middle the median or second quartile and the upper line the third quartile values; whiskers extending from each box show the extent of the tails of the sample distribution. Whiskers extend from the box out to the most extreme data value within 1.5⁎IQR, where IQR is the inter-quartile range (i.e. difference
between 3rd and 1st quartile values) of the sample; outliers are data with values beyond the ends of the whiskers and they are marked by a cross.
PCA was based on Singular Value Decomposition of the covariance matrix of the data. PCA was employed to visualize the multidimen-sional data in order to investigate the ability of the electronic nose to discriminate the examined samples in an unsupervised way. Here PCA biplots were used as they visualize both the objects (scores) and the variables (loadings) on the same plot, thus providing a preliminary insight of the data structure; namely they allow the detection of clusters in the data and objects classification while underlining the important variables. Variables were standardized (by zscore, i.e. zero mean and unit variance) before calculating the principal components (PCs) (Massart et al., 1997a). PCA loadings can be used to evaluate the feature correlation (highly correlated variables stand closer on the PCA loading plot) and to interpret the effect of the variables on the objects distribution over the PCA score plot (variables that point towards certain objects are more important for those objects).
Pearson correlation analysis was used to test the degree of correlation among the variables (features) and whether the individual features were correlated to the fumonisin values measured by CD-ELISA. For this second task the magnitude of the linear correlation coefficient and its p-value (to test the null hypothesis of no correlation) were evaluated for each individual feature vs. the Log10 of the CD-ELISA values1reported inTable 1. The correlation coefficient was calculated by
using the mean values for the replicated e-nose measurements per sample listed inTable 1.
Partial Least Squares (PLS) regression (Massart et al., 1997b) has been implemented to build a multivariate bilinear factor model based on EN signals (X input) to predict fumonisin levels i.e. Log10 of the CD-ELISA values (Y input). For the computing of PLS regression components, i.e. Latent Variables (LVs), the standard Nonlinear Iterative Partial Least Squares (NIPALS) algorithm was used. Variables X and Y have been transformed to have zero means and unit variance (zscore normalization). In order to avoid overfitting, 10-fold Cross-Validation (CV) was used to estimate the best number of LVs; to Fig. 1. Example of the feature extraction procedure using the sensor WO3and its
response curves for (A) the sterile maize sample, (B) Fusarium verticillioides strain 21.2 and (C) Fusarium oxysporum, strain 1.1. The continuous vertical line (t = 0) indicates the beginning of the sample headspace injection in the sensor chamber. Four features are extracted: R/R0, Slope20, Slope40 and Slope60. R0 is the average value of the sensor response during clean ambient air exposure (baseline) while Rmin (R) is calculated as the minimum of the sensor response curve during the sample headspace injection. Slope20 (shown as continuous segments), Slope40 and Slope60 are the slope of the sensor response curve calculated respectively at 20, 40 and 60 s after the t = 0 (3 dashed vertical lines).
1
Since ELISA values differ of three orders of magnitude taking the Log is essential to achieve a linear relationship.
obtain this the PRediction Error Sum of Squares (PRESS) was plotted against the number of LVs and the point of minimum was retained. Finally, data were randomly split into two sets: thefirst to estimate the regression coefficients (training set) and the second for PLS model validation (test set).
3. Results
3.1. Fumonisin contents and CFU of samples
The total count of fungal colonies obtained from the inoculated samples of maize ranged from 104to 109CFU ml− 1(data not shown) after 11 weeks of incubation. No correlation was found between the EN data and either the fumonisin content or the CFU counts of the samples (data not shown).
The fumonisin content of the maize samples is reported as the mean value for each strain inTable 1. According to their fumonisin content, the samples were grouped into 2 classes. The “high fumonisin” class comprises the maize cultures with fumonisin content above1000 mg/kg (average 1307 mg/kg) that were inoculated with the 4 strains (i.e. strains 1.3, 10, 24 and 1.4) of the fumonisin-producing species F. proliferatum and F. verticillioides that effectively synthesized fumoni-sins at high levels under these experimental conditions. The “low fumonisin” class is made up of 18 maize cultures with a fumonisin content below 1.6 mg/kg (average 1.0 mg/kg); 9 cultures were inoculated with the 9 strains belonging to F. verticillioides and F. proliferatum that were either known mutants that do not produce fumonisins (strains M5193, M5496 and M5500) or are low fumonisin producers in this experimental conditions (strains M3504, 4.2, 6.1, 19.2, 21.2 and 202875). Also the 9 maize cultures inoculated with the non-fumonisin producing species were grouped in this class as they had an average content of 1.0 mg/kg of fumonisins.
A third class, named“sterile maize” (average fumonisin content of 0.5 mg/kg), comprises all the 5 maize cultures that were not inoculated. Due to the endemic nature of fumonisin contamination, even the sterile maize samples contained a certain amount of toxins; hence, absolute negative samples for fumonisin presence were not available in this study. Nevertheless, for the purpose of this study, these samples were considered real negative controls with regard to the fungal contamination and for this reason they were grouped separately.
3.2. Electronic nose
3.2.1. Exploratory data analysis
The initial examination of the data is one of the most important phases of the data analysis cycle and consists of three parts: checking the quality of the data; calculating summary statistics andfinally producing plots of the data in order to perceive their structure. Univariate feature plots, Principal Component Analysis (PCA) and Correlation Analysis are the typical methods for summarizing statistical information and for graphical data representation.
The preliminary examination of all the sensor response curves plotted against the measurement time (data not shown) showed that two sensors (SRAg and In2O3) gave noisy, unreliable responses due to
critical baseline fluctuations; therefore they were discarded from subsequent data analyses.
One of the strongest requirements that chemical sensors have to meet is indeed stability with time; since, if present, long term drift can impair classification or regression results on test data. Therefore, the trend of the 16 features (4 features times 4 remaining sensors) responses to the sterile maize headspace samples throughout the entire EN experimental session was checked in order to verify the stability of the system. No systematic drift with time was observed over six weeks of measurements (data not shown): mean values are scattered in agreement with reasonable statisticalfluctuations.
Subsequently the pairwise Pearson correlation values among the 16 features were examined over the entire dataset (data not shown). The higher the correlation value of two features is the more similar their behaviour is and the information they provide; for this reason, uncorrelated features are preferred when performing multivariate classification.
R/R0 and Slope20 always resulted as being highly correlated intra and inter sensors, as well as Slope40 and Slope60. Differently, Slope40 and Slope60 were generally poorly correlated with R/R0 and Slope20. These results support the empirical observation that static and dynamic characteristics of the response curve, i.e. the signal amplitude (R/R0) and itsfirst derivative (slope), contain different information about the samples.
Correlation analysis was also performed to determine whether, and which, features were correlated with the fumonisin values as measured by CD-ELISA essay.Table 2shows that Slope60 and Slope40 features have the highest correlation coefficient wrt Log10 of CD-ELISA values and also the highest statistical significance (pb0.0001). Slope40SRAu represents an exception to this rule; indeed it is not linearly correlated to the fumonisin content (the correlation coef fi-cient is 0.2715 and it is not significant at the 5% level).
Multivariate exploratory data analysis was performedfirstly by PCA biplots obtained by using the entire set of 16 features (Fig. 2). The three fumonisin classes can be well discriminated on thefirst two PCs since there is no or little overlap among the classes.
Again the variables can be roughly divided into two groups. Variables in thefirst group (variable Nos. 1 to 8) account mainly for Table 2
Correlation between the extracted features and the logarithms of CD-ELISA values of samples.
Feature no. Feature name Correlation coeff. p value
16 Slope60WO3 0.9854 b0.0001 14 Slope60SRMO 0.9295 b0.0001 13 Slope60SRAU 0.9115 b0.0001 15 Slope60SnIn 0.8840 b0.0001 10 Slope40SRMo 0.8777 b0.0001 12 Slope40WO3 0.8614 b0.0001 11 Slope40SnIn 0.8319 b0.0001 3 RR0SnIn 0.8039 b0.0001 2 RR0SRMo 0.7559 0.0002 4 RR0WO3 0.7204 0.0005 7 Slope20SnIn 0.7115 0.0006 6 Slope20SRMo 0.7009 0.0008 8 Slope20WO3 0.6823 0.0013 1 RR0SRAu 0.6347 0.0035 5 Slope20SRAu 0.4869 0.0345 9 Slope40SRAu 0.2715 0.2608
Fig. 2. PCA biplot of thefirst two principal components PC1 and PC2 (scores and loadings were scaled tofit on the same plot). The maize cultures are separated into three groups: low fumonisin class, high fumonisin class and the sterile maize. The features marked with stars were selected as the most significant ones.
the variance on the 1st PC, and hence, they contribute in discrimi-nating the“low fumonisin” class from the two others. This group only comprises the features R/R0 and Slope20, thus confirming that they are highly correlated. Variables in the second group (variable Nos. 9 to 16), namely Slope40 and Slope60 features, are orthogonal to the former ones and less correlated among them.
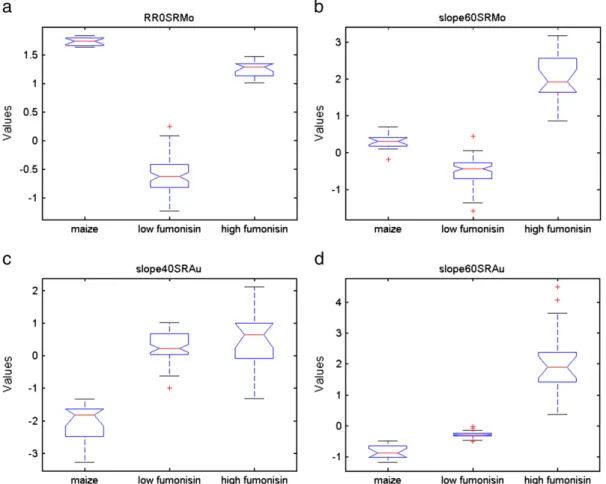
Four variables, indicated by stars, that were the most uncorrelated features within each group and the best fitted to represent and summarize the behaviour of the whole feature set, were also selected by exploring their corresponding box plots (Fig. 3) where their ratio between class separation vs. compactness could be evaluated.
R/R0SRMo (variable No. 2) was chosen to be representative of the first feature group. It was very effective in separating the three classes of samples and in particular in discriminating the“low fumonisin” class (Fig. 3a).
Slope60SRMo (variable No. 14) was selected to represent the group of the three feature Nos. 10, 11 and 14 inFig. 4, as, between them it gave the best separation of the three fumonisin classes (Fig. 3b). Compared to R/R0SRMo, this feature responds less to the“sterile maize” class while it clearly separates the“low fumonisin” from the “high fumonisin” class. Slope40SRAu (variable No. 9) was anticorrelated to the former ones, as can also be observed inFig. 2. Indeed, it very clearly separated the “sterile maize” class from the two others but it did not discriminate between high and low fumonisin content (Fig. 3c) in agreement with the very low correlation value between the Slope40SRAu feature values and the CD-ELISA values reported inTable 2.
Finally, Slope60SRAu (variable No. 13) was chosen among the group of feature Nos. 12, 13, 15, and 16 which are strongly correlated with the fumonisin content, as evidenced both by the box plot (Fig. 3d) and by the correlation score inTable 2.
By performing PCA with the four selected most uncorrelated variables that individually provide the best ratio between class separation and compactness, the discrimination among the three classes improved (Fig. 4). On the PC1 the samples are clearly separated on the basis of their fumonisin content: on the right, the“high fumonisin” class, on the left, the“low fumonisin” class, while the sterile maize clusters by itself. On the PC2 the fungal contamination is discriminated: above the Fig. 3. Box plots for the features individuated in the biplot inFig. 4: (a) R/R0SRMo, (b) Slope60SRMo, (c) Slope40SRAu and (d) Slope60SRAu. The plots report the values of each individual feature against the three classes in which samples were grouped.
Fig. 4. PCA biplot of thefirst two principal components PC1 and PC2 (scores and loadings were scaled tofit on the same plot) obtained by selecting only four features: R/ R0SRMo, Slope60SRMo, Slope60SRAu and Slope40SRAu. The samples are labelled with their fumonisin content. Clusters corresponding to the fumonisin content are separated on the PC1. The sterile maize class (maize) is well separated from all the other samples on both PCs.
fungal inoculated samples, below the sterile maize samples. Noticeably high vs. low fumonisin contaminated samples could be discriminated independently from the fungal species. The cluster corresponding to high fumonisin content samples, produced by four strains of F. verticillioides and F. proliferatum, was clearly differentiated from the cluster corresponding to the low fumonisin samples, including the nine mutants or low producer strains of F. verticillioides and F. proliferatum, as well as all the strains of the fumonisin non-producing species, F. solani, F. semitectum, F. subglutinans and F. oxysporum. Eventually, it resulted that by proper feature selection the classification problem could be easily solved by a simple linear classifier (e.g. Linear Discriminant Analysis) with 100% classification performance.
In conclusion, results based on EOS835 data indicated that this
method was able i) to discriminate between fungal inoculated vs. non inoculated (sterile) maize cultures; ii) to distinguish different levels of fumonisin contamination of maize cultures, by using features significantly correlated with the logarithm of values measured by CD-ELISA; but iii) not to separate fumonisin-producing species from fumonisin-not producing species.
3.2.2. Prediction of fumonisin content
Regression problems constitute a more challenging domain for EN instruments. The goal of regression is to establish a predictive model from a set of independent variables X (gas sensor responses) to another set of continuous dependent variables Y (fumonisin content).
Correlation analysis carried out in the previous section already showed that gas sensor signals (features) are correlated with the logarithm of fumonisin content, hence the next step was to build a multivariate model that provided quantitative results.
Partial Least Squares (PLS) is the“gold standard” in chemometrics for solving regression problems due to its ability to handle collinear data and reduce the number of required calibration samples. PLS finds the directions of maximum correlation between X and Y in a sequential fashion through NIPALS algorithm which is implemented in the Matlab ® PLS toolbox used here.
A termination point for such sequential expansion is determined through Cross-Validation (CV) in order to prevent overfitting, i.e. to get a model thatfits the training data perfectly but fails to predict new data well. Therefore, to estimate the optimal number of Latent Variables (LVs) of our PLS model the data were split in 10 folds and the average PRediction Error Sum of Squares (PRESS) was evaluated by iteratively increasing the number of LVs. The plot of PRESS against the number of LVs (data not shown) indicates thatfive variables provide the minimum test error; by further increasing the number of variables only noise wasfitted. The same conclusion can be drawn by looking at the variance captured by the PLS model: as shown inTable 3, thefirst five PLS factors accounted for almost the entire variation on Y while anything above 5 LVs did not really add much.
Finally, the built PLS model was tested over an independent data set which was generated by randomly splitting original data, whereas
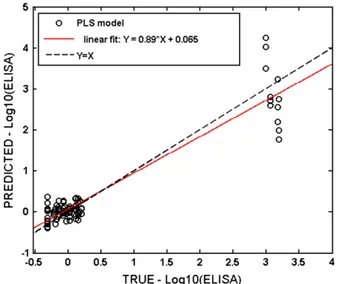
remaining data were used to train the model. Results of this test are shown inFig. 5, where EN predicted values are reported against true values of the logarithm of the fumonisin content measured by CD-ELISA. It can be noted that with regard to the samples with low fumonisin content, the machine provides a good estimation: mean true value 1.16 mg/kg vs. mean predicted value of 1.06 mg/kg, corresponding to an absolute error of only 0.37 mg/kg in spite of the high relative error of about 31%.
Also the prediction for the sterile maize class is similarly good, the predicted values are systematically higher than the true ones (0.89 mg/kg vs. 0.5 mg/kg respectively), with a high relative error (85%) but with an absolute error of 0.42 mg/kg. EN produces only a rough estimate for the“high fumonisin” class. In this case the mean true value is 1300 mg/kg vs. the mean predicted contamination value of about 3000 mg/kg with a very high associated standard deviation; hence the relative error is about 230%.
Nevertheless, the EN is certainly able to detect the fumonisin presence in contaminated maize samples and correctly predict high and low values of the mycotoxin, respectively well above and below the threshold set by EU for human consumption (4 mg/kg), which was the main goal of this work.
4. Discussions
Different studies have been carried out to test the suitability of volatile analyses as a tool for fungal detection in foodstuff but only a few were focused on mycotoxin diagnosis (Sahgal, Needham, Cabañes, & Magan, 2007).
Keshri and Magan (2000) and Falasconi, Gobbi, et al. (2005)
reported the successful application of the EN for early fumonisin detection in maize prior to visible mould growth. However, these studies were limited to a very few fungal strains; moreover they did not attempt any quantitative detection and prediction of fumonisin content, the essential steps in the mycotoxin mass screening of maize required by the EC regulations that set the maximum level of fumonisins B1 and B2 to 4 mg/kg.
In Italy, maize and maize products can be commonly contaminated by fumonisin levels above the set threshold (Reyneri & Blandino, 2003). Appropriate measures should be taken to avoid that unacceptably high contaminated maize and maize products can enter the food chain. There are indications that fumonisin contamination in foods and feeds could be significantly limited by good agricultural practices. Unfortunately the best methods for reducing contamination often have the side effect of decreasing thefinal amount of grain produced with the consequent Table 3
Percent variance captured by the Cross-Validation (CV)— Partial Least Squares (PLS) model for predicted (Y block) and predictor (X block) variables.
Number of LVs
X block (% variance) Y block (% variance) PRESS Current factor Total Current factor Total
1 54.36 54.36 69.50 69.50 38.93 2 31.29 85.93 12.51 82.02 23.17 3 6.12 92.05 3.96 85.97 19.16 4 1.57 93.61 3.27 89.24 16.60 5 1.14 94.75 1.75 90.99 14.60 6 2.12 96.87 0.37 91.36 15.14 7 1.03 97.90 0.36 91.73 14.35 8 0.33 98.24 0.23 91.95 13.88 9 0.54 98.78 0.05 92.00 14.45 10 0.38 99.16 0.04 92.04 14.85
Fig. 5. PLS model for prediction of fumonisin content in the maize cultures; Predicted values vs. true values of the logarithm of fumonisin content by the validated model.
economic loss. Therefore, a quality rating method to compensate those producers who adopt methods aimed at reducing the risks of contamination above or below the legal limit is urgently needed.
In this work, the quantitative prediction ability of the EOS835was
assessed by implementing a multivariate PLS regression model and the results demonstrate that there is a significant correlation between the EN signals and the fumonisin content of the samples measured by CD-ELISA. Indeed, for the first time, the quantitative fumonisin determination capability of EOS835 has been ascertained for high and low contamination levels. Therefore, the EN, in combination with the explorative analysis of data, represents an important analytical tool in maize cultures even if it does not provide a precise fumonisin quantification. In fact from a practical point of view, the high relative error and the corresponding small absolute error for the low fumonisin content prediction, are acceptable as the discrepancy between the predicted and the true values (0.37 mg/kg) is indeed smaller than the limit of sensitivity of most analytical tests. Similarly, the EN's very approximate prediction of the high fumonisin content is not really crucial as it concerns values so much higher than the legal limit that it does not impair the efficacy of the screening.
As far as the large relative errors are concerned, there is space for improvement. One way is to select the best set of features that maximally contribute to the regression issue. In general the selected informative sets include features with uncorrelated behaviour and can vary across different discrimination/regression tasks, as shown, for example, by Slope40SRAu that had a diagnostic value exclusively for fungal contamination while Slope60SRAu had a strong fumonisin content discriminating capacity. Therefore the best features selection is dependent on thefinal goal of the experiment. A second way is to use more complex regression models (e.g. non-linear PLS or Artificial Neural Nets), provided that the amount of data permits one to do this, which was not our case.
In this work, for thefirst time, the EOS835application has been
applied to compare a larger Fusaria population than those tested in previous studies. Here a relatively large number of fungal strains of both fumonisin-producing and -non producing species originating from separate geographic areas in order to cover a wider biological diversity was used to obtain statistical support to EN responses that could not be attained by confronting individual strains as previously reported. This approach allowed us to eliminate the variability within fungal populations and to enhance the ability in detecting the variability between fumonisin-producing and -non producing popu-lations. EOS835 was able to cluster the inoculated maize cultures
primarily according to their level of fumonisin contamination and independently from the agent of contamination. In fact the strains of F. verticillioides and proliferatum were sorted depending on their actual fumonisin production and not on a taxonomic basis, as the low fumonisin-producing strains of F. verticillioides and proliferatum were grouped with the strains of the fumonisin-non producing species.
Remarkably both the uninoculated maize samples (“sterile maize” class) and those inoculated by the fumonisin-non producing strains contained small quantities of fumonisins. These mycotoxins occur in maize crops worldwide (Marasas, 2001) and are considered to be endemic in Northern Italy (Reyneri & Blandino, 2003), where the maize used here was grown. Nevertheless the system was able to discriminate the fungal contamination separating the“sterile maize” class from all the other samples with fungal mycelia growing on them. Many factors, such as substrate, temperature, oxygen concentration, age of the culture and microbial species have been observed to affect the composition of volatiles. In this study the intent was not to elucidate which volatile the EN actually detects but only to verify if EOS835could be a fast and sensitive method to ascertain the fumonisin contamination in maize compared to the legal limit. Further work such as GC–MS characterization of the headspace spectra could clarify if and which specific volatiles are useful for the discrimination between the classes of samples. Future developments of this protocol should also include a gain
in sensitivity of the method, e.g. by improving the headspace sampling by using pre-concentration techniques like Solid Phase Microextraction (SPME).
5. Conclusions
The objective of the current study was to assess the semi-quantitative prediction ability of an electronic nose for the fumonisin content in maize cultures in the presence of a complex microbiological set.
The overall results indicated that sensor arrays could be used to predict the fumonisin content of maize cultures for high and low contamination levels. The protocol described herein, using a system capable of performing near real-time semi-quantitative prediction, could be relevant and crucial as samples below or above the legal limit could be rapidly identified in storage facilities and the former eventually promoted.
EN could represent a rapid mean for controlling and improving food quality, all the results mentioned above are promising and further investigations to induce more sensitive specific response of the gas sensors may help both in the qualitative and quantitative analysis of fumonisin contamination.
Acknowledgements
We would like to thank Dr. Matteo Pardo for fruitful discussions and Dr. William Dundon for his critical editing of the manuscript. The EDA software development was supported by the FP6 European Project“Mobile system for non-invasive wound state monitoring” (WoundMonitor) IST-2004-27859.
References
Abramson, D., Hulasare, R., York, R. K., White, N. D. G., & Jayas, D. S. (2005). Mycotoxins, ergosterol, and odor volatiles in durum wheat during granary storage at 16% and 20% moisture content. Journal of Stored Products Research, 41(1), 67−76. Balasubramanian, S., Panigrahi, S., Kottapalli, B., & Wolf-Hall, C. E. (2007). Evaluation of
an artificial olfactory system for grain quality discrimination. LWT Food Science and Technology, 40(10), 1815−1825.
Cheli, F., Campagnoli, A., Pinotti, L., Savoini, G., & Dell'Orto, V. (2009). Electronic nose for determination of aflatoxins in maize. Biotechnology, Agronomy, Society and Environment, 13(S), 39−43.
Chu, F. S., & Li, G. Y. (1994). Simultaneous occurrence of fumonisins B1 and other mycotoxins in moldy corn collected from People's Republic of China in regions with high incidences of esophageal cancer. Applied and Environmental Microbiology, 60, 847−852.
Commission regulation (2007). Commission regulation No. 1126/2007 amending Regulation (EC) No. 1881/2006 setting maximum levels for certain contaminants in foodstuffs as regards Fusarium toxins in maize and maize products. Official Journal of the European Union, 255, 14−17http://www.fsai.ie/uploadedFiles/Commission_ Regulation_EC_No_1126_2007.pdf.
de Boer, E., & Beumer, R. R. (1999). Methodology for detection and typing of foodborne microorganisms. International Journal of Food Microbiology, 50, 119−130. Demyttenaere, J. C., Moriña, R. M., De Kimpe, N., & Sandra, P. (2004). Use of headspace
solid-phase microextraction and headspace sorptive extraction for the detection of the volatile metabolites produced by toxigenic Fusarium species. Journal of Chromatography A, 1027(1–2), 147−154.
Demyttenaere, J. C., Moriña, R. M., & Sandra, P. (2003). Monitoring and fast detection of mycotoxin-producing fungi based on headspace solid-phase microextraction and headspace sorptive extraction of the volatile metabolites. Journal of Chromatogra-phy A, 985(1–2), 127−135.
Evans, P., Persaud, K. C., McNeish, A. S., Sneath, R. W., Hobson, N., & Magan, N. (2000). Detection of contaminants in grain and infestation in bulk and in transit grain by sensors and physical methods. In V. Weimer, & M. Frank (Eds.), Proceedings of the international symposium of electronic noses (ISOEN) (pp. 221−224).
Falasconi, M., Gobbi, E., Pardo, M., Della Torre, M., Bresciani, A., & Sberveglieri, G. (2005). Detection of toxigenic strains of Fusarium verticillioides in corn by electronic olfactory system. Sensors and Actuators B, 108, 250−257.
Falasconi, M., Pardo, M., Sberveglieri, G., Riccò, I., & Bresciani, A. (2005). The novel EOSP835
P electronic nose and data analysis for evaluating coffee ripening. Sensors and Actuators B, 110, 73−80.
FAOSTAT (2008)http://www.fao.org/statistics/.
Gobbi, E., Torelli, E., Rekab, D., Locci, R., & Firrao, G. (2005). Fumonisins producing Fusaria in northern eastern Italy and their detection in immediate airborne samples by PCR.
Harrison, L. R., Colvin, B. M., Greene, J. T., Newman, L. E., & Cole, J. R. (1990). Pulmonary oedema and hydrothorax in swine produced by fumonisins B1, a toxic metabolite of Fusarium moniliforme. Journal of Veterinary Diagnostic Investigation, 2, 217−221. Hodgins, D., & Simmonds, D. (1995). Sensory technology forflavor analysis. Cereal Foods
World, 40, 186−191.
Jay, J. M. (1996). Modern food microbiology. New York: Chapman & Hall.
Jelen, H. H., Mirocha, C. J., Wasowicz, E., & Kaminski, E. (1995). Production of volatiles sesquiterpenes by Fusarium sambucinum strains with different abilities to synthesize trichothecens. Applied and Environmental Microbiology, 61, 3815−3820. Karlshøj, K., Nielsen, P. V., & Larsen, T. O. (2007). Prediction of Penicillium expansum spoilage and patulin concentration in apples used for apple juice production by electronic nose analysis. Journal of Agricultural and Food Chemistry, 55, 4289−4298.
Keshri, G., & Magan, N. (2000). Detection and differentiation between mycotoxigenic and non-mycotoxigenic strains of two Fusarium spp. using volatile production profiles and hydrolitic enzymes. Journal of Applied Microbiology, 89, 825−833. Keshri, G., Voysey, P., & Magan, N. (2002). Early detection of spoilage moulds in bread
using volatile production patterns and quantitative enzyme assays. Journal of Applied Microbiology, 92, 165−172.
Kralj Cigić, I., & Prosen, H. (2009). An overview of conventional and emerging analytical methods for the determination of mycotoxins. International Journal of Molecular Sciences, 10(1), 62−115.
Magan, N., & Evans, P. (2000). Volatiles and indicators of fungal activity and differentiation between species, and the potential use of electronic nose technology for early detection of grain spoilage. Journal of Stored Products Research, 36, 319−340.
Marasas, W. F. O. (2001). Discovery and occurrence of the fumonisins: A historical perspective. Environmental Health Perspectives, 109, 239−243.
Marín, S., Vinaixa, M., Brezmes, J., Llobet, E., Vilanova, X., Correig, X., et al. (2007). Use of a MS-electronic nose for prediction of early fungal spoilage of bakery products. International Journal of Food Microbiology, 114, 10−16.
Massart, D. L., Vandeginste, B. G. M., Buydens, L. M. C., De Jong, S., Lewi, P. J., and Smeyers-Verbeke, J. (1997b). Handbook of chemometrics and qualimetrics, part B. In Data handling in science and technology, vol.20A (pp. 383–420). Amsterdam: Elsevier Eds.
Massart, D. L., Vandeginste, B. G. M., Buydens, L. M. C., De Jong, S., Lewi, P. J., and Smeyers-Verbeke, J. (1997a). Handbook of chemometrics and qualimetrics, part A. In Data handling in science and technology, vol.20A (pp. 519–556). Amsterdam: Elsevier Eds.
Nelson, P. E., Toussoun, T. A., & Marasas, W. F. O. (1983). Fusarium species: An illustrated manual for identification. University Park, PA, USA: Pennsylvania State University Press.
Olsson, J., Borjesson, T., Lundstedt, T., & Schnurer, J. (2002). Detection and quantification of ochratoxin A and deoxynivalenol in barley grains by GC–MS and electronic nose. International Journal of Food Microbiology, 72, 203−214. Paolesse, R., Alimelli, A., Martinelli, E., Di Natale, C., D'Amico, A., D'Egidio, M. G., et al.
(2006). Detection of fungal contamination of cereal grain samples by an electronic nose. Sensors and Actuators B, 119, 425−430.
Pardo, M., & Sberveglieri, G. (2004). Electronic olfactory systems based on metal oxide semiconductor sensor arrays. MRS Bullettin, 29, 703−708.
Peris, M., & Escuder-Gilabert, L. (2009). A 21st century technique for food control: Electronic noses. Analytica Chimica Acta, 638(1), 1−15.
Perkowski, J., Buśko, M., Chmielewski, J., Góral, T., & Tyrakowska, B. (2008). Content of trichodiene and analysis of fungal volatiles (electronic nose) in wheat and triticale grain naturally infected and inoculated with Fusarium culmorum. International Journal of Food Microbiology, 126(1–2), 127−134.
Persaud, K., & Dodd, C. (1982). Analysis of discrimination. Mechanisms in the mammalian olfactory system using a model nose. Nature, 299, 352−355. Presicce, D. S., Forleo, A., Taurino, A. M., Zuppa, M., Siciliano, P., Laddomada, B., et al.
(2006). Response evaluation of an E-nose towards contaminated wheat by Fusarium poae fungi. Sensors and Actuators B, 118, 433−438.
Prieto-Simon, B., Noguez, T., & Campas, M. (2007). Emerging biotools for assessment of mycotoxins in the past decade. Trends in Analytical Chemistry, 26, 689−702. Reyneri, A., & Blandino, M. (2003). Control of mycotoxicosis in corn: 7 years of research on
crop techniques and postharvest treatments. The Netherlands: The Second World Mycotoxin Forum.
Rheeder, J. P., Marasas, W. F. O., Thiel, P. G., Sydenham, E. W., Shephard, G. S., & Van Schalkwyk, D. J. (1992). Fusarium moniliforme and fumonisins in corn in relation to human oesophageal cancer in Transkei. Phytopathology, 82, 353−357.
Röck, F., Barsan, N., & Weimar, U. (2008). Electronic nose: Current status and future trends. Chemical Reviews, 108, 705−725.
Sahgal, N., Needham, R., Cabañes, F. J., & Magan, N. (2007). Potential for detection and discrimination between mycotoxigenic and non-toxigenic spoilage moulds using volatile production patterns: A review. Food Additives and Contaminants, 24, 1161−1168. Schnürer, J., Olsson, J., & Börjesson, T. (1999). Fungal volatiles as indicators of food and
feeds spoilage. Fungal Genetics and Biology, 27(2–3), 209−217.
U.S. Food and Drug Administration (2001). Guidance for industry: Fumonisin levels in human foods and animal feedshttp://www.cfsan.fda.gov/~dms/fumongu2.html. Vezzoli, M., Ponzoni, A., Pardo, M., Falasconi, M., Faglia, G., & Sberveglieri, G. (2008).
Exploratory data analysis for industrial safety application. Sensors and Actuators B, 131, 100−109.
Zeringue, H. J., Bhatnagar, D., & Cleveland, T. E. (1993). C15H24volatile compounds
unique to aflatoxigenic strains of Aspergillus flavus. Applied and Environmental Microbiology, 59, 2264−2270.