First-move advantage in seasoned equity offerings:
evidence from European banks
Abstract
The financial crisis that started in 2008 has generated significant losses for
European banks, forcing them to undertake a series of seasoned equity offerings
(SEOs) to reinforce their balance sheets in order to comply with regulatory
capital requirements. As a results, they have produced repeated SEO waves in a
relatively short time frame, when capital supply was limited due to the economic
and financial context. We investigate the conditions at which European banks
have been able to raise new equity capital by means of rights issues during the
global financial crisis, demonstrating the existence of a first-move advantage: within a SEO wave, banks that acted first were able to complete the capital
increase at more favorable conditions than their peers that acted later. We
also show that first-movers experienced higher valuation ratios at the final
cum-rights date compared to late-comers. As a result, first-movers obtained a double
advantage: they could offer a lower discount on a price that embedded an higher
valuation ratio.
Keywords: Equity issue, Rights issue, Market timing, Global financial crisis, First mover advantage, Seasoned equity offer
1. Introduction
We investigate the existence of a first-move advantage in the waves of
sea-soned equity offerings that European banks undertook in the aftermath of the
global financial crisis. The presence of waves of equity issues is a well
estab-lished phenomenon in the financial literature, as documented, among others, by
Choe et al. (1993), Dittmar and Dittmar (2008), Howe and Zhang (2010), and
Rau and Stouraitis (2011). This is typically interpreted as a form of market timing by managers who issue equity when market values are high, relative to
book values and past market values, and repurchase it when market values are
low (see Taggart (1977), Asquith and Mullins (1986), Korajczyk et al. (1992),
Hovakimian et al. (2001), and Baker and Wurgler (2002)). In fact, Graham
and Harvey (2001) report results from anonymous surveys documenting how
managers themselves admit to adopting market timing strategies. As a
conse-quence, when market participants observe a SEO announcement, they believe
that managers perceive the stocks to be overpriced, and consequently induce a
price decline1.
The negative reaction is also consistent with the pecking order view of
capi-tal structure by Myers and Majluf (1984), according to which firms issue equity
only when they have exhausted other forms of financing, and market
partici-pants therefore interpret SEO announcements as negative signals about a firm’s
financial conditions. These market timing and pecking order arguments, based
on informational asymmetries between insiders and outside investors, can also
be invoked to justify the discounting at which SEOs are commonly offered to
induce investors to buy the newly issued shares (Altınkılı¸c and Hansen (2003),
Corwin (2003), and Mola and Loughran (2004)).
However, SEOs completed by banks present peculiar characteristics, and
1See, among others, Smith (1986), Eckbo and Masulis (1995), and Corwin (2003) for the
US, Gajewski and Ginglinger (2002) and Jeanneret (2005) for France, Bolognesi and Gallo (2013) for Italy, Slovin et al. (2000), Iqbal (2008) and Armitage (2012) for the United Kingdom, and Armitage (1998) for both US and UK.
the announcement effect differs from that of other firms, as shown by Cornett
and Tehranian (1994), Cornett et al. (1998), and Dinger and Vallascas (2016).
In particular, when banks complete a SEO that is not a voluntary decision by managers, but rather an ‘involuntary’ capital increase required by banking
authorities to meet capital requirements, the announcement effect is smaller
(Cornett and Tehranian, 1994) or even not statistically significant (Cornett
et al., 1998). SEOs completed by banks in the aftermath of the global financial
crisis were not dictated by opportunistic market timing behavior, or voluntary
managerial decisions, but by the need to meet regulatory capital requirements
after having experienced large losses2, suggesting the possibility of anomalous
phenomena.
Nonetheless, while there is evidence concerning the announcement effect, to
the best of our knowledge there is no work done specifically on the determinants of SEO price discounts during a financial crisis focusing specifically on banks.
By examining the behavior of Euro-area banks during the global financial crisis,
this work aims at filling the gap in the literature. We build our analysis on top of
different results from extant theoretical and empirical works, that also motivate
the specific focus on the banking industry alone: i ) the effect of a financial
crisis on the degree of informational asymmetries between insiders and outside
investors is particularly severe for banks, due to a loss of confidence on the
quality of balance sheets caused by the uncertainty about the true value of assets
(Flannery et al., 2013); ii ) the existence of spillover effects caused by corporate
announcements from an announcing bank to non-announcing competitors, as reported by Lang and Stulz (1992), Kaufman (1994), Slovin et al. (1992), Slovin
et al. (1999), and Bessler and Nohel (2000); iii ) the fact that markets became
‘constrained’ in the sense that the supply of capital was limited, during the
2See, e.g., the paper by Steffen (2015) requested by the European Parliament’s Economic
and Monetary Affairs Committee to evaluate whether actions taken by banks to fill the capital shortfalls indicated by the European Central Bank have resulted in noticeable reactions in capital markets.
global financial crisis, as documented by Dissanaike et al. (2014); iv ) the smaller
negative stock price reaction following a SEO announcement for banks compared
to non-banks, which is likely due to the tight supervision and regulation of the industry, aimed at promoting financial stability, that reduces the degree
of asymmetric information and, consequently, the signaling effect of the SEO
announcement (Li et al., 2016). This difference decreases during the financial
crisis, because of the higher uncertainty about banks’ asset values, but it still
remains significant. These different lines of research indicate that the effects of
SEO announcements from banks present unique characteristics, calling for an
industry-specific analysis.
Based on these different findings we hypothesize the existence of a
‘first-move’ advantage in SEOs completed by banks during financial crises, as a
con-sequence of spillover effects, constrained capital supply, and uncertainty about the true value of a bank’s assets, so that those that are able to move more
quickly can complete their equity issuance at more favorable conditions – in
terms of a lower discount – than their followers.
Our main contributions are the following. First, we find evidence supporting
the first-move advantage hypothesis. Ceteris paribus, late-comers had to incur in
additional costs – in the form of a larger discount on the expected ex-rights price
– to raise new equity compared to first-movers. Second, contrary to the view
that higher valuation metrics may suggest overvaluation (Baker and Wurgler,
2002), hence calling for larger discounts to provide an appropriate incentive to
investors to take up the shares offered, we find that the discount is larger for banks with a lower market-to-book ratio. Third, at the last cum-rights trading
day, late-comers report a lower market to book ratio, everything else being
equal, compared to first-movers; this is consistent with the spillover effects of
banks’ SEO announcements documented by Slovin et al. (1992), and reinforces
the first-move advantage. As a result, being a first-mover has both a direct
and an indirect effect – through the market-to-book ratio – on the discount
offered during waves of SEOs taking place in constrained capital markets and in
to first-movers: starting from a price that already reflects a lower valuation,
they also have to offer a larger discount, both as a direct consequence of being
in the declining tail of the SEO wave, and because earlier announcements reduce their valuation ratio, which in turn calls for a larger discount. This implies that
delaying a SEO trying to strengthen the capital ratios of a bank by means of
alternative solutions (like the sale of assets, divestitures, or changing the asset
composition in order to reduce their risk) may end up imposing higher costs to
existing shareholders, if in the end the bank is nonetheless forced to complete
an equity issue to comply with regulatory requirements.
The paper proceeds as follows. In Section 2 we review the extant literature
and develop our hypotheses. We describe the data sample in Section 3, while
Section 4 is dedicated to our empirical analysis. Section 5 concludes our study.
2. Literature review and development of hypotheses
Studies in the literature show that corporate announcements by banks can
have a spillover effect on the stock price of other banks. For example, Lang
and Stulz (1992) report that bankruptcy announcements by banks can have a
negative effect on the stock returns of their competitors, as the bankruptcy of a bank can spread within the industry by inducing bank runs (Kaufman, 1994).
Slovin et al. (1992) instead examine the share price reactions following the
an-nouncement of common stock issues by commercial banks. They find that rival
commercial and investment banks experience a negative effect on their stock
re-turns, suggesting the existence of spillover effects. They also report that they do
not find any intra-industry effect when focusing on SEOs by industrial firms3.
Their results can be explained through the existence of a form of informational
externality in the banking industry, in the presence of asymmetric information
about the value of bank asset portfolios (see, e.g., Diamond and Dybvig (1983)
3In a more recent paper, Bradley and Yuan (2013) report instead the existence of a positive
spillover effect in a sample of SEO announcements where they explicitly exclude utilities and financial companies.
and Gorton (1985)). When a bank announces a SEO, it is conveying
informa-tion to market participants about the true value of its asset portfolio, and this
can act as a guidance also for the pricing of the assets of other banks, if their portfolios are perceived as being correlated. Similarly, both Slovin et al. (1999)
and Bessler and Nohel (2000) document a spillover effect of the announcement
of dividend cuts by a bank, with abnormal negative stock returns experienced
also by the other non-announcing banks. On the contrary, looking at large
cap-ital infusions completed by US financial institutions in a time frame including
the 2008 financial crisis, Elyasiani et al. (2014) find no spillover of equity issue
announcement on non-issuing institutions. However, they argue that this is not
necessarily a sign of the absence of spillover effects; it may instead reflect the fact
that, for the non-issuing sub-sample, the negative contagion effect is fully
com-pensated by a positive competitive effect. On the other hand, they also find that financial institutions that accepted the US government rescue funding through
the Troubled Asset Relief Program (TARP) had a positive spillover effect on the
ones that did not rely on it to raise additional capital. The complex conditions
of the time period they examine (2000-2009) may however affect their results,
making them hardly comparable with previous literature. Elyasiani et al. (2015)
instead report the existence of strong return and volatility spillovers both within
the banking industry and between the banking and insurance industry, and that
this effect has become even stronger during the 2007-2009 global financial crisis.
Another strand of relevant literature is the one concerning the possible
ex-istence of ‘windows of opportunities’ for the completion of seasoned equity of-ferings during which capital can be raised at more favorable conditions. This
typically happens because of two different reasons. A first explanation is based
on market timing arguments: managers issue new shares when they perceive
them to be overpriced, with a benefit for existing shareholders at the expense
of new ones (see, e.g. Taggart (1977), Korajczyk et al. (1992), or Baker and
Wurgler (2002)). Another explanation relies on the fact that asymmetric
in-formation between insiders and outside investors generates agency costs that
equity is used only after internal funds and debt capacity have been exhausted
(Myers and Majluf, 1984). Under such conditions, firms may reduce
informa-tion costs by timing their equity issues in periods when the level of asymmetric information is lower, hence raising equity capital at more favorable conditions.
Alternatively, different firms may simultaneously find themselves overlevered
due to reported losses, hence reaching the bottom level of the pecking order, as
it happened to banks during the global financial crisis, and this forces them to
restructure their balance sheet, generating a wave of SEOs in a short time span.
Choe et al. (1993) report how firms indeed tend to raise equity capital more
frequently in expansionary periods of the business cycle, supporting the market
timing hypothesis. In addition, the average negative stock price reaction to SEO
announcements is significantly lower in expansionary periods and in periods with
a relatively larger volume of equity financing. Similarly, Bayless and Chaplinsky (1996) find support for the existence of windows of opportunity, showing that
otherwise identical firms are able to raise equity capital at significantly
differ-ent conditions. In particular, they find that the average price reaction in hot
markets (i.e. periods with an high volume of equity issues) is significantly less
negative while the price reaction in cold markets is significantly more negative
than at other times, and this variation is not connected with differences in firm
or market characteristics across hot and cold markets, or with time trends.
Dis-sanaike et al. (2014) report evidence showing the importance of macroeconomic
conditions for SEO announcement effects on stock prices. In particular they
find that, during the financial crisis (but not in the pre-crisis period), firms that were quicker in raising significant amounts of capital made the capital-raising
environment more challenging for those that followed, making them experience
a more negative announcement return. This latter finding is particularly strong
in the case of open offers, while their evidence is not conclusive for rights issues
and private placements. Their results suggest that the informational content
of the announcement, during periods of constrained capital supply, produces a
larger (negative) abnormal return.
con-cerning the determinants of SEO discounting. Altınkılı¸c and Hansen (2003)
document how discounting in SEOs is typically higher for issuers with lower
stock prices and for those with greater stock return volatility, and in presence of larger amounts of capital raised. Overall, their results support the view that
the discount serves the purpose of compensating investors for the uncertainty
about firm value and covering placement costs. Corwin (2003) reports that SEO
discounting is higher for firms with high price uncertainty, and that it is strongly
affected by temporary price pressure, as indicated by its positive relation with
the relative offer size, a finding also confirmed by Mola and Loughran (2004).
Based on all these works, we formulate the hypotheses for our analysis. On
the one hand, the existence of waves of SEOs, together with the presence of
spillover effects of banks’ SEO announcements, suggests the possibility that the
timing of the issue within the SEO wave itself may affect the conditions at which firms are able to raise capital. Indeed, the spillover effects of SEO
an-nouncements may allow for a situation where banks that are able to move first
in raising capital may induce a negative effect on their competitors’ stock prices,
hence reducing their valuation and making the environment more difficult for
subsequent equity offerings. Both bank-level and SEO characteristics may also
affect the bank valuation metrics and the discount offered in the SEO, so proper
controls need to be applied in order to correctly identify potential effects of SEO
timings on banks’ valuations and on the discount at which new shares are issued.
Therefore, these considerations lead us to postulate the following hypothesis:
H1. A bank market value is negatively affected by the volume of capital
raised through SEOs by other banks in the preceding months.
In addition, the existence of SEO waves and the presence of constrained
markets for raising new equity capital during financial crises determine a larger
negative announcement effect, as described by Dissanaike et al. (2014),
indicat-ing that markets react more strongly later in the SEO wave. Instead of focusindicat-ing
attention on the conditions at which the bank is able to raise capital, and the
incentive it has to provide in the form of discount to the theoretical ex-rights
price, after the markets have incorporated the informational content of the SEO announcement into the cum-rights price. We formulate our second hypothesis,
stating that banks raising capital later, within a SEO wave, not only experience
a more negative announcement effect, and more negative valuation metrics, but
also have to offer a larger discount to induce investors to take up the newly
issued shares.
H2. The discount at which new shares are offered increases with the volume
of capital raised through SEOs by other banks in the preceding months.
If both hypotheses hold, then first-movers would benefit from a double ad-vantage compared to late-comers: they would be able to issue new shares
offer-ing a lower discount, applied on a price that already reflects higher valuation
multiples.
3. The dataset
We analyze a sample of seasoned equity offerings completed through a rights
issue between 2008 and 2017 by listed banks incorporated in countries
belong-ing to the Euro area, excludbelong-ing equity issues completed by means of private
placements or open market offers4.
We do not consider private placements because their conditions may also
depend on the nature of the underwriting party, so that the price discount may
reflect deal-specific or even non-financial considerations5. In fact, the stock price
4We only consider the original country members of the Euro Area, to avoid effects connected
with the currency change that may affect our results.
5For example, a bank may conclude a private placement at apparently unfavorable
con-ditions, in order to have its shares purchased by a specific investor, because the deal may provide some positive information to the market. See, e.g., the $5 billion investment made by Berkshire Hathaway, the holding company led by Warren Buffett, in Goldman Sachs in September 2008. In a press release illustrating the deal, Goldman Sachs explicitly stated
reaction following a private placement is typically positive, in contrast with the
classic negative price reaction follwing a public offering of new equity (see Wruck
(1989) and Hertzel and Smith (1993) for the US market, Kato and Schallheim (1993) for the Japanese market, and Normazia et al. (2013) for Malaysia), again
suggesting that private placements have a peculiar behavior compared to other
forms of equity issues. The reasons for the exclusion of open offers are instead
twofold. First, rights issues allow existing shareholders to underwrite the issue,
so that they can maintain the same level of ownership as before the offering
if they exercise the nil-paid rights, or be compensated for their reduction in
ownership if they do not participate in the new issue. This means that the issue
price and discount are less affected by considerations concerning the change in
ownership, control premia or block holdings (Muhtaseb and Philippatos, 1995).
Secondly, a rights issue has a defined number of shares to be issued, and an offering price, which are necessary to calculate the theoretical ex-rights price
(‘TERP’) and the discount offered to those exercising their rights. An open
offer, instead, typically has a wide range between a minimum and a maximum
number of shares that may be issued, so that the resulting ex-ante discount is
more cumbersome to estimate6. Finally, we exclude banks for which we could
not find the required information. The resulting sample comprises 96 rights
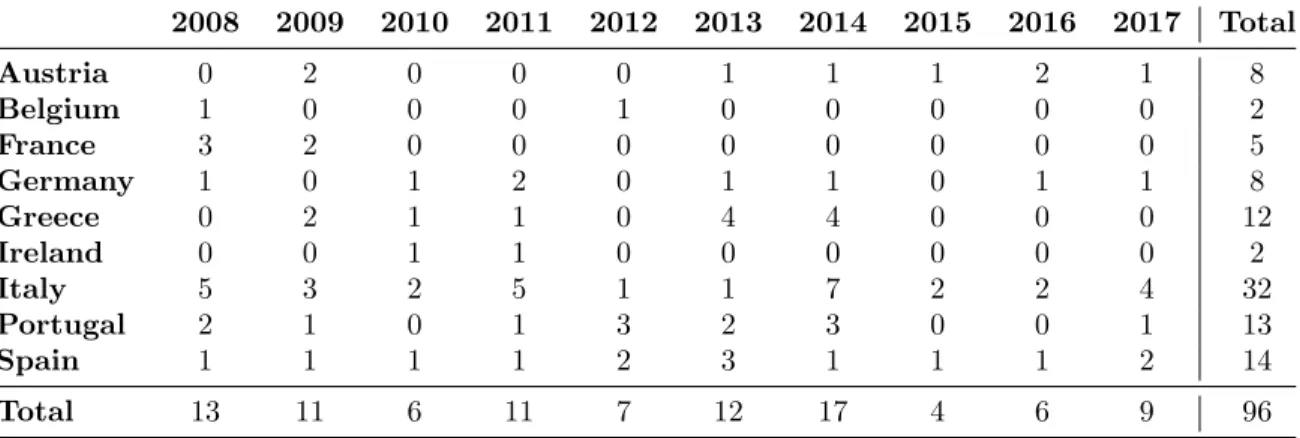
issues; Table 1 summarizes their geographical and temporal distribution.
that “We view it as a strong validation of our client franchise and future prospects”. See the full press release at (http://www.goldmansachs.com/media-relations/press-releases/ archived/2008/berkshire-hathaway-invest.html) (retrieved on Feburary 8th, 2018).
6It is worth noting, however, that this constraint on our sample construction is not
par-ticularly binding: when searching for SEOs completed as open market offers in the sample period, we could only find three occurrences. This is due to the fact that the rights issue is the standard way European companies adopt to raise new equity, in accordance with the Eu-ropean Union’s Second Company Law Directive, that introduced two key principles for SEOs to harmonize the regulation of corporations within the EU. First, Article 25, Paragraph 1, states that any increase in capital must be decided upon by the general shareholders’ meeting. Second, Article 29 provides that when capital is increased and the new shares are paid in cash, these must be offered on a preemptive basis to shareholders in proportion to their holdings.
[Table 1 about here.]
We use a variety of data sources to collect our data. In particular, we
rely on Bloomberg to identify all equity issues made by banks in any of the countries considered by means of a rights issue. We then retrieve the seasoned
equity offering documents from each bank’s website, in order to gather specific
information concerning the equity issue: the issue price, the issue size, and the
issue price-fixing date. We obtain all accounting data from Worldscope, while
market data are from Datastream.
The two dependent variables for our analysis are the market-to-book (MTB )
ratio, the most commonly used valuation multiple for banks, and the discount
to TERP, both measured at the final price-fixing date, i.e. the last day in which
stocks traded cum-rights. As for the market-to-book ratio, we calculate it as the
ratio between the market capitalization at the price-fixing date and the book value of equity at the latest quarterly financial statement before the price-fixing
date. As for the discount to TERP, we measure it as the difference between the
issue price and the TERP, divided by the issue price itself. In turn, we obtain
the TERP by dividing the expected market capitalization of the bank following
the equity issue by the total number of shares after the equity issuance, under
the assumption that the issue itself is fully underwritten. The expected market
capitalization is the sum between the total amount of funds raised through the
equity offering and the total market capitalization at the price-fixing date7.
We use a set of bank-level variables and financial market indicators as
po-tential explanatory variables of differences in both the MTB and the discount to TERP. We first investigate the role of banks’ profitability on both variables,
by means of two indicators: the Profit margin, that represents the ratio between
operating income before taxes and total bank revenues, and the asset turnover,
7Note that, under this definition of the discount to TERP, we would obtain a negative
value of the discount when the issue price is lower than the TERP. In the following analysis, for ease of interpretation of the regression coefficients, we take the opposite of the discount to TERP (i.e. we change its sign) as our variable of interest.
defined as the ratio between total revenues and total assets. While the former is
a proxy for the operating efficiency of the bank, measuring its ability to produce
earnings from reported revenues, the latter indicates the ability to deploy assets to generate revenues. We then consider a set of variables measuring the
finan-cial conditions of a bank. NPL (% loans) is the ratio between non-performing
loans and total outstanding loans, while NPL (coverage %) is the ratio between
non-performing loans and the reserve for loan losses. TIER1 gap measures the
gap in the TIER1 capital that the bank has to fill through the equity offering,
based on the Basel Accord requirements at the time of the offering itself. Size
is the bank size, measured as the natural logarithm of total assets. Debt ratio
is the ratio between total debt and total common equity. Offer delevering is
the delevering effect induced by the equity issue, and it is defined as the ratio
between the nominal size of the offer and the total debt outstanding. Offer size (%) measures the relative size of the offer compared to the market
capitaliza-tion before the equity issue, and is measured as the ratio between the value
of the equity offering and the market value of equity at the price-fixing date.
Majority is a dummy variable equal to one if the relative size of the equity
of-fering represents more than 50% of the expected market capitalization after the
equity offering (i.e. if Offer size (%) is greater than 100%). Government is a
dummy variable equal to one if a national Government holds shares in the bank.
Volatility is a measure of stock price volatility for the corresponding bank in the
twelve months before the price-fixing date. Finally, we include the Euribor-OIS
spread8 as a measure of the health of the banking market (Sengupta and Tam, 2008).
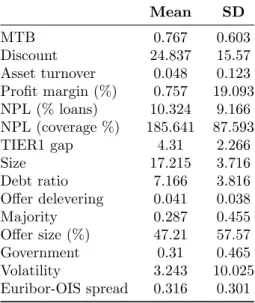
Table 2 reports the descriptive statistics of our variables of interest.
[Table 2 about here.]
We also check for potential multicollinearity problems in the econometric
8More specifically, we use the 3-month Euribor, and the Eonia (Euro OverNight Index
analysis that follows by looking at the correlation matrix among the variables,
reported in Table 3. As our results indicate, our variables do not display high
levels of correlations. We also check the variable inflation factor and it is well below the threshold level. Therefore, multicollinearity is not a serious concern
in our study.
[Table 3 about here.]
Finally, we construct a set of indicators in order to distinguish first-movers
from late-comers. In order to do so, we first collect the currency figures on monthly shares issued by listed euro-area companies from the European Central
Bank (‘ECB’) website. From a geographic standpoint, we collect data for each
country and for the entire Euro-area9. As for the sectors of companies, we
obtain data both at the aggregate level and separately for financial and
non-financial corporations10. The first indicator we build is QIF (Quarter Issues
-Financials), and it is obtained as the ratio between the value of equity issues
made by financial institutions in the last quarter, and those made in the past
twelve months. We consider first movers those equity issues that took place in
periods with high values of the QIF index, while late comers are those associated
with low values of the index11. Similarly, we also construct an alternative index, SIF (Semester Issues - Financials), defined as the ratio between the value of
9Note that we use what the ECB calls the Euro Area (changing composition) as definition
of Euro Area, which considers, in any year, only those countries which use the Euro as official currency in that year, to account for all the equity issues in which the Euro is currency of denomination. We also run the same analysis using the Euro Area 19 (fixed composition) definition, which instead includes for all years the whole set of 19 Euro-area countries that currently adopt the Euro as the official currency. We find that results are unaffected by the change.
10The ECB relies on the ESA (European System of National and Regional Accounts) 2010
for the sectoral breakdown.
11A lower value of the index suggests that a small amount of equity capital has been raised
by financial institutions in the most recent quarter (i.e. the month of the equity offering, and the two before it) compared to the total value raised in the previous 12 months, hence suggesting that most of the equity issues took place in previous quarters, and viceversa.
equity issues made by financial institutions in the most recent semester up to
the month of the equity offering itself, and those made in the latest year12.
4. The empirical analysis
Based on the hypotheses formulated in Section 2, our empirical analysis is
divided in two parts. First, we investigate whether, during waves of seasoned
equity offerings, first-movers are able to undertake the issue while experiencing, ceteris paribus, an higher valuation than the late-comers at the price-fixing
date, due to the spillover effects of SEO announcement in the banking industry.
In order to test this hypothesis, we analyze the market-to-book ratio of each
bank. Second, we test whether late-comers are also forced to offer an higher
discount to TERP in order to attract investors, as predicted by the constrained
market hypothesis (Dissanaike et al., 2014). If both hypotheses are verified,
late-comers, compared to first-movers, would suffer from a double penalization:
they sell shares at a larger discount on a stock price already reflecting a lower
valuation multiple, making the SEO even more unfavorable. This would, in
turn, indicate that there is an advantage in being a first mover when, due to market conditions, several banks are required to raise new equity capital in a
short time span.
4.1. Valuation at the price-fixing date
We analyze the determinants of the market-to-book ratio by means of an ordinary least squares regression, with cluster-corrected standard errors to
ac-count for the fact that the same bank may have completed more than one SEO
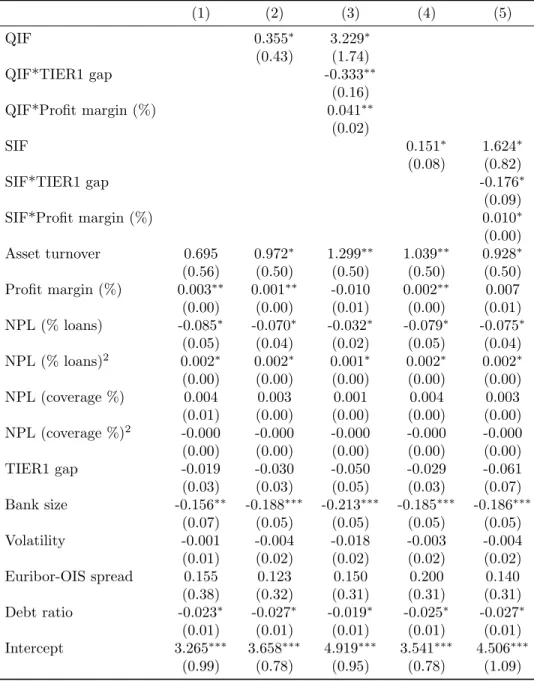
in our sample. Table 4 reports our findings.
[Table 4 about here.]
12We also replicate the analysis with the same set of indicators, though obtained by using
all equity issues, rather than only those completed by financial corporations, but we do not find significant results, as one would expected in a segmented and constrained market as documented by Dissanaike et al. (2014). Results are available upon request.
Column (1) reports the coefficients for a model without our indicators of
first-move status. We find that an higher profit margin is associated with an
higher valuation multiple, while higher levels of leverage and of non-performing loans reduce the market-to-book ratio13.
Columns (2) and (4) introduce the two first-mover indicators (QIF, and SIF,
respectively) in addition to the various bank characteristics. We find that
first-movers experienced an higher valuation multiple, as indicated by the positive
and significant coefficients for QIF and SIF.
In Columns (3) and (5) we interact the two first-move indicators with both
a measure of banks’ financial conditions (TIER1 gap) and a profitability ratio
(profit margin). If the spillover hypothesis holds, we should observe that the
negative effect on the valuation ratio for late-comers is smaller for banks with
better profitability, and stronger for those in worse financial conditions. In-deed, we find a positive coefficient for the interaction between the profit margin
and both our first-move indicators, suggesting that the penalization for being
a late-comer is smaller for banks with higher profitability. In addition, we find
a negative coefficient for the interaction between the first-move indicator and
the gap in the TIER1 capital ratio that the bank has to fill with the capital
increase14. This indicates that the negative effect for being a late-comer is
stronger for banks with worse financial conditions.
Overall, our findings indicate that banks were priced based both on their
profitability and their financial conditions, and SEO announcements produced
13Note that we find a significant quadratic – and convex – relationship for the percentage
of NPLs on total loans. Given the values of the coefficient, and the fact the the NPL variable is naturally bounded between 0 and 1, the corresponding portion of the estimated curve is decreasing in that interval. Therefore, we obtain a negative relationship, with a slope that decreases (in absolute terms) as the independent variable increases, indicating that NPLs have a negative marginal effect that decreases as NPLs themselves increase.
14Recall that TIER1 gap is measured as the difference between the TIER1 ratio required
by the banking authority and the level of the same ratio before the equity offering. An higher value for this variable therefore corresponds to worse financial conditions.
significant spillover effects, so that, correcting for their individual conditions,
late-comers had lower valuation multiples than first-movers. This is reinforced
by the results obtained when interacting a first-move indicator with measures of profitability and financial conditions, indicating that the spillover effect is
lessened for banks with higher profitability, while it is reinforced for those with
worse financial conditions.
4.2. The discount to TERP
In this second step, we investigate the determinants of the discount to TERP,
that is, the effective discount at which shares are issued in the SEO, taking into
account the dilutive effect that the issue has on the ex-rights expected market
price. As before, we use an ordinary least squares estimator, with cluster-robust
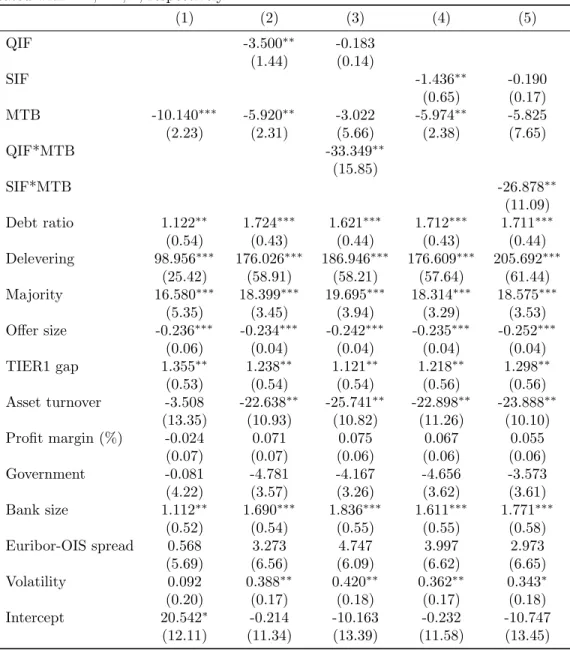
standard errors. Table 5 reports our findings.
[Table 5 about here.]
Like in Section 4.1, we first estimate a model without including our
first-move indicators (see Column (1) in the Table). Banks with an higher debt ratio,
as well as a larger delevering effect produced by the SEO, have to offer a larger discount. Similarly, an higher gap in Tier 1 capital to be filled requires a larger
discount. Finally, banks offering a number of shares that would represent the
majority of the outstanding capital after the SEO also have to offer a larger
discount. This effect is partially mitigated by the negative coefficient for the
offer size, suggesting that the relationship between offer size and discount is
non-linear, and severely affected by whether new shares represent the majority of
the future outstanding capital. On the contrary, firms with an higher valuation
metric (the MTB ratio) are able to offer a lower discount. Columns (2) and
(4) respectively introduce our two first-move indicators: QIF, and SIF. In both
cases, for what matters most to our analysis, we find that the higher the value of the two first-move indicators, the lower is the discount offered, indicating
that first-movers were able to offer a lower discount. On the other hand, the
two indicators, with a relevant difference only observed for the effect of the
volatility in stock returns (Volatility): while in the initial regression it was
not significant, when including a first-move indicator it becomes statistically significant, and banks with higher uncertainty in their stock price (a proxy for
financial risk) have to offer a larger discount.
Columns (3) and (5) add an interaction term between the corresponding
first-move indicator and the market-to-book ratio. It is interesting to notice
that the resulting coefficient is negative and statistically significant. Therefore,
the effect of the valuation metric on the discount offered is deeply connected
with the timing of the SEO. In particular, assuming that a lower valuation
ratio is an indicator of worse financial conditions (Fama and French, 1995)
and, consequently, of the suffering of stronger financial constraints, then this
result indicates that more constrained banks have to incur additional costs to raise new capital, and this cost increases for late-comers. We interpret this as
an indication that the ability of first-movers to offer a lower discount in the
SEO is a consequence of constrained capital supply during the global financial
crisis, caused by a negative change in risk preferences. Hence, by moving first
a bank has access to a larger supply of capital. Those that follow, instead,
face a reduction in capital supply, and therefore have to offer a larger discount.
Moreover, under such circumstances, investors will prefer assets with better
financial conditions, because of their lower risk. Consequently, banks with a
lower market-to-book ratio, that is the result –among other factors– of worse
financial conditions (as shown in Table 4), will have to incur an additional cost in order to raise capital, and this cost increases with the decrease of capital
supply (i.e. when a bank is a late-comer).
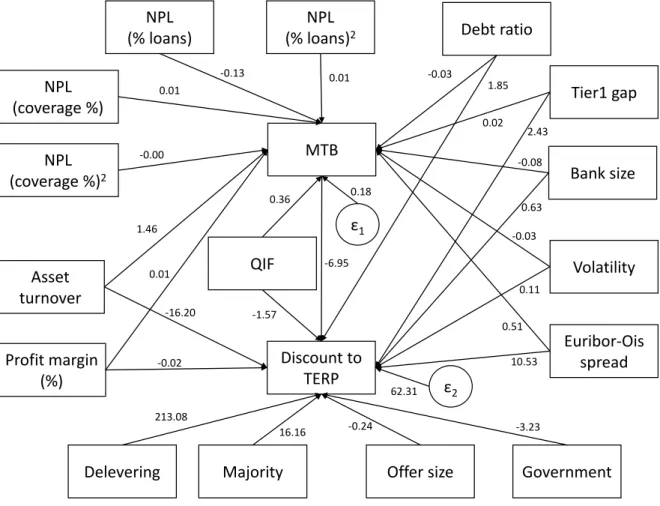
4.3. Path analysis
Our analysis in the previous paragraphs suggests that being a first-mover produces both a direct effect on the discount to TERP and an indirect one,
through its effect on the MTB ratio which, in turn, affects the discount itself.
approach is an extension of multiple regressions, and it is commonly used to
decompose various factors affecting an outcome into direct and indirect
com-ponents. For parsimony, we employ a recursive path model (i.e.: all paths flow in only one direction) with observable variables. A direct path includes only
one coefficient while an indirect path includes a coefficient between the source
variable (e.g. the QIF indicator) and the mediating variable (in our case, the
MTB ratio), as well as a path between the mediating variable and the
out-come variable. The total magnitude of the indirect effect can be obtained as
the product of these two path coefficients. In our case, the source variable on
which we focus is the QIF indicator, while the mediating variable is the MTB
ratio and the outcome variable is the discount to TERP15. Figure 1 provides
for a graphical representation of the estimated paths, while Table 6 reports the
estimated coefficients for both direct (Column (1)), indirect (Column (2)), and total paths (Column (3)), as well as their statistical significance, related to the
analysis of the discount to TERP.
[Figure 1 about here.]
It is immediate to note that the first-mover indicator QIF has both a
sig-nificant direct effect and a sigsig-nificant indirect effect. This reinforces our
previ-ous finding that first-movers can complete the SEO at better conditions than late-comers: they sell shares at a lower discount, both because there is a
di-rect advantage from being a first-mover, and because the MTB ratio, which
also suffers from a first-move advantage (due to the spillover effects of SEO
announcements), negatively contributes at determining the discount to TERP.
[Table 6 about here.]
Other factors, based on the estimated total paths, significantly affect the
dis-count the bank has to offer. A larger disdis-count is associated with a higher debt
15Similar results are obtained when using the SIF indicator rather than the QIF indicator.
To avoid a lengthy and repetitive discussion, we do not report these results, which are however available upon request.
ratio, a larger gap in TIER1 capital that needs to be filled, or with an higher
delevering effect. This is likely due to the fact that new capital is provided not to
undertake new projects or expand the activity, but rather to strengthen the bal-ance sheet of the issuing bank, and this forces the bank itself to offer a stronger
incentive to investors when its financial conditions are more problematic, in
or-der to ensure that the SEO is fully unor-derwritten. This interpretation is also
consistent with the negative effect found for the asset turnover and the profit
margin, indicating that more efficient and profitable banks, which are likely to
be perceived as an investment with a lower risk, are able to raise capital at a
lower discount. We do not find a significant effect on the discount neither for
the presence of a national government as a shareholder of the issuing bank, nor
for market conditions (other than the first-move measures).
5. Conclusions
The aim of this paper is to perform an empirical investigation into the
ex-istence of a first-move advantage in the waves of seasoned equity offerings that
European banks undertook over the 2008-2017 period, in the aftermath of the
global financial crisis. The existence of a first-move advantage is a potential consequence of the well-documented spillover effects that SEO announcements
by a bank produce on its competitors (Slovin et al., 1992) together with the
presence of constrained capital supply during the global financial crisis
(Dis-sanaike et al., 2014). To this purpose, we construct two different measures of
first-move condition and examine whether they have an impact on two specific
characteristics of equity offerings, focusing on a sample of 96 SEOs completed
(in the form of rights issues) by European banks in the sample period. In
par-ticular, we first analyze the factors that affect the market-to-book ratio (i.e.,
the most common valuation multiple for banks) observed on the last day of
stocks trading cum-rights; then, we examine the discount to TERP, that is, the discount at which new shares are offered with respect to the expected market
Based on our analysis, first-movers experience a double advantage compared
to late-comers. First, the market-to-book ratio is higher for first-movers,
indi-cating that SEO announcements indeed produce a negative spillover effect and reduce equity values also for non-announcing banks, so that late-comers in a
SEO wave are priced at lower valuation multiples. In addition, we find that
the discount to TERP is higher for late-comers: in constrained capital markets,
when risk aversion is high and capital supply is limited, like during the global
financial crisis (Dissanaike et al., 2014), banks that raise capital later are forced
to provide a stronger incentive, in the form of a higher discount, in order to
complete the equity offering. Finally, the market-to-book ratio itself produces a
negative effect on the discount to TERP, indicating that banks with lower
mar-ket valuation metrics also have to offer a larger discount to motivate investors.
This contrasts with the idea that an higher valuation metric may be a sign of overvaluation (Baker and Wurgler, 2002), while it is fully consistent with the
view that the market-to-book ratio acts as a proxy for distress risk (Fama and
French, 1995), so that banks which are perceived as having an higher risk of
financial distress have to incur additional costs to attract investors. This is also
supported by the results indicating that an higher discount is associated with
higher leverage, higher gap in TIER1 capital, and lower asset turnover, all bank
characteristics that are associated with an higher risk of financial distress. In
the end, since late-comers have, ceteris paribus, a lower market-to-book ratio,
they experience a doubly negative effect on the conditions at which they are
able to raise new equity funds.
Overall, our findings indicate that, in constrained capital markets, and with
spillover effects of SEO announcements, first-movers are able to complete SEOs
at more favorable conditions, both because they are able to offer a lower
dis-count, and because they can apply this discount on a price that, everything else
being equal, implies an higher valuation. On the contrary, late-comers
expe-rience both the negative spillover effect, in the form of a lower valuation, and
the need to provide a stronger incentive, in the form of a larger discount. This
advantage for banks undertaking SEOs. This fact has both managerial as well
as policy implications.
For bank managers, our findings indicate that trying to find alternative solutions to strengthen a bank’s balance sheet in order to avoid the negative
consequences of a SEO may end up producing much higher costs for the bank,
if it ultimately fails to meet capital requirements and it is forced to undertake
the equity issue. In fact, by being late in the SEO wave the bank would have to
offer conditions that are penalizing compared to the ones it could have offered
by directly choosing the SEO as a way to recapitalize.
For bank authorities, the existence of a first-move advantage in banks’ SEOs
implies that they need to pay special attention when timing the release of
infor-mation concerning requests of balance sheet restructuring for supervised banks,
as their behavior may affect the conditions at which banks are able to raise the required capital. This is especially true when several banks need to raise capital
in periods of market turbulence, when capital supply is limited and spillover
effects may be severe. This area, that goes beyond the scope of this paper, is
ripe for future research.
References
Altınkılı¸c, O. and Hansen, R. S. (2003). Discounting and underpricing in
sea-soned equity offers. Journal of Financial Economics, 69(2):285–323.
Armitage, S. (1998). Seasoned equity offers and rights issues: a review of the
evidence. The European Journal of Finance, 4(1):29–59.
Armitage, S. (2012). The calculation of returns during seasoned equity offers.
The European Journal of Finance, 18(5):393–417.
Asquith, P. and Mullins, D. W. (1986). Equity issues and offering dilution.
Journal of Financial Economics, 15:61–89.
Baker, M. and Wurgler, J. (2002). Market timing and capital structure. The
Bayless, M. and Chaplinsky, S. (1996). Is there a window of opportunity for
seasoned equity issuance? Journal of Finance, 51(1):253–278.
Bessler, W. and Nohel, T. (2000). Asymmetric information, dividend reductions, and contagion effects in bank stock returns. Journal of Banking & Finance,
24(11):1831–1848.
Bolognesi, E. and Gallo, A. (2013). The ex-date effect of rights issues: Evidence
from the Italian stock market. Applied Financial Economics, 23(2):149–164.
Bradley, D. and Yuan, X. (2013). Information spillovers around seasoned equity
offerings. Journal of Corporate Finance, 21:106–118.
Choe, H., Masulis, R. W., and Nanda, V. (1993). Common stock offerings across
the business cycle. Journal of Empirical Finance, 1(1):3–31.
Cornett, M. M., Mehran, H., and Tehranian, H. (1998). Are financial markets
overly optimistic about the prospects of firms that issue equity? Evidence
from voluntary versus involuntary equity issuances by banks. The Journal
of Finance, 53(6):2139–2159.
Cornett, M. M. and Tehranian, H. (1994). An examination of voluntary versus
involuntary security issuances by commercial banks. Journal of Financial
Economics, 35(1):99–122.
Corwin, S. A. (2003). The determinants of underpricing for seasoned equity
offers. The Journal of Finance, 58(5):2249–2279.
Diamond, D. W. and Dybvig, P. H. (1983). Bank runs, deposit insurance, and
liquidity. Journal of Political Economy, 91(3):401–419.
Dinger, V. and Vallascas, F. (2016). Do banks issue equity when they are poorly
capitalized? Journal of Financial and Quantitative Analysis, 51(05):1575–
Dissanaike, G., Faasse, J., and Jayasekera, R. (2014). What do equity issuances
signal? A study of equity issuances in the UK before and during the
finan-cial crisis. Journal of International Money and Finance, 49:358–385.
Dittmar, A. K. and Dittmar, R. F. (2008). The timing of financing decisions:
An examination of the correlation in financing waves. Journal of Financial
Economics, 90(1):59–83.
Eckbo, B. E. and Masulis, R. W. (1995). Seasoned equity offerings: a
sur-vey. In Finance (North-Holland, Handbooks of Operations Research and
Management Science), volume 9, pages 1017–1072.
Elyasiani, E., Kalotychou, E., Staikouras, S. K., and Zhao, G. (2015). Return
and volatility spillover among banks and insurers: Evidence from pre-crisis
and crisis periods. Journal of Financial Services Research, 48(1):21–52.
Elyasiani, E., Mester, L. J., and Pagano, M. S. (2014). Large capital infusions,
investor reactions, and the return and risk-performance of financial
institu-tions over the business cycle. Journal of Financial Stability, 11(1):62–84.
Fama, E. F. and French, K. R. (1995). Size and book-to-market factors in
earnings and returns. The Journal of Finance, 50(1):131.
Flannery, M. J., Kwan, S. H., and Nimalendran, M. (2013). The 2007-2009
financial crisis and bank opaqueness. Journal of Financial Intermediation,
22(1):55–84.
Gajewski, J.-F. and Ginglinger, E. (2002). Seasoned equity issues in a closely held market: Evidence from France. European Finance Review, 6(3):291–
319.
Gorton, G. (1985). Bank suspension of convertibility. Journal of Monetary
Economics, 15(2):177–193.
Graham, J. R. and Harvey, C. R. (2001). The theory and practice of corporate
finance: evidence from the field. Journal of Financial Economics,
Hertzel, M. and Smith, R. L. (1993). Market discounts and shareholder gains
for placing equity privately. The Journal of Finance, 48(2):459–485.
Hovakimian, A., Opler, T., and Titman, S. (2001). The debt-equity choice. The Journal of Financial and Quantitative Analysis, 36(1):1.
Howe, J. S. and Zhang, S. (2010). SEO cycles. Financial Review, 45(3):729–741.
Iqbal, A. (2008). The importance of the sequence in UK rights issues. Journal
of Business Finance & Accounting, 35(1-2):150–176.
Jeanneret, P. (2005). Use of the proceeds and long-term performance of French
SEO firms. European Financial Management, 11(1):99–122.
Kato, K. and Schallheim, J. S. (1993). Private equity financings in Japan and
corporate grouping (keiretsu). Pacific-Basin Finance Journal, 1(3):287– 307.
Kaufman, G. G. (1994). Bank contagion: A review of the theory and evidence.
Journal of Financial Services Research, 8(2):123–150.
Korajczyk, R. a., Lucas, D. J., and McDonald, R. L. (1992). Equity issues with
time-varying asymmetric information. Journal of Financial and
Quantita-tive Analysis, 27(3):397–417.
Lang, L. H. P. and Stulz, R. (1992). Contagion and competitive intra-industry
effects of bankruptcy announcements. An empirical analysis. Journal of
Financial Economics, 32(1):45–60.
Li, H., Liu, H., Siganos, A., and Zhou, M. (2016). Bank regulation, financial
crisis, and the announcement effects of seasoned equity offerings of US
commercial banks. Journal of Financial Stability, 25:37–46.
Mola, S. and Loughran, T. (2004). Discounting and clustering in seasoned equity
Muhtaseb, M. R. and Philippatos, G. C. (1995). Shareholder wealth effects of
common stock offerings. Global Finance Journal, 6(2):175–193.
Myers, S. C. and Majluf, N. S. (1984). Corporate financing and investment
decisions when firms have information that investors do not have. Journal
of Financial Economics, 13(2):187–221.
Normazia, M., Hassan, T., Ariff, M., and Shamsher, M. (2013). Private
place-ment, share prices, volume and financial crisis: An emerging market study.
Global Finance Journal, 24(3):203–221.
Rau, P. R. and Stouraitis, A. (2011). Patterns in the timing of corporate event
waves. Journal of Financial and Quantitative Analysis, 46(1):209–246.
Sengupta, R. and Tam, Y. (2008). The LIBOR-OIS spread as a summary
indicator. Economic Synopses, (25):2008.
Slovin, M., Sushka, M., and Lai, K. (2000). Alternative flotation methods,
adverse selection, and ownership structure: Evidence from seasoned equity
issuance in the U.K. Journal of Financial Economics, 57(2):157–190.
Slovin, M. B., Sushka, M. E., and Polonchek, J. A. (1992). Informational
exter-nalities of seasoned equity issues. Differences between banks and industrial
firms. Journal of Financial Economics, 32(1):87–101.
Slovin, M. B., Sushka, M. E., and Polonchek, J. A. (1999). An analysis of
con-tagion and competitive effects at commercial banks. Journal of Financial
Economics, 54(2):197–225.
Smith, C. W. (1986). Investment banking and the capital acquisition process.
Journal of Financial Economics, 15(1-2):3–29.
Steffen, S. (2015). Capital shortfalls in SSM banks: How much progress has
been made? Technical report.
Taggart, R. A. (1977). A model of corporate financing decisions. The Journal
Wruck, K. H. (1989). Equity ownership concentration and firm value. Journal
Table 1: Geographical and temporal distribution of the rights issue sample. 2008 2009 2010 2011 2012 2013 2014 2015 2016 2017 Total Austria 0 2 0 0 0 1 1 1 2 1 8 Belgium 1 0 0 0 1 0 0 0 0 0 2 France 3 2 0 0 0 0 0 0 0 0 5 Germany 1 0 1 2 0 1 1 0 1 1 8 Greece 0 2 1 1 0 4 4 0 0 0 12 Ireland 0 0 1 1 0 0 0 0 0 0 2 Italy 5 3 2 5 1 1 7 2 2 4 32 Portugal 2 1 0 1 3 2 3 0 0 1 13 Spain 1 1 1 1 2 3 1 1 1 2 14 Total 13 11 6 11 7 12 17 4 6 9 96
Table 2: Summary statistics
Summary statistics for the variables describing both bank characteristics and conditions of the seasoned equity offering. SD indicates the standard deviation. MTB is the market-to-book ratio. Discount is the discount to TERP. NPL indicates non-performing loans.
Mean SD MTB 0.767 0.603 Discount 24.837 15.57 Asset turnover 0.048 0.123 Profit margin (%) 0.757 19.093 NPL (% loans) 10.324 9.166 NPL (coverage %) 185.641 87.593 TIER1 gap 4.31 2.266 Size 17.215 3.716 Debt ratio 7.166 3.816 Offer delevering 0.041 0.038 Majority 0.287 0.455 Offer size (%) 47.21 57.57 Government 0.31 0.465 Volatility 3.243 10.025 Euribor-OIS spread 0.316 0.301
T able 3: Correlation matrix The T able sho ws the correlation matrix b et w een our tw o indep enden t v ari a b les (MTB and Disc ount ) and the v ariables de-scribing b o th bank characteristics and conditions of the seasoned equit y offering. . MTB is the mark et-to-b o ok ratio. Disc ount is the discoun t to TE R P . NPL indicates non-p erforming loans. MTB Discoun t Asset turno v er Profit margin (%) NPL (% loans) NPL (co v erage %) TIER1 gap Size Debt ratio Offer delev ering Offer size (%) V olatilit y Eurib or OIS spread 1,00 t -0,18 1,00 turno v er 0,28 -0,09 1,00 margin (%) 0,27 0,04 0,08 1,00 (% loans) -0,33 0,09 -0,25 -0,30 1,00 (co v erage %) -0,27 0,06 -0,35 -0,10 0,64 1,00 gap 0,12 0,34 0,06 0,24 -0,09 -0,02 1,00 0,06 0,18 -0,03 0,15 -0,28 -0,12 0,34 1,00 ratio 0,02 0,17 0,07 -0,17 -0,07 -0,21 0,12 0,33 1,00 delev ering -0,17 0,05 -0,10 -0,30 0,43 0,24 -0,22 -0,20 0,04 1,00 size (%) -0,32 0,00 -0,22 -0,29 0,24 0,11 0,13 0,28 0,51 0,49 1,00 olatilit y -0,20 -0,13 -0,02 -0,28 0,33 0,24 -0,35 -0,87 -0,33 0,16 -0,31 1,00 or-OIS spread 0,35 0,21 0,10 0,07 -0,46 -0,24 0,44 0,42 0,23 -0,21 0,08 -0,37 1,00 29
Table 4: Determinants of Market-to-Book ratio
The Table reports the results of an ordinary least squares regression, with cluster-robust standard errors (reported in parenthesis), for the determinants of the market-to-book ratio. QIF and SIF are our two alternative first-move indicators, obtained as the ratio of the amount of capital raised through SEOs by financial institutions respectively in the last quarter or in the last semester, divided by the total amount raised in the last twelve months. Statistical signif-icance at the 1%, 5%, and 10% is indicated with ***, ** , *, respectively.
(1) (2) (3) (4) (5) QIF 0.355∗ 3.229∗ (0.43) (1.74) QIF*TIER1 gap -0.333∗∗ (0.16) QIF*Profit margin (%) 0.041∗∗ (0.02) SIF 0.151∗ 1.624∗ (0.08) (0.82) SIF*TIER1 gap -0.176∗ (0.09) SIF*Profit margin (%) 0.010∗ (0.00) Asset turnover 0.695 0.972∗ 1.299∗∗ 1.039∗∗ 0.928∗ (0.56) (0.50) (0.50) (0.50) (0.50) Profit margin (%) 0.003∗∗ 0.001∗∗ -0.010 0.002∗∗ 0.007 (0.00) (0.00) (0.01) (0.00) (0.01) NPL (% loans) -0.085∗ -0.070∗ -0.032∗ -0.079∗ -0.075∗ (0.05) (0.04) (0.02) (0.05) (0.04) NPL (% loans)2 0.002∗ 0.002∗ 0.001∗ 0.002∗ 0.002∗ (0.00) (0.00) (0.00) (0.00) (0.00) NPL (coverage %) 0.004 0.003 0.001 0.004 0.003 (0.01) (0.00) (0.00) (0.00) (0.00) NPL (coverage %)2 -0.000 -0.000 -0.000 -0.000 -0.000 (0.00) (0.00) (0.00) (0.00) (0.00) TIER1 gap -0.019 -0.030 -0.050 -0.029 -0.061 (0.03) (0.03) (0.05) (0.03) (0.07) Bank size -0.156∗∗ -0.188∗∗∗ -0.213∗∗∗ -0.185∗∗∗ -0.186∗∗∗ (0.07) (0.05) (0.05) (0.05) (0.05) Volatility -0.001 -0.004 -0.018 -0.003 -0.004 (0.01) (0.02) (0.02) (0.02) (0.02) Euribor-OIS spread 0.155 0.123 0.150 0.200 0.140 (0.38) (0.32) (0.31) (0.31) (0.31) Debt ratio -0.023∗ -0.027∗ -0.019∗ -0.025∗ -0.027∗ (0.01) (0.01) (0.01) (0.01) (0.01) Intercept 3.265∗∗∗ 3.658∗∗∗ 4.919∗∗∗ 3.541∗∗∗ 4.506∗∗∗ (0.99) (0.78) (0.95) (0.78) (1.09)
Table 5: Multivariate regression analysis of discount to TERP determinants The Table reports the results of an ordinary least squares regression, with cluster-robust standard errors (reported in parenthesis), for the determinants of the discount to TERP. QIF and SIF are our two alternative first-move in-dicators, obtained as the ratio of the amount of capital raised through SEOs by financial institutions respectively in the last quarter or in the last semester, divided by the total amount raised in the last twelve months. MTB is the market-to-book ratio. Statistical significance at the 1%, 5%, and 10% is indi-cated with ***, ** , *, respectively.
(1) (2) (3) (4) (5) QIF -3.500∗∗ -0.183 (1.44) (0.14) SIF -1.436∗∗ -0.190 (0.65) (0.17) MTB -10.140∗∗∗ -5.920∗∗ -3.022 -5.974∗∗ -5.825 (2.23) (2.31) (5.66) (2.38) (7.65) QIF*MTB -33.349∗∗ (15.85) SIF*MTB -26.878∗∗ (11.09) Debt ratio 1.122∗∗ 1.724∗∗∗ 1.621∗∗∗ 1.712∗∗∗ 1.711∗∗∗ (0.54) (0.43) (0.44) (0.43) (0.44) Delevering 98.956∗∗∗ 176.026∗∗∗ 186.946∗∗∗ 176.609∗∗∗ 205.692∗∗∗ (25.42) (58.91) (58.21) (57.64) (61.44) Majority 16.580∗∗∗ 18.399∗∗∗ 19.695∗∗∗ 18.314∗∗∗ 18.575∗∗∗ (5.35) (3.45) (3.94) (3.29) (3.53) Offer size -0.236∗∗∗ -0.234∗∗∗ -0.242∗∗∗ -0.235∗∗∗ -0.252∗∗∗ (0.06) (0.04) (0.04) (0.04) (0.04) TIER1 gap 1.355∗∗ 1.238∗∗ 1.121∗∗ 1.218∗∗ 1.298∗∗ (0.53) (0.54) (0.54) (0.56) (0.56) Asset turnover -3.508 -22.638∗∗ -25.741∗∗ -22.898∗∗ -23.888∗∗ (13.35) (10.93) (10.82) (11.26) (10.10) Profit margin (%) -0.024 0.071 0.075 0.067 0.055 (0.07) (0.07) (0.06) (0.06) (0.06) Government -0.081 -4.781 -4.167 -4.656 -3.573 (4.22) (3.57) (3.26) (3.62) (3.61) Bank size 1.112∗∗ 1.690∗∗∗ 1.836∗∗∗ 1.611∗∗∗ 1.771∗∗∗ (0.52) (0.54) (0.55) (0.55) (0.58) Euribor-OIS spread 0.568 3.273 4.747 3.997 2.973 (5.69) (6.56) (6.09) (6.62) (6.65) Volatility 0.092 0.388∗∗ 0.420∗∗ 0.362∗∗ 0.343∗ (0.20) (0.17) (0.18) (0.17) (0.18) Intercept 20.542∗ -0.214 -10.163 -0.232 -10.747 (12.11) (11.34) (13.39) (11.58) (13.45)
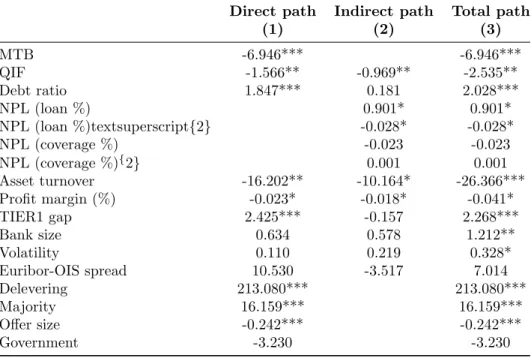
Table 6: Path analysis with structural equation modeling: direct and indirect effects on the discount to TERP
The Table reports the coefficients for direct and indirect paths, as well as the re-sulting total paths, obtained by means of a structural equation model, estimated with a maximum likelihood estimator, for the analysis of the determinants of the discount to TERP. QIF is a measure of first-move, obtained as the ratio between the amount of capital raised through SEOs by financial institutions in the last quarter divided by the total amount raised in the last twelve months. Statistical significance (based on cluster-corrected standard errors) at the 1%, 5%, and 10% is indicated with ***, ** , *, respectively.
Direct path Indirect path Total path
(1) (2) (3) MTB -6.946*** -6.946*** QIF -1.566** -0.969** -2.535** Debt ratio 1.847*** 0.181 2.028*** NPL (loan %) 0.901* 0.901* NPL (loan %)textsuperscript{2} -0.028* -0.028* NPL (coverage %) -0.023 -0.023 NPL (coverage %){2} 0.001 0.001 Asset turnover -16.202** -10.164* -26.366*** Profit margin (%) -0.023* -0.018* -0.041* TIER1 gap 2.425*** -0.157 2.268*** Bank size 0.634 0.578 1.212** Volatility 0.110 0.219 0.328* Euribor-OIS spread 10.530 -3.517 7.014 Delevering 213.080*** 213.080*** Majority 16.159*** 16.159*** Offer size -0.242*** -0.242*** Government -3.230 -3.230
Figure 1: Path analysis using Structural Equation Modeling: estimated paths -6.95 0.18 0.36 0.51 -0.03 -0.08 0.02 -0.03 1.46 0.01 0.01 -0.00 -0.13 0.01 -1.57 -16.20 -0.02 -3.23 1.85 10.53 0.63 0.11 2.43 62.31 -0.24 16.16 213.08