U
NIVERSITY
”R
OMA
T
RE
”
D
OCTORALT
HESISBrain Waves for Biometric User Recognition
Author:
Daria LA ROCCA
Supervisor:
Prof. Patrizio CAMPISI
A thesis submitted in fulfilment of the requirements for the degree of Doctor of Philosophy
in the
Biometric Systems and Multimedia Forensics Laboratory Department of Engineering, Section of Applied Electronics
“Were the ends of a person already explicit, there would be no room for development, for growth, for life; and consequently there would be no personality.”
UNIVERSITY ”ROME TRE”
Abstract
Department of Engineering, Section of Applied Electronics
Doctor of Philosophy
Brain Waves for Biometric User Recognition
by Daria LAROCCA
Brain signals are being investigated within the medical field for more than a century to study brain diseases like epilepsy, spinal cord injuries, Alzheimer, Parkinson, schizophrenia, and stroke among the others. They are also used as the basis of brain computer interface and brain machine interface with assistance, rehabilitative and entertainment applications. Despite the broad interest in clinical applications, the use of brain signals sensed by means of electroen-cephalogram has been only recently investigated by the scientific community as a biometric characteristic, and the use of brain waves for the purpose of automatic people recognition is only at an embryonic stage. However, brain signals present some peculiarities, not shared by the most commonly used biometrics, like face, iris, and fingerprints, concerning secretness, privacy compliance, robustness against spoofing attacks, possibility to perform continuous iden-tification, intrinsic liveness detection, and universality. Moreover since 70s there is evidence that EEG signals are genetically influenced and that they carry personality correlates. These peculiarities make the use of brain signals appealing. On the other hand there are many chal-lenges related to the use of brain signals which need to be properly addressed in order to deploy biometric systems based on brain activity in real life applications. Among these challenges, the definition of the brain response elicitation protocol and the convenience of the acquisition process should be addressed, to cite a few.
In this work of doctoral thesis the aforementioned issues are further developed. The first chapters provide a comprehensive and critical review of state of the art methods for electroencephalogram based automatic user recognition that have been proposed in literature so far, also pointing out neurophysiological evidences related to the performed claims. The methods implemented and the experiments carried on within the present work are reported and detailed in the next chapters, together with the results obtained from the analysis of data.
Sommario
I sistemi biometrici per il riconoscimento di utenti hanno come scopo l’autenticazione o l’identi-ficazione di un individuo sulla base di caratteristiche fisiologiche o comportamentali che risultino distintive, difficili da alterare o da simulare. Tra i parametri pi`u frequentemente presi in esame per l’analisi e la realizzazione di sistemi biometrici che permettano il riconoscimento affidabile degli individui i pi`u comuni sono: impronte digitali, geometria della mano e del volto, confor-mazione della retina o dell’iride, timbro e tonalit`a di voce, andatura. Questi tratti biometrici rappresentano tutti caratteristiche dell’individuo esposte sulla superficie del corpo, o osservabili dall’esterno, e sono descrtittivi di come egli appare o si comporta. Alternativamente le carat-teristiche indicate come cognitive biometrics, tra cui l’EEG, descrivono come l’individuo sente o pensa. Infatti, la sensibilit`a agli stimoli esterni e l’organizzazione delle funzioni cerebrali durante specifici task risultano essere propriet`a tipiche di ogni soggetto, provenienti dalla com-binazione di fattori genetici, psicofisiologici, ambientali e culturali. Questi aspetti risultano di grande interesse dal punto di vista della sicurezza dei sistemi biometrici rispetto agli attacchi di impostori, in grado di rubare o falsificare la maggiorparte dei parametri comunemente usati, osservabili dall’esterno sulla superficie del corpo.
L’attivit`a di ricerca oggetto del presente lavoro di tesi di dottorato riguarda lo studio delle parti-colari caratteristiche funzionali nel cervello del particolare individuo, con lo scopo di estrarre le invarianze nei pattern di attivit`a elettrica cerebrale tipica di ogni soggetto per il riconoscimento automatico sicuro di utenti.
Lo studio dell’attivit`a elettrica cerebrale risale all’inizio del secolo scorso, quando il fisiologo e psichiatra Hens Berger registr`o il primo elettroencefalogramma (EEG). Da allora questa tecnica di brain imaging ´e stata ampliamente sviluppata grazie al suo vasto impiego soprattutto in campo medico per la diagnosi e il supporto al trattamento delle lesioni alla spina dorsale, ictus e malattie neurologiche tra cui epilessia, malattia di Alzheimer, schizofrenia e malattia di Parkinson. Il segnale EEG rappresenta anche l’elemento di base nei sistemi di interfaccia cervello-computer e pi`u in generale cervello-macchina, che hanno come scopo permettere la comunicazione con l’ambiente esterno e il controllo di dispositivi remoti attraverso l’interpretazione dell’attivit`a elettrica cerebrale.
L’interesse mostrato negli ultimi decenni per l’utilizzo dell’EEG nel riconoscimento biomet-rico di utenti si basa sugli importanti vantaggi che esso presenta rispetto ai tratti biometrici tradizionalmente utilizzati come impronte digitali, iride e volto, in termini di sicurezza e privacy. A tale riguardo, nel corso del presente lavoro di tesi `e stato realizzato uno studio sugli aspetti di sicurezza, rispetto agli attacchi esterni, relativi all’utilizzo del segnale EEG in sistemi bio-metrici per il riconoscimento di individui. Tali propriet`a sono indispensabili per l’applicazione
di qualsiasi sistema di riconoscimento biometrico in scenari reali. Inoltre, sin dagli anni ’70 `e nota la dipendenza di alcune caratteristiche dell’EEG da fattori genetici, che contribuiscono a determinare i caratteri distintivi del segnale di un individuo. Nonostante tali evidenze solo re-centemente il segnale EEG `e stato studiato nel contesto della biometria per estrarre informazione distintiva a scopo di riconoscimento.
Sebbene si osservi un crescente interesse per lo studio delle caratteristiche distintive dell’EEG, diverse sono le difficolt`a da superare. In primo luogo `e necessario identificare lo stimolo o stato mentale che produca il tratto o la caratteristica funzionale tipica di ogni soggetto, e stabile nel tempo. In questo contesto assume importanza la scelta del numero minimo di elettrodi e la loro configurazione, la ricerca delle invarianze nel tempo per ogni soggetto, e la massimizzazione della varianza tra diversi soggetti. A tale scopo, oltre all’utilizzo delle conoscenze neurifisio-logiche sulle caratteristiche del segnale EEG, possono essere esplorati i recenti avanzamenti nel campo delle tecniche di machine learning, per ottenere un’efficiente rappresentazione (feature extraction) e classificazione dei segnali registrati.
La tecnica di brain imaging basata su EEG presenta come svantaggio una particolare sensibilit`a rispetto al rumore durante il processo di acquisizione. Questo rappresenta il principale problema da affrontare nell’elaborazione numerica, e diversi metodi sono stati proposti ed utilizzati nelle varie applicazioni. Nel caso in cui le componenti spettrali degli artefatti si sovrappongono a quelle del segnale utile `e necessario l’utilizzo di tecniche di denoising pi`u raffinate rispetto al filtraggio passa banda, basate ad esempio sulla trasformazione wavelet o sulla principal compo-nent analysis. Diverse tecniche di pre-processing finalizzate al denoising sono state utilizzate nel presente lavoro, verificandone l’efficienza relativamente al protocollo sperimentale inda-gato. Tra queste, la rimozione degli artefatti da movimento oculare e blink attraverso l’analisi delle componenti indipendenti nella condizione di rest ad occhi aperti. Per il miglioramento del rapporto segnale-rumore si `e inoltre implementato il filtraggio spaziale common average refer-ence (CAR), che consiste nel sottrarre, istante per istante, al canale di acquisizione di interesse la media spaziale dell’intero set dei canali impiegati. Tale tecnica permette di controllare gli artefatti dovuti a scelte non appropriate degli elettrodi di riferimento, o a variazioni impreviste del potenziale rilevato da questi dovute ad esempio a problemi nel contatto elettrodo-pelle. Allo scopo di eliminare artefatti di natura stocastica facendo emergere invece le componenti di natura (pseudo-)stazionaria `e stata utilizzata la tecnica della segmentazione del tracciato EEG seguita da medie d’insieme dei parametri di interesse.
Il successivo lavoro di elaborazione dei segnali EEG si `e concentrato sullo studio di particolari approcci di estrazione di feature e di classificazione, con il supporto di tecniche di modelliz-zazione complessa e analisi statistica dei dati. Lo studio delle influenze genetiche, ambientali e della personalit`a sull’EEG ha condotto all’indagine del carattere distintivo di aspetti funzionali dell’attivit`a elettrica cerebrale. Nelle analisi realizzate si sono studiati i diversi ritmi cerebrali
componenti l’EEG, che rappresentano oscillazioni con contenuto frequenziale in bande sepa-rate, individuando il peso e la distribuzione spaziale di ogni oscillazione nelle diverse regioni cerebrali in relazione al task. Risultati incoraggianti sono stati ottenuti considerando singole ses-sioni di acquisizione per ogni utente, di cui una partizione `e stata utilizzata per l’arruolamento e la rimanente per la fase di riconoscimento, evitando la sovrapposizione dei due dataset. Si `e quindi proceduto studiando le caratteristiche di stabilit`a del segnale EEG, aspetto fondamentale per il suo impiego in biometria.
A tale riguardo, oltre agli studi metodologici, nel corso del presente lavoro `e stata condotta una campagna di acquisizione del segnale EEG di soggetti volontari, finalizzata alla raccolta di un dataset da studiare, che contenesse registrazioni longitudinali (multi-sessione). Una tale struttura temporale del dataset `e necessaria per lo studio della ripetibilit`a a breve e lungo termine dei tratti biometrici estratti da EEG, propriet`a necessaria per qualsiasi implementazione in un contesto reale, in cui un soggetto arruolato precedentemente nel sistema deve essere riconosciuto in istanti diversi. Un dataset composto da circa 60 soggetti `e stato raccolto, considerando 5 registrazioni per ogni soggetto, la prima all’istante t0, la seconda all’istante t0 + 1 settimana, la terza all’istante t0 + 1 mese, la quarta all’istante t0 + 6 mesi e l’ultima all’istante t0 + 12 mesi. Durante le registrazioni `e stato richiesto ai soggetti di realizzare diversi task sperimentali. Ogni particolare task sperimentale induce specifiche risposte cerebrali ed evidenzia determinate caratteristiche dell’organizzazione e della coordinazione delle funzioni all’interno del cervello,
alcune delle quali risultano particolarmente variabili da soggetto a soggetto. `E stata quindi
considerata la dipendenza dell’EEG dallo stato mentale del soggetto durante la registrazione e dal particolare compito cognitivo da svolgere allo scopo di individuare condizioni sperimentali appropriate per il riconoscimento.
Il contributo del lavoro svolto consiste nell’aver condotto un’analisi esaustiva, assente in letter-atura, dei parametri coinvolti nella soluzione del problema di riconoscimento di utenti basato su EEG, individuando, per i particolari dataset considerati, la combinazione di ritmi cerebrali contenente maggiore informazione distintiva, la migliore configurazione spaziale di elettrodi da impiegare minimizzandone il numero, e la durata temporale dei segmenti di EEG capace di cogliere i caratteri distintivi delle feature da estrarre, compatibilmente con la grandezza dei campioni indagati. Inoltre, attraverso l’implementazione di tecniche di estrazione di feature sono state individuate rappresentazioni distintive del segnale EEG relativo a ciascun utente. Un ulteriore aspetto innovativo `e rappresentato dallo studio sistematico del carattere di stabilit`a e riproducibilit`a delle feature estratte dal segnale EEG in registrazioni longitudinali, che si sta portando avanti su dataset sempre di maggiori dimensioni, dati i promettenti risultati ottenuti. Data la scarsa disponibilit`a di materiale contenente registrazioni longitudinali di un gruppo di soggetti statisticamente significativo, si `e proceduto a realizzare una campagna di acquisizioni attraverso un dispositivo amplificatore appositamente acquistato, e a studiare adeguati protocolli
di registrazione. Il dataset acquisito `e stato oggetto di applicazione di tecniche avanzate di ma-chine learning durante un periodo di formazione e attivit`a di ricerca presso LRI (Laboratoire de Recherche en Informatique, unit´e mixte de recherche - UMR8623) dell’Universit´e Paris-Sud et du CNRS, Orsay, France. In generale tale attivit`a di ricerca riguarda lo studio statistico della struttura dei segnali EEG relativi a registrazioni longitudinali attraverso un’efficiente rappresen-tazione dei dati, finalizzato a 1) combinare tecniche di machine learning e signal processing per riconoscimento di soggetti basato su EEG; 2)comprendere la struttura della variabilit`a del segnale EEG per ogni soggetto rispetto al tempo. I metodi implementati e gli esperimenti con-dotti nel corso del predente lavoro di ricerca vengono riportati in dettaglio nei seguenti capitoli, contestualmente ai risultati ottenuti attraverso l’analisi dei dati.
Acknowledgements
I wish to thank Professor Patrizio Campisi for his supervision, his careful support, his valuable guidance and advice throughout these years.
My sincere gratitude also goes to Professor Gaetano Scarano for leading me through my educa-tion from the Biomedical Engineering course to my Master thesis, which I performed under his supervision.
I thank Fabrizio for his crucial role in my scientific research since its early beginning, and for being to me a constant source of motivation.
Contents
Abstract iii
Acknowledgements viii
Contents ix
List of Figures xiii
List of Tables xix
Abbreviations xxi
Symbols xxiii
1 EEG systems 1
1.1 Brain activity sensing: EEG brain rhythms . . . 3
1.2 Acquisition protocols . . . 6
1.2.1 Elicitation of brain responses. . . 8
1.2.2 Scalp electrodes configurations. . . 12
2 EEG biometrics 15 2.1 EEG signals as biometric identifiers . . . 15
2.1.1 Universality. . . 17 2.1.2 Permanence. . . 17 2.1.3 Performance . . . 19 2.1.4 Collectability . . . 20 2.1.5 Acceptability . . . 20 2.1.6 Circumvention . . . 20 2.1.7 Uniqueness . . . 21
2.1.7.1 Heritability of EEG variants. . . 21
2.1.7.2 EEG personality correlates . . . 24
2.2 EEG signal based recognition systems. State of the art . . . 26
2.2.1 Protocols . . . 26
2.2.2 Features . . . 31
2.2.3 Database structure . . . 33
2.2.4 Classification algorithms . . . 37 ix
Contents x
2.3 Research directions . . . 38
3 EEG Feature Engineering 41 3.1 Dataset and Preprocessing . . . 41
3.2 Parametric Features . . . 43
3.2.1 Auto Regressive Stochastic Modeling . . . 43
3.2.1.1 Results in EEG biometrics. . . 46
3.2.2 Bump Modeling . . . 51
3.2.2.1 Results in EEG biometrics. . . 54
3.3 Non-Parametric Features . . . 56
3.3.1 Power Spectral Density. . . 56
3.3.2 Pairwise Spectral Coherence . . . 58
3.3.3 Results in EEG biometrics . . . 58
3.3.3.1 Single-element classification . . . 60
3.3.3.2 Match-score fusion . . . 60
3.3.4 Results in Language Processing . . . 62
3.3.4.1 Power Spectrum Analysis . . . 65
3.3.4.2 Cross-Spectrum Analysis . . . 68
4 Longitudinal Dataset 81 4.1 Main issue in EEG biometric context . . . 81
4.1.1 The EEG longitudinal database . . . 83
4.1.2 tasks . . . 84
5 Pattern Recognition/Classification 91 5.1 Metric-based Approach . . . 91
5.2 Machine Learning Approach . . . 93
5.3 Experiments . . . 93
5.3.1 Results . . . 95
5.3.1.1 Identity Verification . . . 95
5.3.1.1.1 Genuine Acceptance Rate . . . 95
5.3.1.1.2 False Acceptance Rate . . . 96
5.3.1.1.3 Ensemble Testing and channel selection . . . 97
5.3.2 Discussion . . . 98
Conclusion and Future Work 113
A SINGLE ELEMENT RANKING AND FUSION ALGORITHM 115
B CONNECTIVITY PATTERN FOR THE WHOLE HEAD 119
C REAL AND IMAGINARY COHERENCE 121
Contents xi
List of Figures
1.1 The 10-20 international standard seen from left (A) and above the head (B). A montage according to an extended 10-20 standard is shown in (C). The let-ters F, T, C, P and O stand for frontal, temporal, central, parietal, and occipital lobes. Even numbers identify electrodes on the right hemisphere, odd numbers those on the left hemisphere, and ”z” (zero) refers to electrodes placed on the midline. (Jaakko Malmivuo and Robert Plonsey, Bioelectromagnetism, Oxford University Press, 1995, WEB version). . . 3
1.2 Example of an electroencephalogram acquired using a 19 channel system using a ”rest state with closed eyes” protocol. . . 4
1.3 Examples of Delta, Theta, Alpha, Beta, and Gamma waves acquired through the channel O2 using a ”rest state with closed eyes” protocol. . . 5
1.4 Topographic maps of rhythms. Each map shows in false colors the spatial dis-tribution on the scalp surface of the related EEG rhythm, for a test subject. The mean value of the power spectral density for each frequency band is reported. Maps for rhythms Delta, Theta, Alpha, and Beta are shown. Each circle rep-resents the top view of a head, where the highest point is the nasion while the lowest is the inion. . . 7
1.5 Topographic distribution of P300 brain potential as elicited through an oddball paradigm, employing a 19 electrodes configuration based on the 10-20 standard. Labels which indicate the related channel are reported on each P300 waveform, obtained averaging the EEG segments time-locked to target stimuli (red lines). Similarly, brain responses related to non-target stimuli are also reported in each subplot (blue lines) as a reference to evaluate the P300 responde. . . 9
1.6 EEG signals elicitation approaches. . . 11
1.7 Electrodes placement for a P300 based system: an example (a). Electrodes placement for a motor imagery based system: an example (b). . . 14
3.1 AR filter. . . 45
3.2 Akaike Information Criterion for the estimation of the AR model order Q. . . . 46
3.3 Pole-zero map (a) and Nyquist diagram (b) of the transfer functions of the mod-els represented by the feature vectors χ(I)i,τ ∈ IR12for 10 sample subjects. The feature vectors reported are extracted from EEG frames τ . The colormap codes the subjects i = 1, . . . , 10. . . 46
3.4 Scalp electrodes positioning according to an extension of the standard 10-20 montage. Electrodes positioning in the employed protocol is shown by the un-crossed circles. . . 47
3.5 Recognition performance vs AR model order, with overlap factor of 75% for: a) best couple; b) best triplet; c) best set of five 5 electrodes. . . 49
List of Figures xiv
3.6 Spectral maps for the EC resting state protocol. The spatial distribution on the scalp of spectral EEG amplitudes at given frequencies, specified above each map, is shown. Each circle represents the top view of a head, where the highest point is the nasion while the lowest is the inion. . . 50
3.7 Half ellipsoid bump function. . . 52
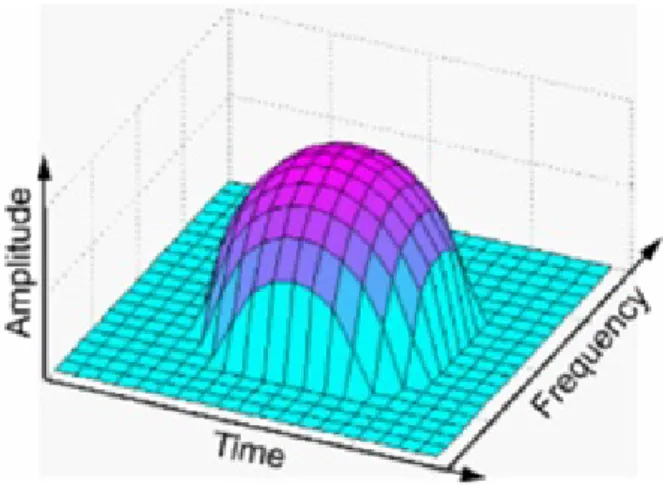
3.8 Left: normalized time-frequency map of an EEG recording; middle and right: 2D and 3D bump modeling of the map. . . 53
3.9 Parametric time-frequency map of an EEG epoch for a sample subject (left) and the result of its amplitude filtering (right). . . 53
3.10 Improvement of the correct recognition rate obtained performing subsequent score fusions. Curves refer to the combination of different brain rhythms (top x-axis) and different electrodes sets (bottom x-axis). Labels in the x-axes refers to the score added at the related step. . . 56
3.11 Spatial distribution of CRR values obtained considering a) PSD features χ(III) from single EEG channel and b) COH features χ(IV )from single channel pairs. In b) the elements of the adjacency matrices code all the possible EEG chan-nel pairs. They are organized in order to highlight the connectivity within and between three zones: frontal (F), central (C), and parieto-occipital (P). The two analyzed conditions EO (on the left) and EC (on the right) are reported for each of the two investigated spectral features. . . 59
3.12 Performances in terms of CRR (y-axis) obtained considering single-element classification versus match-score fusion in each cerebral zone (x-axis). The color of the bars codes the spectral feature and the condition according to the legend. . . 63
3.13 Distinctive functional connectivity patterns in each cerebral zone (on the top) and related steps for the match score fusion selection (on the bottom). Results for the EO and EC to conditions are reported in a) and b) respectively. The color of each line in the bottom panels codes the CRR values obtained for different cerebral zones, according to the top panels. Symbol markers highlight the fusion steps that increased the overall CRR accuracy. Different symbols are used for different cerebral zones (F-triangles, C-circles, P-squares). X-axes are put into logarithmic scales for the sake of representation. . . 63
3.14 FNvsTN PSD. The different rhythms δ, θ, α, β and γ in the subsequent rows. Lower and upper limits of the confidence interval (a) and b)) and map of the significant differences (c) in the subsequent columns. . . 68
3.15 FGvsTG PSD. The different rhythms δ, θ, α, β and γ in the subsequent rows. Lower and upper limits of the confidence interval (a) and b)) and map of the significant differences (c) in the subsequent columns. . . 70
3.16 Misalignment vs Alignment PSD. The different rhythms δ, θ, α, β and γ in the subsequent rows. Lower and upper limits of the confidence interval (a) and b)) and map of the significant differences (c) in the subsequent columns. . . 71
3.17 FNvsTN PSD ROI. The different rhythms δ, θ, α, β and γ in the subsequent rows. Lower and upper limits of the confidence interval in the vertical bars. Different tested features (PSD values within and between ROIs) on the x-axis. Red spots highlighting significant differences. . . 72
3.18 FGvsTG PSD ROI. The different rhythms δ, θ, α, β and γ in the subsequent rows. Lower and upper limits of the confidence interval in the vertical bars. Different tested features (PSD values within and between ROIs) on the x-axis. Red spots highlighting significant differences. . . 72
List of Figures xv
3.19 Misalignment vs Alignment PSD ROI. The different rhythms δ, θ, α, β and γ in the subsequent rows. Lower and upper limits of the confidence interval in the vertical bars. Different tested features (PSD values within and between ROIs) on the x-axis. Red spots highlighting significant differences. . . 73
3.20 FNvsTN COH. The different rhythms δ, θ, α, β and γ in the subsequent rows. Lower and upper limits of the confidence interval (a) and b)) and map of the significant differences (c) in the subsequent columns. . . 76
3.21 FGvsTG COH. The different rhythms δ, θ, α, β and γ in the subsequent rows. Lower and upper limits of the confidence interval (a) and b)) and map of the significant differences (c) in the subsequent columns. . . 77
3.22 Misalignment vs Alignment COH. The different rhythms δ, θ, α, β and γ in the subsequent rows. Lower and upper limits of the confidence interval (a) and b)) and map of the significant differences (c) in the subsequent columns. . . 78
3.23 FNvsTN COH ROI. The different rhythms δ, θ, α, β and γ in the subsequent rows. Lower and upper limits of the confidence interval in the vertical bars. Different tested features (COH values within and between ROIs) on the x-axis. Red spots highlighting significant differences. . . 78
3.24 FGvsTG COH ROI. The different rhythms δ, θ, α, β and γ in the subsequent rows. Lower and upper limits of the confidence interval in the vertical bars. Different tested features (COH values within and between ROIs) on the x-axis. Red spots highlighting significant differences. . . 79
3.25 Misalignment vs Alignment COH ROI. The different rhythms δ, θ, α, β and γ in the subsequent rows. Lower and upper limits of the confidence interval in the vertical bars. Different tested features (COH values within and between ROIs) on the x-axis. Red spots highlighting significant differences. . . 79
4.1 EB Neuro Galileo BE Light acquisition system. . . 83
4.2 Headset composed of 19 electrodes used for acquisitions. . . 85
4.3 Green cross to be fixed during rest with eyes open, to avoid eyes’ movement. . 86
4.4 Frame of the MI task. . . 86
4.5 Frame of the SI task. . . 87
4.6 Frame of the oddball (P300) task.. . . 87
4.7 Frame of the mental calculation task for algebraic sum of integer numbers.. . . 88
4.8 Frame of the mental calculation task for algebraic sum of decimal numbers. . . 88
4.9 Photodiode used to implement the trigger system. . . 89
5.1 Cumulative distibutions of Fi(x) = hw, xi. The curves refer to the training raw data from sessions S1 and S2. The red curve represents the scores of the gen-uine vector xi, while the blue one represents the impostor xj. The cumulative distributions of 9 sample subjects are shown in different subplots, for channel Czand for a single run of the employed algorithm. . . 94 5.2 Cumulative distibutions of Fi(χ) = hw, χi. The curves refer to the training AR
data from sessions S1 and S2. The red curve represents the scores of the gen-uine vector χi, while the blue one represents the impostor χj. The cumulative distributions of 9 sample subjects are shown in different subplots, for channel Czand for a single run of the employed algorithm. . . 95
List of Figures xvi
5.3 Cumulative distibutions of Fi(χ) = P`w`|χ`− c`|. The curves refer to the training AR data from sessions S1and S2. The red curve represents the scores of the genuine vector χi, while the blue one represents the impostor χj. The cumulative distributions of 9 sample subjects are shown in different subplots, for channel Czand for a single run of the employed algorithm. . . 96 5.4 Cumulative distibutions of Fi(χ) = hw, χi. The curves refer to the training
spectral coherence data from sessions S1 and S2. The red curve represents the scores of the genuine vector χi, while the blue one represents the impostor χj. The cumulative distributions of 9 sample subjects are shown in different sub-plots, for channel Czand for a single run of the employed algorithm. . . 97 5.5 Cumulative distibutions of Fi(χ) =
P
`w`|χ`− c`|. The curves refer to the training spectral coherence data from sessions S1 and S2. The red curve rep-resents the scores of the genuine vector χi, while the blue one represents the impostor χj. The cumulative distributions of 9 sample subjects are shown in different subplots, for channel Czand for a single run of the employed algorithm. 98 5.6 Vectors wi ∈ IR12 for 10 sample subjects, obtained from 20 executions of the
stochastic optimization algorithm (CMA-ES) on the sessions S1 and S2. The colormap codes the subjects i = 1, . . . , 10.. . . 99
5.7 Channel selection based on the minimum value of the objective function achieved in the training. . . 100
5.8 EER versus time obtained for a single representation of the data through the AR coefficients. The shown result refers to channel Cz and Q = 12, that are the channel and the AR model order which give better accuracy. Green mark-ers refer to the CMA-ES optimization algorithm, while black markmark-ers refer to Mahalanobis-based classifier. . . 101
5.9 EER versus time obtained for a single representation of the data through the spectral coherence values. The shown result refers to channel pair C3 − Cz which gives better accuracy. Green markers refer to the CMA-ES optimization algorithm, while black markers refer to Mahalanobis-based classifier.. . . 102
5.10 EER versus averaging steps obtained using AR features χ(I)i,τ. The shown accu-racy refers to the averaging of the scores obtained considering different channels to represent the data, for Q = 12. Green markers refer to the CMA-ES optimiza-tion algorithm, while black markers refer to Mahalanobis-based classifier. . . . 103
5.11 EER versus averaging steps using AR features χ(I)i,τ. The shown accuracy refers to the averaging of the scores obtained considering different channels and dif-ferent Q values to represent the data. Green markers refer to the CMA-ES opti-mization algorithm, while black markers refer to Mahalanobis-based classifier.. 104
5.12 EER versus averaging steps using spectral coherence features χ(IV )i,τ . The shown accuracy refers to the averaging of the scores obtained considering different channel pairs to represent the data. Green markers refer to the CMA-ES opti-mization algorithm, while black markers refer to Mahalanobis-based classifier.. 105
5.13 Solid lines: EER versus time using AR features χ(I)i,τ, for the averaging of the scores obtained considering different channels and different Q values to repre-sent the data. Dashed lines: EER versus time, for a single reprerepre-sentation of the data. The shown result refers to channel Cz and Q = 12. Green mark-ers refer to the CMA-ES optimization algorithm, while black markmark-ers refer to Mahalanobis-based classifier. . . 106
List of Figures xvii
5.14 EER versus subjects using AR features χ(I)i,τ, for the averaging of the scores obtained considering different channels and different Q values to represent the data. The plots shown on the left hand side refer to training data from sessions S1 and S2, while the ones on the right refer to test data from session S3. The plots on the top are obtained using all channels, while the results related to the channel selection are shown on the bottom. Green markers refer to the CMA-ES optimization algorithm, while black markers refer to Mahalanobis-based classifier.107
5.15 EER versus time using AR features χ(I)i,τ, for the averaging of the scores obtained considering different channels and different Q values to represent the data. The plots shown on the left hand side refer to training data from sessions S1and S2, while the ones on the right refer to test data from session S3. The plots on the top are obtained using all channels, while the results related to the channel selection are shown on the bottom. Green markers refer to the CMA-ES optimization algorithm, while black markers refer to Mahalanobis-based classifier.. . . 108
5.16 EER versus subjects using spectral coherence features χ(V I)i,τ , for the averaging of the scores obtained considering different channels and different Q values to represent the data. The plots shown on the left hand side refer to training data from sessions S1 and S2, while the ones on the right refer to test data from session S3. The plots on the top are obtained using all channels, while the results related to the channel selection are shown on the bottom. Green markers refer to the CMA-ES optimization algorithm, while black markers refer to Mahalanobis-based classifier. . . 109
5.17 EER versus time using spectral coherence features χ(IV )i,τ , for the averaging of the scores obtained considering different channels and different Q values to rep-resent the data. The plots shown on the left hand side refer to training data from sessions S1 and S2, while the ones on the right refer to test data from session S3. The plots on the top are obtained using all channels, while the results re-lated to the channel selection are shown on the bottom. Green markers refer to the CMA-ES optimization algorithm, while black markers refer to Mahalanobis-based classifier. . . 110
5.18 ROC curve for different averaging steps. The shown results refer to AR features
χ(I)i,τ . . . 111
5.19 ROC curve for different lengths of tested EEG segments. The shown results refer to AR features χ(I)i,τ . . . 112
B.1 Distinctive functional connectivity patterns for the whole head (on the top) and related steps for the match score fusion selection (on the bottom). Results for the EO and EC two conditions are reported in a) and b) respectively. On the top: black links indicate the channel pair selected by the fusion algorithm when considering the connectivity within and between all the cerebral zones. On the bottom: Symbol markers highlight the fusion steps that increased the overall CRR accuracy. X-axes are put into logarithmic scales for the sake of represen-tation. It should be noticed that the best distinctive connectivity patterns are a subset of the results obtained when restricting the fusion within single cerebral zones, i.e. gray, blue and green are the colors used for specific zones (F, C and P respectively) tested separately. . . 119
List of Figures xviii
C.1 CRR results obtained with single-element classification of spectral coherence (a) and imaginary coherence (b) in a group of N=20 subjects during the eyes-open EO resting state condition. Results are reported for different configurations of Hanning window lengths (rows in each panel) and overlapping data points (columns in each panel). . . 121
D.1 Variability of power spectrum PSD (a) and spectral coherence COH (b) features across EEG sensors. In the upper panels solid lines represent the grand average (across all the subjects N = 108) of the mean profile of the feature vector across all the considered EEG sensors (Nch = 56). Vertical bars indicate the grand average of the standard deviation of the feature vector across sensors. In the lower panels solid lines represent the mean profile of the feature vector across all the considered EEG sensors for a representative subject. Vertical bars indicate the standard deviation of the feature vector across sensors. . . 123
List of Tables
2.1 Overview of state of the art contributions using EEG signals as a biometrics. . . 26
2.2 Dataset characteristics . . . 34
3.1 Classification results in % obtained for the subbands δ, θ, α, β, and the fusions δ ∪ θ ∪ α ∪ β and δ ∪ θ ∪ α for sets of two electrodes. Values for overlap and AR model order are OL= 75%, Q = 12, respectively. . . 48 3.2 Classification results in % obtained for the subbands δ, θ, α, β, and the fusions
δ ∪ θ ∪ α ∪ β and δ ∪ θ ∪ α for sets of three electrodes. Values for overlap and AR model order are OL= 75%, Q = 12, respectively. . . 49 3.3 Classification performance in terms of correct recognition rate. Results refer
to overlapped training and test datasets. The analysis of individual subbands is reposted in subsequent columns, and the set of 3 channels considered is listed in the first column. . . 56
3.4 Classification performance in terms of correct recognition rate. Results refer to disjoint training and test datasets. The analysis of individual subbands is reposted in subsequent columns, and the set of 3 channels considered is listed in the first column. . . 57
3.5 CRRs for COH features χ(IV ), obtained through the fusion of the channel pairs reported in each row. Each column represents a step of the fusion, and the related accuracy achieved is reported together with the channel pair considered in that step (see Appendix A). Results for EO, EC, and the three investigated brain zones are shown. . . 64
3.6 Regions Of Interest (ROI) PSD. . . 69
3.7 Regions Of Interest (ROI) COH . . . 75
4.1 State-of-the-art contributions using EEG signals as a biometrics, and investigat-ing multi-session datasets. . . 83
Abbreviations
AF Anterior-Frontal
APSG Antero-Posterior Spectral Gradient
AR Auto-Regressive
BCI Brain Computer Interface
C Central
CAR Common Average Reference
CC Cross-Correlation
CMA-ES Covariance Matrix Adaptation-Evolution Strategy
CP Centro-Parietal
CRR Correct Recognition Rate
CV Cross Validation
DA Discriminant Analysis
EC Eyes Closed
EEG ElectroEncephalo Graphy
EER Equal Error Rate
EO Eyes Open
ERD Event Related De-synchronization
ERP Event Related Potential
ERS Event Related Synchronization
F Frontal
FAR False Acceptance Rate
FC Fronto-Central
F/G Focus/Given
F/N Focus/New
Fp Fronto-polar
Abbreviations xxii
FRR False Rejection Rate
FT Fronto-Temporal
FW Fast Wave
GAR Genuine Acceptance Rate
LDA Linear Discriminant Analysis
MI Motor Imagery
MuIn Mutual Information
O Occipital
P Parietal
PO Parieto-Occipital
PS Power Spectrum
PSD Power Spectral Density
ROI Region Of Interest
SCP Slow Cortical Potential
RS Resting State
SI Speech Imagery
SPR Spectral Power Ratio
SW Slow Wave
T Temporal
T/G Topic/Given
T/N Topic/New
Symbols
d Mahalanobis distance between feature values
i Generic identity (subject)
I Length (number of time samples) of EEG epochs (segments)
J Objective function
M Miss-classification matrix
N Number of identities
Nch Number of channels
NF T Number of frequency points (samples)
OL overlapping factor between consecutive epochs
S(·) Acquisition session
Sr Sampling frequency Hz
Sx,y(f ) Cross-spectrum V2Hz−1
Sx,x(f ) Auto-spectrum V2Hz−1
T Number of EEG epochs
xi,t EEG waveform after pre-processing
α Alpha rhythm β Beta rhythm γ Gamma rhythm δ Delta rhythm θ Theta rhythm µ Mean value σ Standard deviation
τ Generic EEG epoch
χ(·) Feature vector
To Emma, Raffaele
and Martina
Chapter 1
EEG systems
In the last decade, an always growing interest towards the use of biological signals, like elec-troencephalogram (EEG), electrodermal response (EDR), electrocardiogram (ECG), blood pulse volume (BPV), electromyogram (EMG), to cite a few, for the purpose of automatic user recog-nition is being witnessed. Within this framework the so-called “cognitive biometric” refers to biometric traits which are detected during cognitive and/or emotional brain states. Therefore, while conventional biometric rely on the use of either physiological or behavioral character-istics, that is on some biological characteristics the individual “possesses’ or on the “way the individual behaves” respectively, cognitive biometrics are based on the measurement of signals directly or indirectly generated by the “way the individual thinks” as a distinctive characteristic for automatic user recognition. In particular, the evidence that the brain activity carries distinc-tive information about the individual identity has led to the development of research on cognidistinc-tive biometrics in last decade.
The study of brain activity during specific mental states is being explored by means of different methodologies in order to extract discriminating features for the purpose of user recognition. Specifically, brain activity can be recorded either by measuring the blood flow in the brain or by measuring the neuron electrical activity. To the first category belong approaches like functional magnetic resonance imaging (fMRI), which measures the concentration of oxygenated and de-oxygenated haemoglobin in response to magnetic fields; the near-infrared spectroscopy (NIRS), which measures the concentration of oxygenated and deoxygenated haemoglobin by means of the reflection of infrared light by the brain cortex through the skull; the positron emission to-mography (PET), which measures neuron metabolism through the injection of a radioactive sub-stance in the subject. To the second category belong approaches like magneto-encephalography (MEG), which is sensitive to the small magnetic fields induced by the electric currents in the brain, and electroencephalography, which is sensitive to the electrical field generated by the electric currents in the brain.
Chapter 1. EEG systems 2
EEG recordings are acquired with portable and relatively inexpensive devices when compared to the other brain imaging techniques. Specifically, signal amplifiers with high sensitivity and high noise rejection are used to measure the voltage fluctuation on the scalp surface resulting from the electric field generated by the firing of collections of pyramidal neurons of the cortex. For the sake of completeness it is worth mentioning that, in principle, also EEG subdermal nee-dle electrodes can be employed although they are used only in medical applications due to their high invasiveness. The EEG amplitude of a normal subject in the awake state, recorded with scalp electrodes, is in the range [10, 200]µV and the most relevant cerebral activity falls in the range of [0.5, 40]Hz. The EEG based brain imaging technique presents a limited spatial resolu-tion due to the physical dimension, in the range of several millimeters, of the surface electrodes, usually employed in the acquisition setup, which limits the possible number of the electrodes covering the whole scalp. A limited spatial resolution is also due to the dispersion of the signals, generated by the sources on the cortex, within the head structures before they reach the scalp. On the contrary, EEG techniques have a high temporal resolution, in the range of milliseconds, which allows dynamic studies to understand the underlying mechanisms by means of complex computational methods. In fact, information concerning for instance psycho-physiological state, neurological and neuromuscular health, emotions, memory, the course of concentration, atten-tion, levels of arousal, mental fatigue or workload during special tasks, sensitiveness to external
stimulation can be extracted from EEG inspection and manipulation [1]. Such a kind of evidence
has led in last decades to use brain signals to convey conscious volition in EEG-based systems,
like brain computer interface (BCI) [2], [3], and brain machine interface (BMI) [4], aiming at
controlling remote devices by means of the interpretation of the brain electrical activity. Although some isolated attempts to use EEG to discriminate people have been performed in the
past [5], only recently [6], [7] the scientific community has started a more systematic
investi-gation on the use of EEG signals as human distinctive traits which can be potentially used in a biometric system. In fact, the way the brain regions are organized and coordinated during specific cognitive functions or mental states, such as the response to audio or visual stimuli, during real or imagined body movements, imagined speech, resting states, etc., or during emo-tional states, can provide relevant information about the brain conditions which, in the studies
conducted so far, have shown to have some discriminant capabilities among subjects [8], [9],
due to both morphological and anatomical traits, and functional plasticity traits.
In this first chapter a characterization of a generic EEG signal acquisition system is given along
with a characterization of the brain rhythms. Also, in Section1.2 the EEG signal acquisition
Chapter 1. EEG systems 3
FIGURE 1.1: The 10-20 international standard seen from left (A) and above the head (B). A
montage according to an extended 10-20 standard is shown in (C). The letters F, T, C, P and O stand for frontal, temporal, central, parietal, and occipital lobes. Even numbers identify elec-trodes on the right hemisphere, odd numbers those on the left hemisphere, and ”z” (zero) refers to electrodes placed on the midline. (Jaakko Malmivuo and Robert Plonsey,
Bioelectromag-netism, Oxford University Press, 1995, WEB version).
1.1
Brain activity sensing: EEG brain rhythms
EEG signals are usually acquired using superficial scalp electrodes, placed according to the
10-20 international standard depicted in Figure1.1and recommended by the International
Fed-eration of Societies for Electroencephalography and Clinical Neurophysiology. The “10” and “20” refer to the percentage of the distances between the landmark points, namely the inion, the
nasion, as shown in Figure1.1(a) and (b), used to draw the lines at which intersections the
elec-trodes are positioned. In other words, given the landmark points, the elecelec-trodes positioning is made by considering the intersections between lines which are sagittally and coronally drawn at 10 or 20 % of the distances between the inion and nasion. An example of brain waves acquired during a resting state with closed eyes using a 19 channel device with electrodes positioned
using the 10-20 international system is shown in Figure1.2.
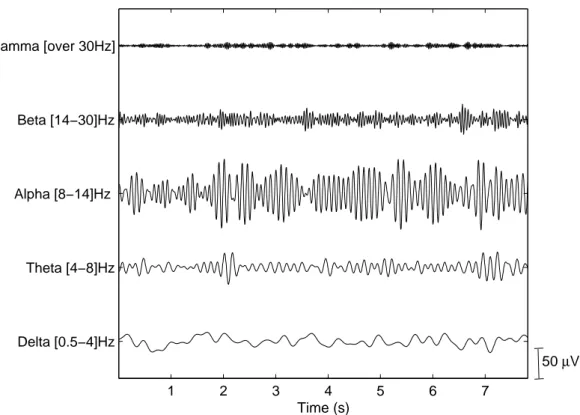
Since the early research on EEG analysis, it has been observed that the most relevant cere-bral activity, consisting of superimposed oscillations at different frequencies, falls in the range of [1, 40]Hz. In general, five main rhythms can be detected from an EEG recording: Delta (δ [0.5, 4]Hz), Theta (θ [4, 8]Hz), Alpha (α [8, 14]Hz), Beta (β [14, 30]Hz) and Gamma (γ over 30Hz).
In Figure1.3examples of δ, θ, α, β, and γ rhythms acquired through the O2 channel using a
rest-ing state with closed eyes protocol are depicted.
The amount of activity in different EEG frequency bands can be quantified employing spectral analysis techniques. The contribution of the different rhythms to the EEG depends mainly on
Chapter 1. EEG systems 4 1 2 3 4 5 6 7 Fp1 Fp2 F7 F3 Fz F4 F8 T3 C3 Cz C4 T4 T5 P3 Pz P4 T6 O1 O2 Time (s)
FIGURE 1.2: Example of an electroencephalogram acquired using a 19 channel system using
a ”rest state with closed eyes” protocol.
the level of alertness, on the age and behavioral state of the subject. Moreover an EEG pat-tern is influenced by neuro-pathological conditions, metabolic disorders, and drug action. The different brain rhythms or some combination of them become dominant oscillations during spe-cific mental states, which can be induced by the performance of a proper acquisition protocol. Specifically, Delta and Theta frequency bands are considered to represent slow oscillating neural synchronization, or slow wave (SW) activity, while Beta and Gamma bands represent fast wave (FW) activity. Brain oscillations in these frequency bands has been linked to various
physiopsy-chological states and cognitive functions, as reported for instance in [10], [11]and [12]. A more
detailed characterization of the subbands is given in the following.
• Delta [0.5, 4]Hz: Delta rhythm is a predominant oscillatory activity in EEGs recorded during the so called deep or slow wave sleep (SWS). In this stage, Delta waves usually have large amplitudes (75 − 200µV ) and show strong coherence all over the scalp. In newborns, slow Delta rhythms predominate. An increase in Delta EEG activity during the performance of a mental tasks has shown to be related to an increase in subjects’ attention
to internal processing [13].
• Theta [4, 8]Hz: In human scalp EEG, changes in Theta rhythms are very difficult or almost impossible to detect without the help of computational methods. If EEG power in
Chapter 1. EEG systems 5 1 2 3 4 5 6 7 Delta [0.5−4]Hz Theta [4−8]Hz Alpha [8−14]Hz Beta [14−30]Hz Gamma [over 30Hz] Time (s) 50 µV
FIGURE1.3: Examples of Delta, Theta, Alpha, Beta, and Gamma waves acquired through the
channel O2 using a ”rest state with closed eyes” protocol.
a resting condition is compared with a test condition, Theta power synchronizes, that is an increased Theta activity is observed. In particular Theta band power increases in response to memory demands, selectively reflecting the successful encoding of new information
[14].
• Alpha [8, 14]Hz: The oscillatory Alpha band activity is the most dominant rhythm which emerges in normal subjects, most pronounced in the parieto-occipital region. It is mani-fested by a peak in spectral analysis. The Alpha brain oscillations may present amplitudes large enough to be clearly seen in raw EEG traces acquired in specific mental states (see
Figure1.3). It is characteristic of a relaxed but wakeful state primarily with closed eyes,
and attenuates with eyes opening or mental exertion due to event-related Alpha power desynchronization. These changes in the Alpha band reflect an increase in tonic ener-getic levels related to increased arousal caused by basic processing of visual information
[15]. Moreover there is evidence that attentional and semantic memory demands lead to
a selective suppression of Alpha in different subbands and that the well described effects
of visual stimulation represent just a special class of sensory-semantic task demand [16].
According to these evidences, the Alpha oscillations play an important role in suppres-sion of processing for inputs in the brain. This confirms the evidence that Theta and Alpha band power are related to each other, although in an opposite way.
Chapter 1. EEG systems 6
• Beta [14, 30]Hz: Phase synchrony in Beta frequency band is enhanced for consciously
perceived stimuli [17], and detectable mainly from the involved cortical areas,
includ-ing somatosensory, frontal, parietal and motor regions, dependinclud-ing on the performed task. Specifically, Beta activity is characteristic for the states of increased alertness and focused attention.
• Gamma (over 30Hz): Neuronal synchronization in the Gamma band is considered im-portant for the transient functional integration of neural activity across brain areas, in order to achieve various functions involving active information processing, e.g.,
recogni-tion of sensory stimuli, and the onset of voluntary movements [18]. Gamma components
are difficult to record by scalp electrodes and their frequency usually does not exceed 45Hz. Components up to 100Hz, or even higher, may be registered in electrocorticogram (ECoG).
In general, it can be assumed that the slowest brain rhythms are dominant during an inactive state and the fastest are typical of information processing performance.
In Figure1.4the topographic maps related to the main brain rhythms during resting with closed
eyes are displayed in false colors. Specifically, the mean value of the power spectral density for each frequency band is reported.
1.2
Acquisition protocols
EEG signals can be acquired through portable devices that sense the electric field generated by the brain while resting or during a variety of cognitive tasks, such as response to audio or visual stimuli, real or imagined body movements, imagined speech, etc. More specifically we refer to “event related potentials” (ERP) as to a small change in the electrical activity of the brain, time-locked to a meaningful externally (exogenous) or internally (endogenous) generated event
[19]. ERP signals convey information on changes which occur when similarly oriented
pyrami-dal neurons of both individual and different local networks fire in synchrony. For endogenous ERPs, time-locked to a mental event such as the recognition of a target stimulus, the activity of
the cortex reflects functional coordination during neurocognitive information processing [20].
ERPs components can be described in terms of latency time, polarity, and topography. Large in-dividual differences exist for the ERP components, while a certain stability is observed within a
subject [21]. Other largely studied brain signals are “slow cortical potentials” (SCPs), also used
as control signals in BCI context. They represent slow voltage shifts in EEG, which are involved in the modulation of the excitability level of underlying cortical regions, and in the preparatory
allocation of resources for cortical processing [22]. SCPs last from 300 ms to several seconds
Chapter 1. EEG systems 7
FIGURE1.4: Topographic maps of rhythms. Each map shows in false colors the spatial
distri-bution on the scalp surface of the related EEG rhythm, for a test subject. The mean value of the power spectral density for each frequency band is reported. Maps for rhythms Delta, Theta, Alpha, and Beta are shown. Each circle represents the top view of a head, where the highest
point is the nasion while the lowest is the inion.
EEG signal analysis allows catching the relative timing of neural events during a specific task performance. The physiological phenomena underlying some brain signals have been decoded studying EEG recorded within dedicated acquisition protocols. These protocols are specially designed in order to elicit specific brain responses of interest, with the aim of studying the neural mechanisms of information processing in environmental perception as well as during complex cognitive operations. In this regard several data acquisition protocols have been proposed in the literature specifying the data acquisition conditions, the task definition, and the sensing electrodes configuration related to the neurophysiological function under analysis.
In this Section we describe some acquisition protocols employed in EEG studies. Topographic information on source activation are reported depending on the performed task, and guidelines for efficient scalp electrodes configurations are provided.
Chapter 1. EEG systems 8
1.2.1 Elicitation of brain responses
Since the earliest applications of EEG signals, particular interest has been shown in the study of cerebral activity during a state of rest, due mainly to the simplicity of the acquisition process. Therefore, the resting state (RS) protocol, with eyes closed or open, has been widely studied for different purposes. Within this paradigm, typically, the enrolled subjects are comfortably seated in a chair with both arms resting, in a dimly lit or completely dark room. Generally, external sounds and noise are minimized to favor the relaxed state of the subjects. Participants are asked to perform few minute of resting state with closed eyes (EC) or open eyes (EO), avoiding any focusing or concentration, but keeping awake and alert. Brain activity during resting state without performing any task carries interesting information as contained in EEG
specific patterns [23]. Eyes-closed and eyes-open resting conditions are usually employed in
EEG research studies for baseline estimates, although they represent different processes related
to global arousal and focal activation [24].
Moreover, EEG patterns have shown significant differences, specially related to the spectral analysis, between rest and several cognitive tasks, and even between different cognitive tasks themselves, involving distinct neural systems. In order to infer about the properties of neural activation in the involved brain regions, math, logical and spatial cognitive operations have been considered in the development of suitable acquisition protocols. Changes in activation patterns due to specific components of mental calculation can be observed from the analysis of each frequency band, as they seem to be related to oscillatory activity of different neural networks. In this regard different EEG patterns have been examined by testing healthy subjects in different conditions of mental calculation through properly designed protocols. In these protocols the mental task period is usually preceded by a rest period in order to provide a baseline. During
the mental task interval, the subject is asked to solve a problem providing an answer [25]. The
features of such kind of brain patterns reflect inter-individual variability due to different abilities, aptitudes, innate mechanisms of habit, brain plasticity, etc.
The most explored protocols involve the elicitation of the above mentioned ERPs. Task-related ERPs, as well as background EEG, are associated to different behavioral and cognitive traits. ERP signals can be elicited within different stimulation/acquisition paradigms involving for in-stance sensory, cognitive or motor events. Usually, the exogenous eliciting events are repetitively modulated sensory stimuli such as a visual flicker. The so elicited evoked potentials strongly de-pend on the physical parameters of the stimuli. On the other hand endogenous ERPs dede-pend on internal cognitive events reflecting the way the subject evaluate a stimulus.
A largely studied and employed brain potential is the P300 ERP, especially used in BCI context. The P300 ERP is a positive deflection of the scalp potential which typically occurs around 300
Chapter 1. EEG systems 9
FIGURE 1.5: Topographic distribution of P300 brain potential as elicited through an oddball
paradigm, employing a 19 electrodes configuration based on the 10-20 standard. Labels which indicate the related channel are reported on each P300 waveform, obtained averaging the EEG segments time-locked to target stimuli (red lines). Similarly, brain responses related to non-target stimuli are also reported in each subplot (blue lines) as a reference to evaluate the P300
responde.
ms after the onset of a task-relevant stimulus, with a centro-parietal focus [26]. The most
effec-tive paradigm for inducing a P300 response is the ‘oddball’ task. In this paradigm an infrequent
but task-relevant stimulus is presented among frequent irrelevant stimuli [27]. Different kind of
stimuli can be employed to carry out such paradigm. One example is the well-known P3Speller
first designed by Farwell and Donchin for a BCI application[28]. It provides a matrix speller,
that is a matrix of characters where rows and columns are randomly flashed while EEG is ac-quired. The user is asked to focus on the desired symbol detecting every time the corresponding row and column flash. Subsequently the BCI uses the P300 responses to identify the target symbol. The characteristics of the P300 response will change with the type of stimulation, its timing, and with the task difficulty. The P300 individual differences relate to amplitude, latency,
waveform and scalp potential distribution [26], and also reflect psychophysiological aspects of
individual central nervous system reactivity. Figure1.5reports an example of the P300 response
for a subject involved in an oddball paradigm, where the presented stimuli are different geo-metric shapes, and the subject is asked to detect just one specific shape among the others. The topographic distribution of the brain response can be observed, and it could be noticed that the polarity change across the scalp, shown by the P300 wave, depends on the reference electrode. For the particular case shown in the figure a good brain response can be detected in central and parietal electrodes, as a much larger P300 amplitude (red line) related to target stimuli stands out from a baseline measure (blue line) obtained by averaging non-target responses.
Chapter 1. EEG systems 10
of Visual Evoked Potentials (VEP), performed in order to analyze the way the brain perceives and processes visual input, to control BCI applications and to support neurological diagnosis. VEPs are evoked potentials that occur in the visual cortex, time-locked to a repeated sensory stimulation related to a subject’s visual field. Within VEP protocols no response or cognitive processing by the subject is required. The visual stimulation can consist for instance of checker-board pattern reversal, flashing black/white images, pattern onset stimuli or photic stimulation
(light) [29]. In a typical setup to elicit VEPs a flashing stimulus is displayed either at the center
of a screen or through light-emitting diodes (LEDs) in the central visual field, since it causes a greater response amplitude.
Some interesting evidences have been obtained from the analysis of µ and β EEG rhythms recorded over sensorimotor cortex within the so-called motor imagery paradigm. Typically, during each acquisition session, subjects are asked to imagine moving for few seconds when
the cue representing the movement instruction appears on a screen. As reported in [30] it has
been observed that the patterns of µ and β band desynchronization over sensorimotor cortical areas during motor imagery are similar to those during actual movement. Moreover, principal components analysis on sample average signals has shown marked individual differences in motor-related EEG patterns, topographically and spectrally focused. These evidences support the possibility of effectively controlling µ and β rhythm amplitude through motor imagery and individual training.
More recently, EEG acquisitions have been performed during the so called “speech imagery”, aiming at recognizing the neural activities associated with speech production. In some proto-cols, enrolled subjects are instructed to imagine continuous vowel vocalization for few seconds from the onset of a specific cue which can be an acoustic signal or a task-representative image
appearing on a screen [31]. In BCI context this kind of tasks are designed in order to
discrim-inate differences in brain activity during vowel or syllables speech imagery providing a control scheme for communication based on the interpretation of individual speech correlates in EEG. Furthermore,when using SCPs, the training for their voluntary control can be carried out within an acquisition protocol where a thought-translation device provides a feedback cursor on a
screen, whose position constantly reflects the voltage shifts. Typically [32] the subjects are
asked to move a cursor which appears at the center or at the periphery of a screen toward a target, by modulating their brain electrical activity. A preparatory phase in which the cursor remains stationary on the screen is followed by an active phase in which it moves in a direction, either horizontal or vertical, with constant speed, and in the perpendicular one according to the user’s SCP amplitude.
A tree summarizing the EEG signals elicitation approaches described above is given in Figure
Chapter 1. EEG systems 11
FIGURE1.6: EEG signals elicitation approaches.
Several acquisition protocols have also been designed for emotion recognition purpose, which consists in the detection of changes in the brain electrical activity related to distinct emotions which are elicited by a specific stimulation content like images, sounds, words, scenes, videos, etc. In this regard it is important to consider that different stimuli influence individual emotional state, so that different subjects with personal emotional experiences show distinct responses to the same stimulus. Emotional activities of the brain causes different distributions of character-istic EEG waves. In several works EEG data are collected from subjects during the projection
of movie clips or pictures. In [33] features from EEG signals are used for discriminate among
three different emotions, happiness, disgust, and fear, artificially elicited while watching two
commercial movie clips for each emotion. In [34] authors employed a specially designed
ac-quisition protocol for the classification of six emotions evoked by visual inputs consisting of pictures with emotion-related facial expressions. The functional properties of the system formed by mirror neurons, which plays a fundamental role in emotion induction related to action
imi-tation [35], are considered within this protocol. In the proposed experiment, pictures showing
people expressing the six basic emotions, namely happiness, surprise, anger, fear, disgust and sadness are subsequently and randomly projected (10 pictures per emotion), separated by black and counting down frames allowing subjects to relax during intervals between stimuli.
In [36] an acquisition protocol for arousal monitoring has been also proposed. Authors
eval-uated EEG signals acquired during the simulation of a security surveillance system. Different stimuli representing x-ray images of luggage objects were displayed on a screen and users are required to perform a choice task to distinguish dangerous from harmless objects. Users had to quickly respond to stimuli presented in blocks of many trials, so that a fading level of arousal
Chapter 1. EEG systems 12
was expected. These kind of EEG acquisition protocols have a high relevance within the frame-work of reducing risk of errors or accidents when dealing with sensitive tasks, and can also provide monitoring of individual mental activity for purpose of continuous authentication in high security contexts.
The experimental setups described above represent an overview of acquisition protocols com-monly employed when investigating brain functioning with different purposes, such as the eval-uation of brain activity patterns for applications like diagnosis and device control. Some of the aforementioned paradigms are also employed in biometrics for user recognition as detailed in the following, while some others have some potentials which have not been explored within the biometric framework.
1.2.2 Scalp electrodes configurations
The spatial distribution of brain activations as reflected in scalp EEG signals strongly depends either on the mental state of the subject or on the performed task during the acquisition session. For each designed protocol it can be identified a suitable electrode configuration in terms of number of sensors, their placement on the scalp as well as their density, according to the aim of the analysis, selecting a subset of channels in the 10-20 extended system shown in Figure
1.1. A specific minimal set of electrodes selected considering neurophysiological evidences and
optimization criteria is generally employed in each experimental setup. Usually, the reduction of data dimension due to a selection of electrodes helps in improving the effectiveness of the data analysis.
As previously pointed out in Section1.1, in the closed eyes resting condition the predominant
Alpha oscillations can be detected especially in the parieto-occipital region of the scalp. They
reflect the default mechanisms of synchronization of cortical neurons activity [11]. Therefore a
description of the ability of the central nervous system to transmit signals to and from the cere-bral cortex can be carried out focusing on signals from parieto-occipital electrodes. On the other hand, a widespread reduction in activity is commonly observed turning to open eyes resting con-ditions, wich reflects neuronal Alpha desynchronization. Further topographic changes occurring across frequency bands can be detected considering a full-scalp montage in the analysis of open eyes resting state.
Furthermore, various configurations can be employed for the effective detection of different EEG activation patterns during the performance of different mental calculation tasks. Some significant differences between mental calculation tasks, related to change in power between task and rest conditions, have been observed in the δ and β bands in the frontal lobe,
reflect-ing different selective processes durreflect-ing focusreflect-ing on relevant information [25], depending on the
Chapter 1. EEG systems 13
Delta, Theta and Beta activity in frontal leads during subject’s internal concentration has been observed. This is in accordance with the evidence that among the various functions of the human brain directing and allocating brain resources are governed by the frontal lobe. In particular de-cision making, reasoning and complex calculation require the integration of multiple processes, specific of each task. It results in differences of frontal lobe activity between tasks, reflecting activation of different neural networks. Therefore frontal leads can be effectively employed for the analysis of such specific functions.
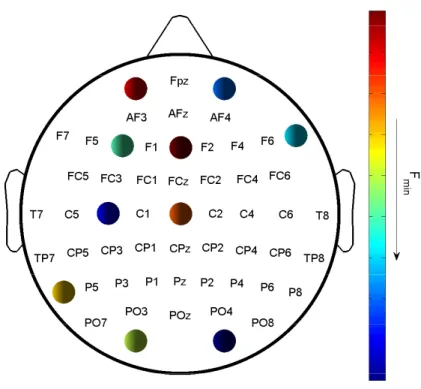
More specific electrodes configurations are commonly employed in the analysis of brain re-sponses. In particular, several studies in literature addressed the effectiveness of different elec-trode configurations used to detect the P300 brain response. A trade off between user friendly solutions employing few electrodes and accuracy in terms of correct classification of brain re-sponses is needed for the suitability of such P300-based systems. Good results have been
ob-tained in [37] employing only eight electrodes from the midline and the parietal region of the
scalp, namely Fz, Cz, Pz, Oz, PO7, PO8, P3, P4, as pictorially shown in Figure1.7(a). Thereby
accuracy improvement has been obtained removing redundant information from contiguous time points which would reduce the generality of the analysis.
A different smaller subset of the electrodes montage is considered when studying VEP signals
related to specific kind of visual attention stimulation as detailed in Section 1.2.1. In these
cases typically EEG signals are recorded from electrodes located in the posterior region of the scalp, mostly over the left and right hemispheres of the primary visual cortex. Indeed either periodic or transient brain responses to stimulation involving the visual system can be detected
just considering electrodes O1 and O2 within the 10-20 international system [38].
Also in the analysis of rhythm topographies during motor imagery protocols, a subset of the extended 10-20 international system is often employed, considering sensors placed over the sensory-motor cortical area, namely FC3, FC1, FCz, FC2, FC4, C5, C3, C1, Cz, C2, C4, C6,
CP3, CP1, CPz, CP2, CP4 as shown in Figure1.7(b). In fact it has been repeatedly shown that
both movement and motor imagery are accompanied by desynchronization in µ and β bands over the centro-lateral side of the scalp, showing hemispheric asymmetries for specific conditions and
frequency ranges [30]. Results showed marked individual-specific traits regarding topographic
and spectral effects of movement and motor imagery, also indicating that movement, imagery and bands are dissociated in terms of individual differences. Signals from motor cortex are also employed for the performance of speech imagery protocols. In has been shown that neural activation detected over medial and posterior regions occur during imaginary lip movement and
vocalization of vowels [31] or their mental repetition. The electrodes that are distant from the
active regions may not provide relevant information. Therefore, a more effective analysis of EEG features during speech imagery could be obtained discarding them.
Chapter 1. EEG systems 14 FPZ FPZ PZ PZ P5 P3 P1 P2 P4 P6 P5 P3 P1 P2 P4 P6 P7 P7 CPZ CPZ CP6 CP6 CP4 CP4 CP2 CP2 CP1 CP1 CP3 CP3 CP5 CP5 TP7 TP7 FCZ FCZ POZ POZ
PO3 PO1 PO3 PO1
PO7 P9 P1O P9 P1O PO8 PO4 PO4 PO2 PO2 O2 O2 O1 O1 OZ OZ AFZ AFZ FZ FZ F7 F7
AF3 AF1 AF2 AF4 AF3 AF1 AF2 AF4
AF8 AF8 AF7 AF7 FP2 FP2 FP1 FP1 CZ CZ C1 C1 C3 C3 C5 C2 C4 C6 C5 C2 C4 C6 T7 T7 FT7 FT7 FC4 FC4 FC2 FC2 FC1 FC1 FC3 FC3 F6 F6 F4 F4 F2 F2 F3 F3 F5 F5 FC5 FC5 F1 F1 P8 P8 F8 F8 TP8 TP8 TP9 TP10 TP10 FT8 FT8 T8 T8 FC6 FC6 NZ NZ IZ IZ PO8 PO7 PO8 F9 F10 F9 F10 T10 T9 T10 (a) (b) TP9 T9
FIGURE 1.7: Electrodes placement for a P300 based system: an example (a). Electrodes
placement for a motor imagery based system: an example (b).
Moreover, effective negative and positive SCP shifts can be controlled selecting the best
per-forming channel. In this regard, in [32] it is shown that self-regulation skills differ between
subjects, but that the Cz derivation could be generally used for an effective SCP feedback learn-ing. Interestingly, in that study it was shown that many subjects generated a maximal SCP differentiation at other, often neighboring, electrodes than Cz.
On the other hand, the evaluation of the most effective electrodes placement for purposes of mental state monitoring or emotion recognition strongly depends on the task the enrolled
sub-ject is involved in. In [36] it is observed how occipital channels account strongest for the
de-tection of mental state differences reflected in Alpha activity during a visual surveillance task. Interestingly, it is there pointed out that accordingly changes of Alpha activity depend on visual processes.
To sum up, in the above mentioned studies, it has been shown that depending on the given goal, the selection of electrodes based on neurophysiological considerations brings to higher performance systems.