OPTICAL SPECTROSCOPY OF SDSS J004054.65-0915268: THREE POSSIBLE SCENARIOS FOR THE
CLASSIFICATION. A z∼5 BL LACERTAE, A BLUE FSRQ, OR A WEAK EMISSION LINE QUASAR
M. Landoni & A. Zanutta,
and A. Bianco, F. Tavecchio, G. Bonnoli, and G. Ghisellini INAF-Osservatorio Astronomico di Brera, Via Emilio Bianchi 46, I-23807 Merate, Italy
Received 2015 February 20; accepted 2015 December 15; published 2016 January 28 ABSTRACT
The haunt of high-redshift BL Lacerate objects is day by day more compelling tofirmly understand their intrinsic nature and evolution. SDSS J004054.65-0915268 is, at the moment, one of the most distant BL Lac candidates, at z∼5. We present a new optical-near-IR spectrum obtained with ALFOSC-NOT with a new, custom designed dispersive grating aimed to detect broad emission lines that could disprove this classification. In the obtained spectra, we do not detect any emission features and we provide an upper limit to the luminosity of the CIVbroad
emission line. Therefore, the nature of the object is then discussed, building the overall spectral energy distribution (SED) and fitting it with three different models. Our fits, based on SED modeling with different possible scenarios, cannot rule out the possibility that this source is indeed a BL Lac object, though the absence of optical variability and the lack of strong radioflux seem to suggest that the observed optical emission originates from a thermalized accretion disk.
Key words: BL Lacertae objects: general – techniques: imaging spectroscopy
1. INTRODUCTION
BL Lac objects are active galactic nuclei dominated by a strongly beamed nuclear non-thermal emission arising in a relativistic jet pointed toward the Earth (e.g., Urry & Padovani
1995). Relativistic effects amplify the radiation produced in the
jet by relativistic electrons through synchrotron and inverse Compton mechanisms. Moreover, contrary to a flat spectrum radio quasar, the intrinsic nuclear thermal components are also quite weak(e.g., Ghisellini et al. 2011). As a consequence, the
non-thermal continuum outshines spectral features(emissions of absorptions), making the determination of their redshift quite tricky(Landoni et al.2013,2015). Nevertheless, the estimate of
their distance is obviously important to shed light on the nature of their radiation mechanism and about their evolution. In fact, radio-selected BL Lacs display moderate positive evolution, while X-ray-selected objects negatively evolve when derived from X-ray surveys, or do not evolve at all(Rector et al.2000; Padovani et al.2007; Giommi et al.2009,2012). A continuum
trend from slightly positive evolution for low energy peaked BL Lacs, to strong negative evolution in the case of high-peaked ones was proposed(Rector et al.2000). However, the statistics
concerning the evolution of the BL Lacs suffer from redshift incompleteness, making the increase of the objects with reliable redshifts (from homogeneous and unbiased selections) a core issue(see also Shaw & Romani2013for a discussion). A more intriguing fact is that these objects are detected almost in the low-z universe (low-z 1) and very few sources are known at low-z 2 (see, e.g., Shaw & Romani2013). This has been interpreted in terms of
the evolution from highly accreting sources(FSRQ) to BL Lacs, in which accretion is rather low (Böttcher & Dermer 2002; Cavaliere & D’Elia2002).
For all of these reasons, the search of high-redshift BL Lacs is becoming even more compelling. With this aim, we searched in the most extensive BL Lac catalogs tofind high-z candidate sources, focusing on the compilation of the homogeneuous optically selected BL Lac objects from the Sloan Digital Sky Survey by Plotkin et al.(2010). We found that, in the sample of
radio-loud BL Lac candidates, the source SDSS J004054.65-0915268 (hereafter 0040–0915) is characterized by a feature-less optical continuum and its redshift, based on a Lyman-limit system(LLS), is surprisingly high (z = 4.976), making it one of the most distant BL Lac candidates. It is worth mentioning that Fan et al.(2006) serendipitously found another, even more
distant, candidate BL Lac object (but see Leipski et al. 2014
classifying it as QSO). However, the required spectral range to reveal broad emission lines redward of the Lyα line, such as the CIV, is unfortunately outside the sensitivity range of our
instrument in this object. For this reason, we thus select 0040–0915 for our spectroscopic investigation, whose nature is a matter of debate in the literature. In fact, while Collinge et al. (2005) and Plotkin et al. (2010) consider the source to be a BL
Lac candidate(see Table 5 in both papers), Lane et al. (2011)
on the basis of Spitzer mid-IR data suggest that the source is not dominated by non-thermal continuum, challenging the BL Lac hypothesis. This source has been considered to be a weak emission line quasar (WELQ), a new recent class of AGNs with weak or absent broad emission lines, by Diamond-Stanic et al. (2009). Despite having only an upper limit in the radio
band, it was classified as a Radio Loud BL Lac Candidate object by Plotkin et al.(2010). The different classifications of
this source rely mainly on the SDSS spectrum, which, unfortunately, can determine only the presence or absence of the broad Lyα line. This spectral feature could be weak for the combination of both severe intervening absorptions or a poor SNR in that band.
In the SDSS spectrum of 0040–0915, the Lyα emission line appears to be absent while other weak features could be interpreted as SIV or NVemission. We note, however, that a
proper modeling of the continuum and emission line should be used to robustly infer the detection of the feature. However, the poor signal-to-noise ratio of the SDSS spectrum does not allow us to further speculate on those emission lines. The CIVbroad
emission line, whose detection allows us to disentangle between scenarios, could be only partially detected near the end of the spectral range(in the near-IR band). For all of these
The Astronomical Journal, 151:35 (7pp), 2016 February doi:10.3847/0004-6256/151/2/35
reasons, a good quality near-IR spectrum largely covering the region of the expected CIVfeature(up to 1 μm) is mandatory to
possiblyfirmly detect the line and clear the fog surrounding the scenario between normal broad line QSO, BL Lac, or exotic source.
In order to fill this gap, we exploited the upgrade of the
dispersive element at the Andalucia Faint Object
Spectrograph and Camera (ALFOSC) spectrograph at the Nordic Optical Telescope (NOT, La Palma, ES), designing a new red grating to match these particular requirements aiming to perform the needed observation. Although in the literature there are a number of papers that discuss the existence of quasars with weak emission lines (see, e.g., Diamond-Stanic et al. 2009; Plotkin et al. 2010; Lane et al. 2011; Meusinger et al. 2014), no exhaustive broadband spectral energy
distributions (SEDs) are interpreted adopting various models, ranging from normal QSO to BL Lacs. In particular, in this work, we present SEDs assembled with data from far-IR to X-Rays data and we apply physical models to possibly shed light on the nature of the source. In this paper, we thus show both the obtained spectroscopic results along with three possible frameworks for the interpretation of this high-redshift source by the adoption of popular scenarios (see, e.g., Ghisellini et al. 1996; Maraschi et al.2010).
The paper is organized as follow. We report, in Section 2, the grating manufacturing and the data reduction while main results are reported in Section 3. Discussion and conclusions are given in the last section. We use cgs units unless stated otherwise and the following cosmological parameters, H0=70 km s−1Mpc−1,Ωm=0.27, ΩΛ=0.73.
2. GRATING MANUFACTURING, OBSERVATIONS, AND DATA REDUCTION
The dispersive element used for the spectroscopic acquisi-tion highlighted in this work was specifically designed and produced in the INAF (OABr, Merate) facilities. The possibility to design and manufacture a dispersive element specific for a target observation is surely effective for
addressing future astronomical scientific cases. The logic behind this new custom device was to obtain a low dispersive element with an extended wavelength range, which is capable of detecting the CIVbroadband line of the object 0040–0915.
This device, called Grism #20, was integrated at NOT-ALFOSC and its specifications are reported in Table 1.
This dispersive element is a grism(GRating + prISM), based on a volume phase holographic grating (VPHG) and manu-factured with state-of-the-art photopolymeric material(Bayfol®
HX), developed by Bayer MaterialScience AG (Berneth et al.2013). Such photopolymers show an easy processability
(they are self-developing) together with a large modulation of the refractive index (Δn) and, even more interesting, the Δn can befinely tuned by acting on the writing conditions. These materials are becoming a reliable alternative to dichromated gelatin (DCG, the reference material for VPHGs), with high dynamic range and sensitivity(Zanutta et al.2014a,2014b).
We delivered the grating at ALFOSC-NOT on 2014 September 27 and we observed 0040–0915 during the night of 2014 September 30 and October 1. We secured two individual exposures of 2200 s each using the 1 8 slit. The seeing during the night was∼1 50 and the sky was almost Table 1
Grism#20 Main Specifications’ Summary
GRISM λcentral Efficiency Dispersion Δλ Resolution l/mm
Name (Å) (1) at 7350Å (2) (Å pixel−1) (3) (Å) (4) (5) (6)
Grism#20 7350 88% 2.079 5760–10200 895 484
Note. Col. (1): working central wavelength of the grating; Col. (2): deviceʼs first order diffracted efficiency; Col. (3): pixel dispersion of the grism; Col. (4): wavelength range; Col.(5): calculated resolution; Col. (6): pitch of the grating.
Table 2
Model Parameters and Derived Values for the Three considered Scenarios
Name MBH Γ θv Rdiss RBLR Pi¢ B γb γmax αX Ec
[1] [2] [3] [4] [5] [6] [7] [8] [9] [10] [11] [12]
Radio-quiet 2e9 K K K 1132 K K K K 1.2 130
Blue FSRQ 1e9 14 3 360 212 4e–3 1.2 1.5e4 1e6 1.2 150
BL Lac K 14 3 240 K 3e–3 1 1.4e4 1e6 1. K
Notes. Col. [1]: type of source; Col. [2]: black hole mass in solar mass units; Col. [3]: bulk lorentz factor; Col. [4]: viewing angle (degrees); Col. [5]: distance of the blob from the black hole in units of 1015cm; Col.[6]: size of the broad line region in units of 1015cm; Col.[7]: power injected in the blob calculated in the comoving frame, in units of 1045erg s−1; Col.[8]: magnetic field in gauss; Col. [9] and [10]: minimum and maximum random Lorentz factors of the injected electrons; Col. [10]: energy spectral index assumed for the X-ray corona; Col.[11]: cut-off energy of the X-ray spectrum, in keV [assumed to be]
Table 3
Model Parameters and Derived Values for the Three considered Scenarios Name logLd Ld/LEdd logPr logPB logPe logPp
[1] [2] [3] [4] [5] [6] [7]
Radio-quiet 47 0.45 K K K K
blue FSRQ 46 0.03 45 45 44 44
BL Lac K K 45 45 44 44
Notes. Accretion and jet powers: Col. [1]: type of source; Col. [2]: logarithm of the accretion disk luminosity (units are erg s−1); Col. [3]: accretion disk luminosity in eddington units; Col.[4]–[7]: logarithm of the jet power in the form of radiation(Pr), poynting flux (PB), bulk motion of electrons (Pe) and [7]
protons(Pp), assuming one cold proton per emitting electron. units are erg s−1.
These values refer to two Jets
clear. We also observed two standard stars with the same configuration of the instrument to flux calibrate the two spectra. Standard IRAF1 procedures were adopted (bias, flat field correction, wavelength, and flux calibration) to fully reduce each observation. Finally, we averaged the two spectra according to their signal-to-noise ratios (S/N ∼ 15) in order to obtain the mono-dimensional spectrum. We also cross-checked the absolute flux calibration through an aperture photometry of the i-band acquisition image of thefield, secured just before obtaining the spectra.
3. RESULTS
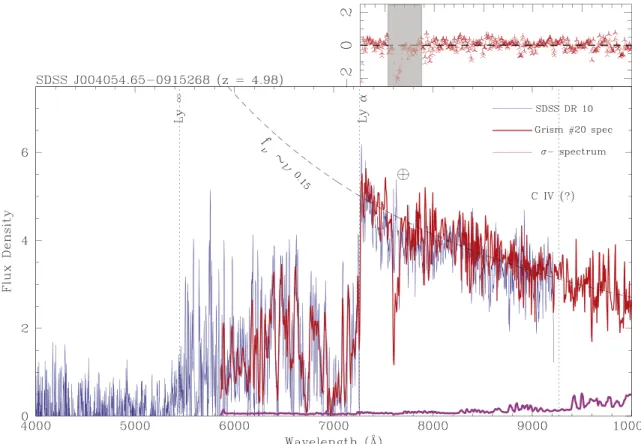
We report in Figure 1 the optical spectrum of 0040–0915 obtained by the SDSS DR10(blue solid line) and the new one secured with ALFOSC-NOT equipped with Grism #20 (red solid line, SNR∼ 15). The redshift of the source, estimated through the Lyα brake and the Lyman limit, is z∼4.981 and no intrinsic broad emission lines (neither Lyα nor CIV) are
detected. We mark in Figure1the expected position of the CIV
emission line at the redshift mentioned above(λ ∼ 9300) with a vertical dotted line. Wefitted the continuum by the adoption of a power law of the form f µn0.15
n , consistent with the results obtained by Fan et al.(2006) for a similar high-z lineless AGN
(see Figure 3 of Fan et al.2006). Residuals are reported in the
top right panel of Figure1. The SDSS spectrum, due to its poor S/N at the edge of spectral sensitivity and its short range in the near-IR(see Figure1) cannot rule out the presence of a broad
emission line ascribed as CIV. We note, however, that the
SDSS best fit reported in DR10 could have been tumbled a possible weak emission of Lyα, though in that region the fit is rather poor and systematically underestimates the continuum. This hint is not, however, detected in our newly obtained spectra (see Figure 1). In fact, the fit adopted by the SDSS
could mimic the presence of spectral features that are not obviously present in the data. For instance, the detection of the SIVemission line has been ruled out in the new DR10 release.
3.1. CIVEquivalent Width Upper Limit
The ALFOSC-NOT spectrum, which extends up to 1μm, has a sufficient spectral coverage and decent S/N to safely exclude the presence of the CIV broad emission line (see
Figure1). Following the description by Fan et al. (2006), we
modeled the spectrum in region 8000–10,000 (where the S/N and resolution can be considered roughly constant for our estimation) using the power law described before plus an emission line model(FWHM ∼ 3000–4000 km s−1) for the CIV
and applying to the resulting model an S/N similar to that observed in the NOT spectrum. We performed simulations by increasing the Equivalent Width (EW) of the line until the signal in the simulated spectrum exceeds the noise by 3σ. We repeated this recipe 100 times, as in a usual Monte Carlo simulation.
Figure 1. SDSS J004054.65-0915268 optical spectrum in the band 4000 Å—1 μm. Units are in 10−17erg cm−2s−1Å−1. The blue solid line is the spectrum available
in the Sloan Digital Sky Survey DR10 while the red solid line represents the newly acquired spectrum at ALFOSC-NOT. Telluric absorption lines are marked with⊕. The redshift of the source, estimated through Lyα break and Lyman-limit features, is z=4.981. The presence of broad emission lines ascribed to Lyα and CIVis
ruled out up to EW∼5 Å. The dashed black line is the continuum best fit (F( )n µn0.15). The purple solid line is the 1σ spectrum. Upper right panel: residual
between thefit and the observed NOT spectrum.
1
IRAF(Image Reduction and Analysis Facility) is distributed by the National Optical Astronomy Observatories, which are operated by the Association of Universities for Research in Astronomy, Inc., under cooperative agreement with the National Science Foundation.
We report, in Figure 2, the results obtained from this procedure. We show in the lower panel the two components of the model(dotted line for the power law and dashed line for the line) and the resulting spectrum (brown solid line) after applying Gaussian noise to simulate our observed S/N. Since the CIVemission line has a rest frame EW of 5Å and its signal
exceeds the noise with a threshold level of 3-σ we can conclude that the upper limit to the EW of CIVis 5Å at a 3σ confidence
level. For comparison, we report in the upper panel the observed NOT spectrum (red) and the 1σ error spectrum (purple solid line). As a sanity check, we also calculated the minimum equivalent width in the same region following the procedure described in Sbarufatti et al. (2006) and adopted in
various papers to assess limits on the detectability of spectral features(see, e.g., Schneider et al.1993; Sbarufatti et al.2006; Farina et al. 2013). This method is completely model
independent and relies only on the width of the spectral element (which is a function of the instrument) and the S/N (see Sbarufatti et al. 2006 for details). In particular, we evaluated the EW on bins of the size of the resolution element in various regions of the spectrum (excluding the telluric structures) and we assume as EWminthe 3σ deviation from the mean(μ∼0 Å) of the distribution of the EWs obtained in each bin. We found that the EWmin (rest frame) is ∼5 Å consistent with the limit obtained with the model described above. We can thus conclude that, if the CIVfeature is present, it shall have an
EW 5Å rest frame. We report in the following section the possible scenarios that could explain the observed
optical-near-IR spectrum after a discussion regarding caveats of the estimation of the source’s redshift.
3.2. Caveats on the Redshift of 0040-0915
The redshift estimation from the onset of the Lyα forest can be biased to higher values(up to Δz∼0.1) if the EW of the broad Lyα line is very small (see, e.g., Figure 3 of Diamond-Stanic et al.2009). Although in the NOT and SDSS spectra the
continuum appears to be dominated by the power-law component and this effect could be mitigated, other biases should be considered when redshift is derived only through absorption features(see, e.g., Prochaska et al.2008and Figures 1 and 2 in Steidel et al. 2010). In particular, the onset of the
Lyα forest can be affected by absorption both blueward and redward of the Lyα emission line. When considering systems like proximate Damped Lyα System (Prochaska et al. 2008)
absorptions near the systemic velocity that completely absorbs the center of the Lyα line could move the onset of the Lyman forest toward redder wavelengths. Overall, these effects can bias the observed redshift up toΔz ∼ 0.01.
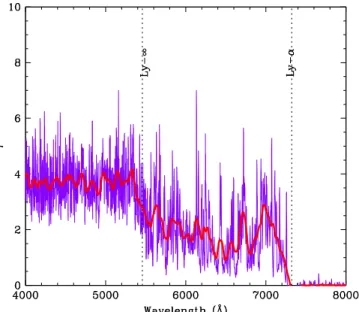
We tried to check the redshift of 0040–0915 through an alternative method based on the optical depth. Following Fan et al. (2006), we defined the optical depth as logffobs int
t =
-where fobs is the observed flux of the source and fint is the extrapolated intrinsicflux obtained from the power-law fit. We report the results(using the SDSS spectrum) in Figure3. The wavelength location ofτ=0 marks the 1216 Å features, which correspond to z=4.989. This value is consistent with the one considered in this paper and confirmed in the SDSS DR10 spectrum analysis(z=5.002). Consistently, we also mark the position of the Lyman edge at 912Å at that redshift. As expected, at that location the optical depth monotonically increases up to the saturation plateau at τ∼4 (see, e.g., Peterson1997).
Figure 2. CIVemission line equivalent width limit estimation. In the bottom panel is reported the simulated spectrum by the adoption of the power law (dotted black line, estimated on the NOT spectrum) and a CIVemission line model with EW of 5 Angstrom rest frame (dark green dashed line) and an FWHM of 4000 km s−1rest frame. The resulting spectrum, which is the sum of the component plus a noise to simulate the same SNR of the NOT spectrum, is indicated by the solid brown line. The 3s threshold is indicated by the light blue dashed line. Upper panel: Comparison of the observed NOT spectrum (solid red) and the 1s spectrum (solid purple line). Details on the estimation are given in the paper.
Figure 3. Optical depth derived from the spectrum of 0040–0915. The blue solid line is the ratio between the observedflux on the SDSS spectrum and the intrinsic one extrapolated from the power-lawfit (see Section3.2). The thick solid line is a 20Å boxcar filter on the blue spectrum. The redshift of the nearest HIcloud is assessed through the wavelength where the optical depth drops toτ∼0. This value catches the cold HIcloud nearest to 0040–915. The
expected position of the Lyman-¥ is consistent with our interpretation(see the text of Section3.2) and it is marked with a vertical dotted line.
4. DISCUSSION
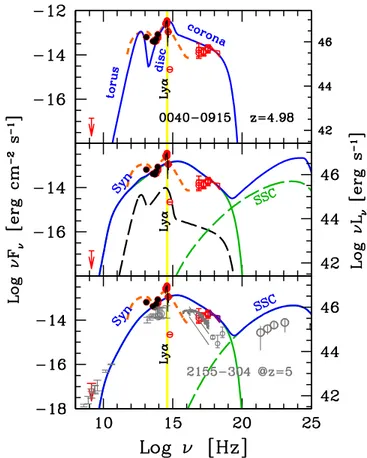
The rest frame near-IR UV SED of 0040–0915 is shown in Figure 4, reporting archival data2 and our spectrum, and in Figure 5, reporting the overall SED compared with three different models.
Weak or absent broad emission lines is the main defining property of BL Lac objects, namely jetted sources whose jets are pointing at us and whose jet emission is strongly boosted by the bulk relativistic motion of the emitting plasma. On the other hand, all known BL Lac objects are radio-emitters, as expected in the case of a jetted source. The other property of BL Lac objects pertinent to our case is the absence of visible accretion disk emission. Our source, instead, has a IR-optical SED showing a peak (in ν Lν) at a rest frame frequency in the UV band, and a rather hard spectrum below. The classification of 0040–0915 is, therefore, a puzzle. In the following, we interpret 0040–0915 alternatively as a radio-quiet quasar, a flat spectrum radio quasar (FSRQ) with a particularly enhanced and blue jet emission, and a BL Lac object.
The adopted model for the disk and jet emission is described in Ghisellini & Tavecchio (2009) (see also the discussion
(Section 4) and Tables2 &3). We summarize here its main
features and parameters. The disk is a standard Shakura-Sunyaev (1973) disk, with an X-ray corona phenomenologi-cally described as emitting a cut-off power-law spectrum:
Fcorona( )n µn-aXexp(-n nc). The non-thermal source is
assumed to be a sphere located in the jet at some distance Rdissfrom the black hole. It is embedded in a homogeneous and
tangled magneticfield B and moving with a nulk Lorentz factor Γ at a viewing angle θv. Throughout the source, relativistic electrons are injected isotropically in the rest frame with a power Pe¢ as measured in the comoving frame. They are injected with a smoothly joining broken power law, with a break at a random Lorenz factor γb, up to the maximum random Lorentz factor γmax. They produce synchrotron and inverse Compton radiation. The seed photons for scattering are the ones produced internally to the jet, by the synchrotron process, and the ones produced externally to the jet, by the accretion disk, its X-ray corona, the BLR, and the torus. The jet power is in the form of produced radiation(Pr), Poynting flux (PB), kinetic energy of the emitting electrons (Pe), and protons (Pp), assumed to be cold and one per each emitting electron.
We remark that our aim in reproducing the SED of the source is not tofind out the exact values of the parameters but, Figure 4. IR-optical SED of 0040–0915 in the rest frame. The archival
photometry data(from SDSS, WISE, and Spitzer/IRAC) are red circles while our optical spectrum is the solid black line. The vertical yellow line indicates the hydrogen Lyα frequency. Above this line, we expect absorption due to intervening matter. The SED is compared with two different models: the solid blue line is the spectrum from a standard Shakura & Sunjaev(1973) disk, while the solid green line is the non-thermal continuum produced by a relativistic jet thatfits the overall SED (as illustrated in Figure 5 in the mid and bottom panels).
Figure 5. Spectral energy distribution of 0040–0915, interpreted with three different models. In all panels, the vertical yellow stripe indicates the location of the hydrogen Lyα line. Top panel: the source is assumed to be a radio-quiet quasars, whose accretion disk, torus, and X-ray corona are responsible for all data points. In this case, the anomaly of the source is the presence of a strong ionizing continuum produced by the disk without the corresponding presence of a“normal” broad line region. Mid panel: the source is assumed to be a “blue quasar,” namely a radio-loud FSRQ whose non-thermal jet emission overwhelms the thermal disk radiation. This implies a rather “blue” jet spectrum(Ghisellini et al. 2012). In this case, the broad lines, though present, are hidden by the jet radiation. The bottom panel illustrates the case of a BL Lac object, in which the broad lines are not produced because of the very weak radiation produced by the disk(that likely is in the inefficient ADAF regime). We compare the spectrum of 0040–0915 with a well known BL Lac object, PKS 2155–304, as it would be seen if it were at z=4.98. Note that the radio emission of PKS 2155–304 (if it were at z=4.98) is consistent with the upper limit and that the overall energetics and type of spectrum are similar. Both in this and in the“blue quasar” interpretations, the problem is the very poor agreement with the IR-optical data. For comparison, the SED of QSO is reported(orange dashed line, Richards et al.2006). Black dots are from Spitzer IR(Lane et al.2011).
2 From ASDC: http://www.asdc.asi.it, SDSS and Spitzer (see Lane
using typical values for the parameters(see, e.g Ghisellini et al. 2010), to check the consistency of the different classifications.
4.1. The Radio-quiet Quasar Scenario
Figure 4 shows the spectrum produced by a disk around a black hole of mass MBH=1.9×10⁹Meaccreting at 45% of the Eddington rate. This interpretation is consistent with the existing data, considering that the emission of the torus (contributing to the IR luminosity) is rather uncertain. We can then interpret 0040–0915 as a radio-quiet quasar, with a large black hole mass and accreting vigorously. However, unlike other quasars with similar accretion rates and black hole masses, in 0040–0915 there is no (or very weak) broad emission line region. The SED in Figure 4shows that there is no deficit of ionizing photons, so the absence of the BLR must be caused by something else.
4.2. The Radio-loud Scenarios
An alternative possibility is to detect the source in deep radio band observation withflux just below the current upper limit. In fact, in this case, the source would be characterized by a radio loudness RL15, that, according to the classical definition by Kellermann et al. (1989), allows us to classify
the source as radio loud. This, however, opens up the possibility of two subcases:(1) the jet non-thermal continuum contributes to the optical-UV emission partly swamping the emission lines or(2) the jet is intrinsically weak or misaligned and therefore does not contribute to the optical-UV continuum. In the latter case, this does not solve the problem of weak emission lines, as for the radio-quiet case. Therefore, we concentrate on the first case presenting two canonical examples.
4.2.1. The Blue FSRQ Scenario
We next investigate the case of an FSRQ with a jet pointing at us and emitting a non-thermal spectrum able to hide the lines, of normal luminosities. This requires that the jet continuum also hides the radiation produced by the accretion disk. To have an estimate or upper limit to the disk emission in this case, we have used our IR-optical spectrum to derive an upper limit of the Lyα and CIV broad lines, resulting in
LLyα1.1×1045 erg s−1 and LCIV<7×10
44erg s−1. Assuming the template in Francis et al.(1991; see also Vanden Berk et al. 2001), we can derive an upper limit for the disk
luminosity of Ld<6×1046erg s−1. Note that our IR-optical spectrum and archival data correspond to a luminosity exceeding 1047 erg s−1. The main difficulty of this scenario is the very poor fit to the optical (i.e., rest frame UV) data, severely underestimated. The blue appearance of the jet continuum is achieved by assuming that the dissipation region Rdiss of the jet is beyond the broad line region RBLR. This implies a deficit of seed photons (produced externally to the jet) that would otherwise rapidly cool the emitting electrons, shifting their relevant energies toward smaller values, and thus producing a redder spectrum(i.e., a synchrotron flux peaking in the sub-millimeter, and a Inverse Comptonflux peaking at ∼10 MeV, as is the case for“normal” FSRQ (see, e.g., Ghisellini & Tavecchio2015).
4.2.2. The BL Lacertae Scenario
A second possibility to account for a moderate radio-loud source without strong emission lines, is that the source is a BL Lacertae object as tentatively classified by Plotkin et al. (2010).
If 0040–0915 is a BL Lac object, then the disk emission would be negligible, and the absence of ionizing photons would be the cause of the absence of the broad emission lines. The entire emission would be produced by the jet. As can be seen in Figures 4and 5, the main difficulty with this interpretation is the poor fit to the optical data and the infrared Spitzer data (Lane et al.2011), as in the blue FSRQ case. The location of
the emitting region is not constrained to be beyond the BLR, but the jet parameters of this case are very similar to the blue FSRQ. The bottom panel of Figure 5 shows also the comparison of the SED of 0040–0915 with the SED of PKS 2155–304, if the latter had z=4.98. We can see that the current radio upper limit is not severe enough to exclude the BL Lac interpretation, but future deeper radio observations can help to discriminate.
In conclusion, our modeling, which combines optical and multi-wavelength data with three possible scenarios, cannot rule out the possibility that this source is indeed a BL Lac object or a blue FSRQ. A critical point in this interpretation is that we expect a radio emission with aflux slightly below the current upper limit. Therefore, we cannot yet establish without any doubt the classification of 0040–0915, and deeper radio observations are mandatory. From the optical point of view, a monitoring of the source could reveal variability or flares expected from non-thermal dominated sources. The newly presented SED prefers the idea that the optical emission is dominated by the direct emission from an accretion disk as expected from a normal QSO. The low luminosity of the lines is puzzling and makes 0040–0915 an example of high-redshift WELQ as discussed by many authors in the literature(see, e.g., Diamond-Stanic et al.2009).
In order to speculate a little bit more on this final interpretation, we try to accommodate the observed source in the model framework recently drawn in Wu et al.(2012) and
Luo et al.(2015) and further discussed with medium resolution
optical observation of WELQ by Plotkin et al. (2015) with
ESO-XSHOOTER. According to the proposed model(see the sketch in Figure 18 of Luo et al. 2015) the accretion disk of
WELQ is geometrically thick and significantly puffed due to the high accretion rate (see also Shemmer et al. 2010). The
puffed portion of the disk blocks X-Rays and the ionizing continuum, produced in the nucleus, from reaching the broad line region, resulting in the observed weak line emission. Various scenarios for WELQ(also for their X-Ray properties) can therefore be explained by varying the angle of view as clearly depicted in Luo et al.(2015). In the case of 0040–0915,
the X-Ray data seems to be consistent(see Figure5) with those
of normal quasars(∼1045erg cm−2s−1Å−1, see, e.g., Macca-caro et al.1991) . According to Figure 9 in Wu et al. (2012)
and Figure 18 in Luo et al.(2015), when the source is viewed
through the shielding gas coming from the puffed disk the X-Ray luminosity is significantly dimmed. Otherwise, a weak-line quasar with X-ray normal luminosity is seen. In the case of 0040–0915, the X-Ray flux does not appear to be absorbed, suggesting that the source is viewed far away from the shielding gas.
We thank the anonymous referee for a careful review of our manuscript that allowed us to greatly improve the presentation of our work. We are also grateful to Dr. John Telting and all the technicians and the astronomers at the Nordic Optical Telescope for support during commissioning and for the acquired observa-tions that this paper refers to. The authors would also like to thank Dr. Thomas Fäcke and Dr. Enrico Orselli(Bayer MaterialScience AG) for providing the custom photopolymeric film for the grating manufacturing. This work was partly supported by the European Community(FP7) through the OPTICON project (Optical Infrared Co-ordination Network for astronomy).
REFERENCES
Berneth, H., Bruder, F.-K., Fäcke, T., et al. 2013,Proc. SPIE,877603-3, 8776 Böttcher, M., & Dermer, C. D. 2002,ApJ,564, 86
Calderone, G., Ghisellini, G., Colpi, M., & Dotti, M. 2013,MNRAS,431, 210 Cavaliere, A., & D’Elia, V. 2002,ApJ,571, 226
Collinge, M. J., Strauss, M. A., Hall, P. B., et al. 2005,AJ,129, 2542 Diamond-Stanic, A. M., Fan, Xiaohui., Brandt, W. N., et al. 2009,ApJ,699, 782 Fan, X., Strauss, M. A., Richards, G. T., et al. 2006,AJ,131, 1203 Farina, E. P., Falomo, R., Decarli, R., Treves, A., & Kotilainen, J. K. 2013,
MNRAS,429, 1267
Francis, P. J., Hewett, P. C., Foltz, C. B., et al. 1991,ApJ,373, 465 Ghisellini, G., & Madau, P. 1996,MNRAS,280, 67G
Ghisellini, G., & Tavecchio, F. 2009,MNRAS,397, 985 Ghisellini, G., & Tavecchio, F. 2015,MNRAS,448, 1060
Ghisellini, G., Tavecchio, F., Foschini, L., et al. 2012,MNRAS,425, 1371 Ghisellini, G., Tavecchio, F., Foschini, L., & Ghirlanda, G. 2011,MNRAS,
414, 2674
Giommi, P., Colafrancesco, S., Padovani, P., et al. 2009,A&A,508, 107G Giommi, P., Padovani, P., Polenta, G., et al. 2012,MNRAS,420, 2899G Kellermann, K. I., Sramek, R., Schmidt, M., Shaffer, D. B., & Green, R. 1989,
AJ,98, 1195
Landoni, M., Falomo, R., Treves, A., et al. 2013,AJ,145, 114L
Landoni, M., Falomo, R., Treves, A., & Sbarufatti, B. 2015, A&A, 570, 126
Lane, R. A., Shemmer, O., Diamond-Stanic, A. M., et al. 2011,ApJ, 743, 163
Leipski, C., Meisenheimer, K., Walter, F., et al. 2014,ApJ,785, 154 Luo, B., Brandt, W., Hall, P. B., et al. 2015,ApJ,805, 122
Maccacaro, T., della Ceca, R., Gioia, I. M., et al. 1991,ApJ,374, 117 Maraschi, L., Ghisellini, G., Della Ceca, R., & Tavecchio, F. 2010, ASPC,
427, M22
Meusinger, H., & Balafkan, N. 2014,A&A,568, A114
Padovani, P., Giommi, P., Landt, H., & Perlman, E. S. 2007, ApJ, 662, 182P
Peterson, B. M. 1997, An Introduction to Active Galactic Nuclei(Cambridge, New York: Cambridge Univ. Press)
Plotkin, R. M., Anderson, S. F., Brandt, W. N., et al. 2010,AJ,139, 390P Plotkin, R. M., Shemmer, O., Trakhtenbrot, B., Anderson, S. F., &
Brandt, W. N. 2015,ApJ,805, 123
Prochaska, J. X., Hennawi, J. F., & Herbert-Fort, S. 2008,ApJ,675, 1002 Rector, T. A., Stocke, J. T., Perlman, E. S., Morris, S. L., & Gioia, I. M. 2000,
AJ,120, 1626R
Richards, G. T., Lacy, M., Storrie-Lombardi, L. J., et al. 2006, ApJSS, 166, 470
Sbarufatti, B., Treves, A., Falomo, R., et al. 2006,AJ,129, 559S Schneider, D. P., Hartig, G. F., Jannuzi, B. T., et al. 1993,ApJSS,87, 45 Shakura, N. I., & Sunjaev, R. A. 1973, A&A,24, 337
Shaw, M. S., Romani, R. W., Cotter, G., Healey, S. E., & Michelson, P. F. 2013,ApJ,764, 135S
Shemmer, O., Trakhtenbrot, B., Anderson, S. F., et al. 2010, ApJL, 722, L152
Steidel, C. C., Erb, D. K., Shapley, A. E., et al. 2010,ApJ,717, 289 Urry, C. M., & Padovani, P. 1995,PASP,107, 803
Vanden Berk, D. E., Richards, G. T., Bauer, A., et al. 2001,AJ,122, 549 Wu, J., Brandt, W. N., Anderson, S. F., et al. 2012,ApJ,747, 10
Zanutta, A., Bianco, A., Insausti, M., & Garzòn, F. 2014b, Proc. SPIE, 91515X-1, 9151