Health-related quality of life and functional changes in DMD:
A 12-month longitudinal cohort study
Sonia Messina
a,b,1, Gian Luca Vita
b,1, Maria Sframeli
b,1, Stefania Mondello
a, Elena Mazzone
c,
Adele D’Amico
d, Angela Berardinelli
e, Matteo La Rosa
a, Claudio Bruno
f,
Maria Grazia Distefano
a, Giovanni Baranello
g, Costanza Barcellona
a, Marianna Scutifero
h,
Sonia Marcato
i, Arianna Palmieri
i, Luisa Politano
h, Lucia Morandi
g, Tiziana Mongini
j,
Elena Pegoraro
i, Maria Grazia D’Angelo
k, Marika Pane
c, Carmelo Rodolico
a, Carlo Minetti
f,
Enrico Bertini
d, Giuseppe Vita
a,b, Eugenio Mercuri
c,*
aDepartment of Neurosciences, University of Messina, Messina, Italy bNemo Sud Clinical Center for Neuromuscular Diseases, Messina, ItalycDepartment of Paediatric Neurology, Catholic University, Rome, Italy
dUnit of Neuromuscular and Neurodegenerative Disorders, Laboratory of Molecular Medicine, Bambino Gesu’ Children’s Research Hospital, Rome, Italy eIRCCS “C.Mondino” Institute, Unit of Child Neuropsychiatry, University of Pavia, Pavia, Italy
fNeuromuscular Disease Unit, G. Gaslini Institute, Genoa, Italy
gMuscle Pathology and Neuroimmunology and Developmental Neurology Unit, Neurological Institute “Carlo Besta”, Milan, Italy hDepartment of Experimental Medicine, Cardiomyology and Medical Genetics, Second University of Naples, Naples, Italy
iDepartment of Neurosciences, University of Padua, Padua, Italy jNeuromuscular Center, SG. Battista Hospital, University of Turin, Turin, Italy
kIRCCS E Medea Bosisio Parini Neuromuscular Unit, Department of Neurorehabilitation, Bosisio Parini, Italy Received 31 July 2015; received in revised form 21 January 2016; accepted 25 January 2016
Abstract
In Duchenne muscular dystrophy (DMD) little has been reported on the association between clinical outcome measures and patient health-related quality of life (HRQOL) tools. Our study evaluated the relationship between 12 month changes on the Generic Core Scales (GCS), the
Multidimensional Fatigue Scale and the Neuromuscular Module of the PedsQLTM
with several outcome measures (6 minute walk test, North Star Ambulatory Assessment and timed items) in ambulatory DMD. Ninety-eight ambulatory DMD in a multicentric setting were included in the study. At baseline, the PedsQLTM
inventories correlated with almost all the functional measures On the Child Self-Report there was a significant decrease
between baseline and 12 months on the PedsQLTMGCS and its first domain, in parallel with the decrement in the functional outcome measures.
Correlation between the 12 month changes on the PedsQLTMinventories and functional measures were almost all negligible. Similar results were
obtained on the Parent Proxy-Report.
In conclusion, PedsQLTMcorrelates with the level of impairment at baseline, but this does not hold true when 12 month changes are considered.
Further studies comparing different tools are needed to better elucidate the complexity of the relationship between HRQOL and functional performances.
© 2016 The Authors. Published by Elsevier B.V. This is an open access article under the CC BY-NC-ND license (http://creativecommons.org/
licenses/by-nc-nd/4.0/).
Keywords: Duchenne muscular dystrophy; Quality of life; Outcome measures; PedsQLTM
1. Introduction
In the last few years promising new therapies for Duchenne muscular dystrophy (DMD), including nonsense mutation suppression via stop codon read through and exon skipping via antisense oligonucleotides, have been introduced into registration-directed international multicentre investigational drug clinical trials. Safety and efficacy trials have involved both ambulatory and * Corresponding author. Department of Child Neurology, Policlinico
Gemelli, Largo Gemelli, 00168 Roma, Italy. Tel.:+39 06 30155340; fax: +39 06 30154363.
E-mail address:[email protected](E. Mercuri). 1 These authors equally contributed.
http://dx.doi.org/10.1016/j.nmd.2016.01.003
0960-8966/© 2016 The Authors. Published by Elsevier B.V. This is an open access article under the CC BY-NC-ND license (http://creativecommons.org/ licenses/by-nc-nd/4.0/).
Available online atwww.sciencedirect.com
Neuromuscular Disorders 26 (2016) 189–196
www.elsevier.com/locate/nmd
ScienceDirect
nonambulatory subgroups of DMD populations [1–6], even though most of the recent and ongoing studies focus on the ambulatory phase[7–9]. The 6 minute walk test (6MWT) has been recently chosen as the primary outcome measure in both international multicentre investigational drug clinical trials and longitudinal natural history studies in DMD ambulant patients
[7–13]. It provides an integrated global assessment of ambulatory function that is influenced by decreased lower extremity strength, biomechanical inefficiencies during gait, diminished endurance, and compromised cardio-respiratory status[14]. Functional scales, such as the North Star Ambulatory Assessment (NSAA), represent an ideal additional tool to the 6MWT, as they provide information on a wider spectrum of functions that reflect everyday life activities
[15]. We have recently reported data from multicentric longitudinal studies in ambulant DMD boys, describing the changes on both 6MWT and NSAA and providing cut-off values to predict the risk of losing ambulation within 12, 24 and 36 months[10–12].
There has been an increasing pressure from regulatory authorities to include health-related quality of life (HRQOL) assessments in order to test the impact of possible functional changes on activities of daily living and more generally, on patient’s quality of life. The Paediatric Quality of Life Inventory with its Generic Core Scales (PedsQLTM
GCS) is the most used tool to assess quality of life in clinical studies and a specific module for neuromuscular disorders, the PedsQLTM Neuromuscular Model (PedsQLTM
NMM), has been validated in DMD and spinal muscular atrophy (SMA)[16,17].
The PedsQLTM
Multidimensional Fatigue Scale (PedsQLTM MFS) was designed as a child self-report and parent proxy-report generic symptom-specific instrument to measure fatigue in pediatric patients[18]and has never been used in neuromuscular disorders.
A few studies have recently reported the use of these modules in DMD cohorts[19–21], but little has been reported on if and how the PedsQLTM scores change in relation to longitudinal changes on the functional measures commonly used in therapeutic trials and clinical practice, such as the 6MWT and NSAA[21].
The aim of our study was to assess if 12 month changes in function, assessed by 6MWT, NSAA, 10 meter timed walk/run and Gowers test, were associated to changes on HRQOL tools in a large cohort of ambulant DMD boys. In order to assess possible differences among the most commonly used HRQOL tools we used the PedsQLTMGCS, the PedsQLTMMFS and the PedsQLTM NMM, both in the Child Self-Report and Parent Proxy-Report.
2. Subjects and methods
The study is a prospective longitudinal multicentric cohort study involving patients recruited from 10 tertiary neuromuscular centers in Italy and followed for at least one year.
Patient inclusion criteria were:
(i) genetically proven DMD diagnosis, aged between 5 and 13 years. The age of 5 as lower limit was chosen as both 6MWT and NSAA have been validated from this age and the upper limit of 13 years as we wished to select a
population similar to that included in most of the current clinical trials in DMD.
(ii) still ambulant and able to walk independently for at least 75 meters, and
(iii) without severe or moderate learning difficulties or behavioral problems, that could affect compliance or the level of performance.
All consecutive patients attending the 10 participating centers who fulfilled the inclusion criteria were enrolled in the study. As part of this study, all centers performed the NSAA followed by the 6MWT at each visit. As we wished to obtain the best compliance in the functional assessments also in younger patients, the PedsQLTMmodules were filled in after the functional tasks at variance with the administration guideline suggestions. A research assistant assisted the younger children (5–7 years) in completing the questionnaires and was available to assist the older group if needed. Data were collected at baseline and at 12-month follow-up assessment.
This study is part of a longer longitudinal study on 6MWT and NSAA in DMD involving the same centers[10–12,22,23]. Details of the training for the participants and of the interobserver reliability for measures among the centers have already been reported in our previous studies[22,23].
2.1. Standard protocol approvals, registrations and patient consents
The study was approved by the ethical committee of each center. Written informed consent was obtained from participants. 2.1.1. PedsQLTM
In order to assess the suitability of the different PedsQLTM modules in DMD, we used the Italian version not only of the general module (PedsQLTM GCS), but also of the dedicated module for neuromuscular disorders (PedsQLTMNMM) and of the PedsQLTMMultidimensional Fatigue Scale (MFS). We also separately analyzed the results of the first domain of each module (respectively: Physical Function Score, General Fatigue Scale, About My Neuromuscular Disease), as they are supposed to be more related to patient functional status[20].
The PedsQLTMis a modular instrument designed to measure HRQOL in children and adolescents aged 2–18 years. The 23 − item PedsQLTM 4.0 GCS encompasses: (1) Physical Functioning (8 items), (2) Emotional Functioning (5 items), (3) Social Functioning (5 items) and (4) School Functioning (5 items). The 18-item PedsQLTM MFS was designed to measure fatigue in pediatric patients and comprises the General Fatigue Scale (6 items), Sleep/Rest Fatigue Scale (6 items), and Cognitive Fatigue Scale (6 items). The 25-item PedsQLTM
3.0 NMM encompasses 3 Scales: (1) About My/My Child’s Neuromuscular Disease (17 items), (2) Communication (3 items) and 3) About Our Family Resources (5 items). The PedsQLTM
NMM young child form (5–7 years) does not contain the Communication and About Our Family Resources Scales.
All three inventories include parallel Child Self-Report and Parent Proxy-Report formats for children aged 5–18 years. The versions for patients between 5 and 7 years have 3-choice
answers, the other versions have 5 choices answers. The instructions, Likert response scale, and scoring method for the PedsQLTM
modules are identical. For each item the score can vary between 0 and 4. Items are linearly transformed to a 0 to 100 scale (0= 100, 1 = 75, 2 = 50, 3 = 25 and 4 = 0), with higher scores indicating better HRQOL.
2.1.2. 6MWT
6MWT was performed in all DMD ambulant boys older than 5 years using a modified version of the American Thoracic Society guidelines for the test[24]. Modifications include the addition of continuous encouragement from the testing staff, and a “safety chaser” to walk along behind the subject during testing. The test is generally completed within 15–20 minutes. Suitability and interrater and intrarater reliability in DMD for the 6MWT have already been reported[14,23,25].
2.1.3. NSAA
The scale consists of 17 items, ranging from standing (item 1) to running (item 17) and includes several items assessing abilities that are necessary to remain functionally ambulant. Each item can be scored on a 3 point scale using simple criteria: 2 – Normal, achieves goal without any assistance; 1 – Modified method, but achieves goal independent of physical assistance from another person; 0 – Unable to achieve independently. The score can range from 0, if all the activities are failed, to 34, if all the activities are achieved. The scale is generally completed in a maximum of 15 minutes.
2.1.4. Timed items
The NSAA also includes the possibility to record timed items (10 meter timed walk/run test and time to rise from the floor or Gowers test) [22]. The time taken to complete these tasks is not part of the score, but provides an additional measure that can be monitored over time. In children who were or became unable to perform these tasks, conventionally a time
equal to the worst performance in the group was subjectively given to indicate poor performance [10]. Reliability of the NSAA and timed items in the same multicentric setting has already been tested with positive results[22].
2.1.5. Statistical analysis
Continuous variables are presented as mean± standard deviation (SD) and categorical variables as frequencies and percentages. Paired t-tests were used for comparisons of the measures across time (baseline and 12 months). Delta of the measure evaluations were calculated as the difference between 12 month and baseline data. The relation between the PedsQLTM
and functional data was assessed by bivariate correlations (Pearson’s correlations). All hypothesis tests conducted were 2-tailed. A p value< 0.05 was considered statistically significant. Statistical analyses were performed using SAS (SAS version [9.2] of the SAS System. Copyright © 2002–2008 by SAS Institute Inc., Cary, NC, USA).
3. Results
One hundred and seven patients fulfilled the inclusion criteria and participated in the study, but 9 patients were lost at follow-up. Ninety-eight patients (mean age= 8.4 years, SD 2.29) had both baseline and follow-up data and were included in the analysis. Forty-three patients were aged 7 years or below. Within the year when the study was performed, 9 of the 98 patients lost the ability to complete the 6MWT and timed items and were included in the analysis with a result equal to the worst performance in the group. All the tests were performed safely without any major fall during the assessments.
3.1. Baseline data
Descriptive statistics for PedsQLTM
Child Self-Report, Parent Proxy-Report and functional data at baseline are shown inTables 1 and 2.
Table 1
Descriptive statistics for PedsQLTMChild Self-Report and Parent Proxy-Report data at baseline and at 12 month follow-up. Mean (±SD).
Children Parents
Baseline 12 months p Baseline 12 months p
PedsQLTMGeneric Core Scales (GSC) 74.5 (±15.8) 71.5 (±16.3) *0.04 68.3 (±14.2) 64.6 (±15.8) ***0.0008 PedsQLTMGSC – 1° domain (Physical Function Score) 68.9 (±21.9) 64.4 (±21.1) *0.03 61.5 (±19.0) 58.5 (±20.8) 0.09 PedsQLTMMultidimensional Fatigue Scale (PedsQL MFS) 76.3 (±17.4) 76.3 (±15.2) 0.89 79.0 (±13.2) 74.2 (±17.5) **0.002 PedsQLTMMFS – 1° domain (General Fatigue Scale) 75.9 (±21.1) 73.7 (±18.5) 0.29 71.6 (±18.7) 66.8 (±19.1) **0.005 PedsQLTMNeuromuscular Module (NMM) 81.4 (±12.8) 81.2 (±13.3) 0.77 75.8 (±15.6) 71.3 (±16.6) ***0.0005 PedsQLTMNMM – 1° domain (About My Neuromuscular Disease) 82.3 (±10.7) 81.2 (±13.2) 0.77 81.4 (±12.3) 78.5 (±12.9) **0.005 p significant values in bold. *p< 0.05, **p < 0.01, ***p < 0.001 or above.
Table 2
6 minute walk test (6MWT), North Star Ambulatory Assessment (NSAA), 10 meter timed walk/run test (10 meter) and Gowers test data at baseline, at 12 month follow-up and changes over 12 months (Delta). Mean (±SD, range).
Baseline 12 Months DELTA p
6MWT (m) 383.8 (±88.9, 119.5–546.2) 345.5 (±139.8, 0–563) −38.3 (±82.6, −285–184.5) ***<0.0001 North Star Ambulatory Assessment Score (34/34) 24.2 (±6.8, 4–34) 21.6 (±9.1, 0–34) −2.6 (±4.7, −14.7–12) ***<0.0001 10 meter timed walk/run test (s) 7.4 (±2.6, 3.6–17.4) 8.9 (±5.4, 2–24) 1.5 (±3.8, −5.4–14.9) ***0.0009
Gowers test (s) 8.0 (±6.8, 1.41–27) 11.8 (±10.7, 2–31) 3.8 (±6.2, −3.6–29.6) ***<0.0001
3.2. Correlations between PedsQLTM
and functional data at baseline
3.2.1. PedsQLTMchild self−report
At baseline the PedsQLTM
GCS and the GCS-first domain, The GSC-Physical Function Score, correlated with age and all the functional measures with the strongest correlation found with Gowers test. The PedsQLTM
MFS correlated with Gowers test and 6MWT and its first domain, the MFS-General Fatigue Scale, with 6MWT only. The PedsQLTM
NMM correlated with all the functional measures with the exception of NSAA and its first domain, PedsQLTM
NMM-About My Neuromuscular Disorder, did not show any significant correlation. All the other correlations were not significant. Details inTable 3.
3.2.2. PedsQLTMparent proxy-report
At baseline the PedsQLTM GCS and the GCS-first domain correlated with age and all the functional measures with the strongest correlations found between GCS-Physical Function Score and NSAA, Gowers test and 6MWT.
Both the PedsQLTMMFS and the MFS-first domain correlated with 6MWT.
The PedsQLTMNMM correlated with 10 meter and 6MWT and its first domain, the PedsQLTMNMM-About My Neuromuscular Disease, correlated with all outcome measures, with the strongest correlation with 6MWT. All the other correlations were not significant. Details inTable 3.
3.3. Longitudinal data
On the Child Self-Report scores there was a significant decrease between baseline and 12 months in the PedsQLTM GCS and its first domain (GSC-Physical Function Score). All the other inventories did not significantly differ between baseline and 12 months (Table 1).
On the Parent Proxy-Report there was a significant decrease between baseline and 12 months on all tools with the exception of the GCS – Physical Function Score (Table 1).
All the selected functional outcome measures detected a significant decline in function over the 12-month period (Table 2). The decline was more obvious in the subgroup of boys above the age of 7 years (p< 0.001), as the younger ones did not shown a significant difference over the 12-month period, with several patients showing an improvement in all the selected outcome measures. Significant correlations were found between baseline values and the 12-month changes of functional scales
[10].
3.4. Correlation of 12 month changes 3.4.1. PedsQLTMchild self-report
The correlation between the 12 month changes on the PedsQLTMGCS and the other PedsQLTMtools were all significant with the strongest correlation with its first domain (PedsQLTM GCS-Physical Function Score) r= 0.64, p = < 0.0001.
Table 3
Correlations between PedsQLTMChild Self- and Parent Proxy-Report and age and functional measures at baseline.
Age NSAA 10 meters Gowers test 6MWT
Baseline child self-report
PedsQLTMGeneric Core Scales (GSC) r= −0.33
**p< 0.001 r= 0.26 *p= 0.01 r= −0.26 **p= 0.009 r= −0.43 ***p< 0.0001 r= 0.27 **p= 0.008 PedsQLTMGSC – 1° domain (PFS) r= −0.36 ***p= 0.0004 r= 0.32 **p= 0.002 r= −0.34 ***p= 0.0007 r= −0.41 ***p< 0.0001 r= 0.25 *p= 0.02
PedsQLTMMultidimensional Fatigue Scale (PedsQLTMMFS) r= −0.04 p= 0.68 r= 0.20 p= 0.06 r= −0.18 p= 0.09 r= −0.21 **p= 0.04 r= 0.23 *p= 0.02 PedsQLTMMFS – 1° domain (GFS) r= 0.11 p= 0.31 r= 0.14 p= 0.17 r= −0.16 p= 0.13 r= −0.17 *p= 0.1 r= 0.26 *p= 0.01 PedsQLTMNM r= −0.10 p= 0.30 r= 0.18 p= 0.07 r= −0.24 *p= 0.02 r= −0.26 *p< 0.01 r= 0.20 *p= 0.04 PedsQLTMNM – 1° domain r= −0.02 p= 0.88 r= 0.15 p= 0.14 r= −0.16 p= 0.12 r= −0.18 p= 0.08 r= 0.13 p= 0.22 Baseline parent proxy-report
PedsQL Generic Core Scales (GSC) r= −0.34
***p= 0.0007 r= 0.36 ***p= 0.0004 r= −0.31 **p= 0.002 r= −0.36 ***p= 0.0002 r= 0.36 ***p= 0.0003 PedsQL GSC – 1° domain (PFS) r= −0.30 **p= 0.003 r= 0.43 ***p< 0.0001 r= −0.39 ***p< 0.0001 r= −0.45 ***p< 0.0001 r= 0.49 ***p< 0.0001
PedsQL Multidimensional Fatigue Scale (PedsQL MFS) r= −0.03 p= 0.77 r= 0.18 p= 0.08 r= −0.16 p= 0.13 r= −0.12 p= 0.25 r= 0.27 **p= 0.006 PedsQL MFS – 1° domain (GFS) r= −0.02 p= 0.9 r= 0.16 p= 0.12 r= −0.16 p= 0.13 r=−0.14 p= 0.18 r= 0.26 **p= 0.009 PedsQL NM r= −0.05 p= 0.6 r= 0.15 p= 0.13 r= −0.25 *p= 0.01 r= −0.15 p= 0.15 r= 0.21 *p= 0.04 PedsQL NM – 1° domain r= −0.17 p= 0.1 r= 0.38 ***p= 0.0001 r= −0.35 ***p= 0.0004 r= −0.29 **p= 0.0001 r= 0.46 ***p< 0.0001
The correlation between the 12 month changes on the PedsQLTM inventories and the functional measures were all negligible with the exceptions of the PedsQLTM
MFS with 10 meter timed walk/run test and PedsQLTM
NMM-About My Neuromuscular Disease and Gowers test.
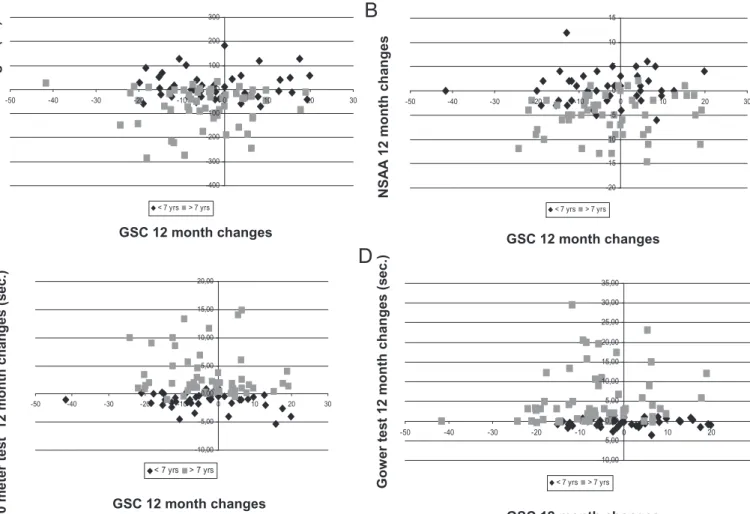
A correlation with age was shown for some of the inventories (Table 4).Fig. 1shows as example the distribution of individual changes on PedsQLTM
GCS and functional scales. When we considered the subgroup of patients above the age of 7, the correlation between the 12 month changes on the PedsQLTM
inventories and the functional measures were also all negligible with the exceptions of the 12 month changes on PedsQLTM
MFS and 6MWT (r= 0.24, p = 0.01). In this subgroup, a correlation with age was shown for some of the inventories (PedsQLTM NMM, r= 0.27, p = 0.004; PedsQLTM NMM-About My Neuromuscular Disease, r= 0.36, p = 0.0001). 3.4.2. PedsQLTMparent proxy-report
The correlation between the 12 month changes on the PedsQLTMGCS and the other PedsQLTMtools were all significant with the strongest correlation with its first domain: vs PedsQLTM GCS-Physical Function Score, r= 0.64, p = < 0.0001.
The correlation between the 12 month changes on the PedsQLTM
inventories and the functional measures were all negligible with the exceptions of PedsQLTM
GCS-Physical Function Score and NSAA and the MFS-General Fatigue Scale and age, 10 meter timed walk/run test and 6MWT. A correlation with age was shown only for the PedsQLTM
NMM (Table 4). When we considered the subgroup of patients above the age of 7, the correlation between the 12 month changes on the
PedsQLTMinventories and the functional measures were also all negligible with the exceptions of the 12 month changes on PedsQLTM
GCS-Physical Function Score and Gowers test (r= 0.23, p = 0.01) and between PedsQLTM
MFS and 6MWT (r= 0.25, p = 0.01).
A correlation with age was shown for some of the inventories (PedsQLTM
MFS-General Fatigue Scale, r= 0.23, p = 0.01, PedsQLTM
NMM, r= 0.28, p = 0.003; PedsQLTM
NMM-About My Neuromuscular Disease, r= 0.38, p = 0.0001).
4. Discussion
The use of relatively new functional outcome measures in clinical trials in boys with DMD has highlighted the need to better understand how changes in these measures relate to quality of life. In the last few years there has therefore been increasing interest to identify HRQOL tools to be included as a secondary outcome measures in clinical trials in children with DMD. Although HRQOL measurements have been increasingly acknowledged as essential health outcome measures in clinical trials, the available pediatric tools are very scanty and the choice is even poorer if we look for disease-specific measures. Generic pediatric HRQOL instruments have been widely used in several disorders. They have the advantage that they enable comparisons across pediatric populations and facilitate benchmarking with healthy population norms. Disease-specific measures on the other hand have the advantage of enhancing measurement sensitivity for health domains germane to a particular chronic health condition. The PedsQLTM
is a versatile instrument widely used in children with chronic diseases[26]. Several disease-specific modules have also Table 4
Correlations of delta outcome measures.
Age NSAA 10 meters Gowers test 6MWT
Delta child self-report
PedsQLTMGeneric Core Scales (GSC) r= −0.10
p= 0.33 r= −0.03 p= 0.75 r= −0.13 p= 0.22 r= −0.04 p= 0.72 r= 0.06 p= 0.58 PedsQLTMGSC – 1° domain (Physical Function Score) r= −0.01
p= 0.89 r= 0.09 p= 0.37 r= −0.17 p= 0.11 r= −0.03 p= 0.75 r= −0.03 p= 0.81 PedsQLTMMultidimensional Fatigue Scale (PedsQLTMMFS) r= −0.15
p= 0.15 r= 0.02 p= 0.83 r= −0.22 *p= 0.03 r= −0.09 p= 0.38 r= 0.002 p= 0.98 PedsQLTMMFS – 1° domain (General Fatigue Scale) r= −0.31
**p= 0.003 r= 0.03 p= 0.75 r= 0.05 p= 0.63 r= 0.02 p= 0.86 r= 0.09 p= 0.38
PedsQLTMNeuromuscular Module (NM) r= −0.21
*p= 0.04 r= 0.03 p= 0.75 r= −0.07 p= 0.47 r= −0.18 p= 0.08 r= 0.02 p= 0.87 PedsQLTMNM – 1° domain (About My Neuromuscular Disease) r= −0.35
***p= 0.0005 r= 0.09 p= 0.37 r= −0.14 p= 0.18 r= −0.22 *p= 0.03 r= 0.05 p= 0.64 Delta parent proxy-report
PedsQL Generic Core Scales (GSC) r= −0.08
p= 0.44 r= 0.03 p= 0.77 r= −0.11 p= 0.31 r= −0.02 p= 0.82 r= 0.05 p= 0.65 PedsQL GSC – 1° domain (Physical Function Score) r= −0.15
p= 0.15 r= 0.22 *p= 0.03 r= −0.19 p= 0.06 r= −0.13 p= 0.1 r= 0.19 p= 0.057 PedsQL Multidimensional Fatigue Scale (PedsQL MFS) r= −0.07
p= 0.49 r=−0.03 p= 0.74 r= −0.09 p= 0.38 r= −0.05 p= 0.64 r= −0.01 p= 0.93 PedsQL MFS – 1° domain (General Fatigue Scale) r= −0.24
*p= 0.02 r= 0.14 p= 0.18 r= −0.21 *p= 0.04 r= −0.1 p= 0.34 r= 0.26 *p= 0.01
PedsQL Neuromuscular Module (NM) r= −0.23
*p= 0.02 r= 0.02 p= 0.87 r= −0.05 p= 0.85 r= 0.08 p= 0.43 r= 0.07 p= 0.5 PedsQL NM – 1° domain (About My Neuromuscular Disease) r= −0.14
p= 0.16 r= 0.02 p= 0.082 r= −0.04 p= 0.69 r= −0.006 p= 0.95 r= 0.09 p= 0.37 p significant values in bold. *p< 0.05, **p < 0.01, ***p < 0.001 or above.
been developed, such as those for asthma, arthritis, cancer, cardiac disease, diabetes. The recent PedsQLTMNMM, originally developed for children with SMA [17], was subsequently also applied in DMD boys, also in comparison with an other DMD version[16,19]. In this study we used both the generic PedsQLTM GCS and the dedicated neuromuscular module. Furthermore, as fatigability is an important issue in DMD boys and is partly recorded by the 6MWT, we also decided to use the fatigability scale, the PedsQLTMMFS. We focused on their global scores and on the first domains, supposed to better relate to functional aspects, this resulting in a choice of 6 measures of HRQOL.
Our results showed that the total scores of PedsQLTMGCS Child Self-Report were between 25.78 and 100 at baseline and between 38.81 and 100 at 12 months with an average of 74.5 and 71 respectively. The average scores in our cohort are lower than those reported for healthy controls in two previous studies (between 87 and 88.8)[16,19], but higher than in their DMD cohorts, as these ranged between 60.4 and 62.7 [16,19]. The results however are not easily comparable because of different inclusion criteria as we included only ambulant boys from the age of 5 and in the first of the two previous studies[16]nearly 90% of the DMD boys were non ambulant and the second focused on the 8–12 years age range[19].
Another difference with previous studies is that by also including younger boys, we were able to compare parents’ and children’s responses in all ambulatory age range. With one exception parents’ responses were always lower than children’s self report both at baseline and at 12 months. These findings confirm and expand previous evidence of poor agreement between parents’ and children’s responses[16,19].
The aim of our study however was not to duplicate previous reports on quality of life in DMD or their correlation with different demographic data or intervention such as steroids, but to establish the value of the questionnaires in assessing changes in HRQOL in relation to possible functional changes. Our results showed that at baseline all the inventories used showed correlations with the functional status. The PedsQLTM
GCS, both as a global scale and the first domain specifically addressing physical function scores (PedsQLTM
GCS – PFS), showed a significant correlation with all the functional measures both on children’s and parents’ versions. The PedsQLTM
MFS had an overall weaker correlation than the PedsQLTM
GCS and in the parents’ questionnaires the correlation was limited to the 6MWT. At variance with previous studies[19–21], we also used the PedsQLTM
NMM, a module specifically devised for patients with NMD and validated in DMD, with selected items thought -400 -300 -200 -100 0 100 200 300 -50 -40 -30 -20 -10 0 10 20 30 < 7 yrs > 7 yrs -10,00 -5,00 0,00 5,00 10,00 15,00 20,00 -50 -40 -30 -20 -10 0 10 20 30 < 7 yrs > 7 yrs GSC 12 month changes
A
B
C
D
6 MW T 1 2 month changes (m.) NS A A 12 month chan ges 10 me ter tes t 12 month ch ange s (sec .) Gow er te st 1 2 month change s (s ec .) GSC 12 month changes GSC 12 month changes GSC 12 month changes -20 -15 -10 -5 0 5 10 15 -50 -40 -30 -20 -10 0 10 20 30 < 7 yrs > 7 yrs -10,00 -5,00 0,00 5,00 10,00 15,00 20,00 25,00 30,00 35,00 -50 -40 -30 -20 -10 0 10 20 30 < 7 yrs > 7 yrsFig. 1. Distribution of individual 12 month changes of PedsQLTMChild Self-Report Generic Core Scales scores versus 6MWT (A), NSAA (B), 10 meter timed walk/run test (10 meter) (C) and Gowers test (D) according to age (≤ or >7 years).
to be more relevant for the disease[16]. Surprisingly, its use did not appear to increase the level of significance compared to the general module with the exception of the first domain, that better correlated with all functional measures in the parents’ questionnaire.
It is of interest that the 6MWT appeared to be the measure that at baseline better correlated with all the inventories.
When we assessed the possible concordance of 12 month changes between PedsQLTM GCS versus its first domain PedsQLTM GCS – PFS and the other PedsQLTMmeasures, we found significant correlations with the strongest correlation with its first domain in both parents’ and children’s versions.
In contrast, the correlation was often not significant between the 12 month changes on the different PedsQLTM tools and the functional assessments. While the functional scores significantly decreased over 12 months, the results of the inventories were more variable. On the Child Self-Report scores, only the GCS and its first domain PedsQLTMGCS – PFS had a significant decrement over 12 months. At variance, on the parents’ version the scores decreased with age and disease progression as previously reported by other studies [19–21]
with the exception of the PedsQLTMGCS – PFS, although this tool is targeted to functional aspects. Even when the mean changes observed on the functional tests and on the inventories were concordant, trending in the same direction, the changes in the two groups of tools did not always happen in the same direction in individual patients (e.g. inFig. 1). As a result, the overall correlation between changes in function and PedsQLTM was, with few exceptions, not significant both in the whole cohort and in the subset of patients above the age of 7 years. Interestingly, in the subset of patients above the age of 7 years we found a correlation between changes in PedsQLTM
MFS and 6MWT both on children’s and parents’ versions. This is not surprising considering that the 6MWT is a measure of endurance and may better reflect fatigability, as also shown in the correlation between PedsQLTM MFS parents’ version and 6MWT at baseline.
The only previous longitudinal study reporting both PedsQLTMparental self-report and functional measures changes in 24 DMD boys with age range similar to our cohort showed a weak correlation at baseline between PedsQLTM GCS and 6MWT and timed items. Thirteen of the 24 also had follow-up assessments and the correlation of the 12 month changes was negligible [21]. Our study, performed in a larger cohort and using additional measures, confirm that 12 month changes in functional measures may not always be reflected on PedsQLTM scores in both children’s and parents’ versions. Both studies suggest that the PedsQLTM
may not be appropriate to mirror the functional changes observed as part of the natural history in DMD, at least in ambulant patients and in the age range included in the two studies (4–12 and 5–13 years).
This is an important point as the PedsQLTM
has already been chosen as a secondary or exploratory outcome measure in many recent and ongoing trials following the need of regulators, families and researchers to add additional measures that would support the clinical meaningfulness of the 6MWT or other primary outcome measures.
In conclusion, our results suggest that the PedsQLTM correlates with the level of impairment in DMD boys between the age of 5 and 13 years, but this does not hold true when 12 month changes are considered. This might be explained by the construct of the questionnaires including, for example in the PedsQLTM
NMM module, a number of questions regarding difficulties in breathing, frequency in illness, communication or family resources, that are unlikely to change in parallel with functional performances, particularly at this disease stage and over 12 months.
Previous studies using other tools, such as the Pediatric Outcomes Data Collection Instrument (PODCI), have shown higher sensitivity to functional changes over 12 months in ambulant DMD compared to PedsQLTM [21]. This difference may be explained by the fact that the PODCI response options address the perceived physical difficulty of activities: e.g. “during the last week has it been easy or hard for your child to walk one block?”, response options include :“easy, a little hard, very hard, can’t do at all”. In contrast, the PedsQLTMresponse in based on self-selected frequency and/or importance: e.g. “In the past one month how much of a problem has your child had with. . .”, response choices include “never, almost never, sometimes, often and almost always”.
Our findings highlight the complexity of the relationship between HRQOL tools and functional measures. Functional changes on the 6MWT and on the NSAA reflect changes on activities of daily living, that are not always addressed by PedsQLTM
and other available HRQOL tools. Furthermore, PedsQLTM
scores reflect also social and emotional aspects that may not parallel to functional changes.
Further studies on longer time frame or using other tools, such as the PODCI and/or specific questionnaires addressing changes in activity of daily living, may help to elucidate to which extend the available pediatric HRQOL tools are capable of mirroring the functional changes and/or eventually to identify new valuable tools.
Acknowledgments
These data were collected in the context of the DMD Italian Network, supported by the Telethon UILDM Grant GUP07009 (to E.M.) and GUP9010 (to S.M.).
References
[1] Blat Y, Blat S. Drug discovery of therapies for Duchenne muscular dystrophy. J Biomol Screen 2015;20:1189–203.
[2] Arechavala-Gomeza V, Khoo B, Aartsma-Rus A. Splicing modulation therapy in the treatment of genetic diseases. Appl Clin Genet 2014;7:245–52.
[3] Shieh PB. Duchenne muscular dystrophy: clinical trials and emerging tribulations. Curr Opin Neurol 2015;28:542–6.
[4] Al-Zaidy S, Rodino-Klapac L, Mendell JR. Gene therapy for muscular dystrophy: moving the field forward. Pediatr Neurol 2014;51:607– 18.
[5] Veltrop M, Aartsma-Rus A. Antisense-mediated exon skipping: taking advantage of a trick from Mother Nature to treat rare genetic diseases. Exp Cell Res 2014;325:50–5.
[6] Bertoni C. Emerging gene editing strategies for Duchenne muscular dystrophy targeting stem cells. Front Physiol 2014;5:148. doi:10 .3389/fphys.2014.00148.
[7] An exploratory study to assess two doses of GSK2402968 in the treatment of ambulant boys with Duchenne muscular dystrophy (DMD). ClinicalTrialsgov. Bethesda, MD: National Library of Medicine.<https:// clinicaltrials.gov/ct2/show/NCT01462292>.
[8] Phase 3 study of ataluren in patients with nonsense mutation Duchenne muscular dystrophy (ACT DMD). Bethesda, MD: National Library of Medicine. <https://clinicaltrials.gov/ct2/show /NCT01826487>. ClinicalTrialsgov.
[9] Mendell JR, Goemans N, Lowes LP, et al. Longitudinal effect of eteplirsen vs. historical control on ambulation in DMD. Ann Neurol 2015; doi:10.1002/ana.24555.
[10] Mazzone E, Vasco G, Sormani MP, et al. Functional changes in Duchenne muscular dystrophy: a 12-month longitudinal cohort study. Neurology 2011;77:250–6.
[11] Mazzone ES, Pane M, Sormani MP, et al. 24 month longitudinal data in ambulant boys with Duchenne muscular dystrophy. PLoS ONE 2013;8(1):e52512. doi:10.1371/journal.pone.0052512.
[12] Pane M, Mazzone ES, Sivo S, et al. Long term natural history data in ambulant boys with Duchenne muscular dystrophy: 36-month changes. PLoS ONE 2014;1(9):e108205. doi:10.1371/journal.pone.0108205.
[13] McDonald CM, Henricson EK, Abresch RT, et al. The 6-minute walk test and other endpoints in Duchenne muscular dystrophy: longitudinal natural history observations over 48 weeks from a multicenter study. Muscle Nerve 2013;48:343–56.
[14] McDonald CM, Henricson EK, Abresch RT, et al. The 6-minute walk test and other clinical endpoints in duchenne muscular dystrophy: reliability, concurrent validity, and minimal clinically important differences from a multicenter study. Muscle Nerve 2013;48:357–68.
[15] Bushby K, Connor E. Clinical outcome measures for trials in Duchenne muscular dystrophy: report from International Working Group meetings. Clin Investig (Lond) 2011;1:1217–35.
[16] Davis SE, Hynan LS, Limbers CA, et al. The PedsQL in pediatric patients with Duchenne muscular dystrophy: feasibility, reliability, and validity of the Pediatric Quality of Life Inventory Neuromuscular Module and Generic Core Scales. J Clin Neuromuscul Dis 2010;11:97–109.
[17] Iannaccone ST, Hynan LS, Morton A, et al. The PedsQL in pediatric patients with Spinal Muscular Atrophy: feasibility, reliability, and validity of the Pediatric Quality of Life Inventory Generic Core Scales and Neuromuscular Module. Neuromuscul Disord 2009;19:805–12.
[18] Varni JW, Limbers CA, Bryant WP, Wilson DP. The PedsQL multidimensional fatigue scale in pediatric obesity: feasibility, reliability and validity. Int J Pediatr Obes 2010;5:34–42.
[19] Uzark K1, King E, Cripe L, et al. Health-related quality of life in children and adolescents with Duchenne muscular dystrophy. Pediatrics 2012;130(6):e1559–66. doi:10.1542/peds.2012-0858.
[20] McDonald CM, McDonald DA, Bagley A, et al. Relationship between clinical outcome measures and parent proxy reports of health-related quality of life in ambulatory children with Duchenne muscular dystrophy. J Child Neurol 2010;25:1130–44.
[21] Henricson E, Abresch R, Han JJ, et al. The 6-minute walk test and person-reported outcomes in boys with duchenne muscular dystrophy and typically developing controls: longitudinal comparisons and clinically-meaningful changes over one year. PLoS Curr 2013;5.
[22] Mazzone ES, Messina S, Vasco G, et al. Reliability of the North Star Ambulatory Assessment in a multicentric setting. Neuromuscul Disord 2009;19:458–61.
[23] Mazzone E, Martinelli D, Berardinelli A, et al. North Star Ambulatory Assessment, 6-minute walk test and timed items in ambulant boys with Duchenne muscular dystrophy. Neuromuscul Disord 2010;20:712– 16.
[24] ATS Committee on Proficiency Standards for Clinical Pulmonary Function Laboratories. ATS statement: guidelines for the six-minute walk test. Am J Respir Crit Care Med 2002;166:111–17.
[25] McDonald CM, Henricson EK, Han JJ, et al. The 6-minute walk test as a new outcome measure in Duchenne muscular dystrophy. Muscle Nerve 2010;41:500–10.
[26] Varni JW, Seid M, Kurtin PS. PedsQLTM 4.0: reliability and validity of the Pediatric Quality of Life Inventory™ Version 4.0 Generic Core Scales in healthy and patient populations. Med Care 2001;39:800– 12.