A snapshot on some everyday actions of a Middle
Pleistocene hominin: the Trackway B at the Devil’s Trails
palaeontological site (Tora e Piccilli, Caserta, Central Italy)
Adolfo PanarelloUniversità degli Studi di Cassino e del Lazio Meridionale, Dipartimento di Scienze Umane, Sociali e della Salute, Laboratorio di Ricerche Storiche e Archeologiche dell’Antichità, Cassino (FR), Italy
e-mail: [email protected]
Summary - ˜ is report aims to give notice of and provide a more detailed dataset and detailed remarks on what can be considered a one-of-a-kind hominin fossil walking pattern: Trackway B of the Foresta ichnological site (Tora e Piccilli, Caserta, Central Italy). Although the site is known since 2003, only recently has the study been performed by means of the newest photogrammetric and experimental techniques of collection, analysis and interpretation of ichnological data. ˜ e results obtained enable us to depict an astonishing movie printed in rock, describing some body features and common moments of the everyday movements of a hominin who lived about 350 ka. In particular, some up-to-now absolutely unique fossil prints of body parts of a Pleistocene hominin (calf, ankle, and gluteus), which have simply been mentioned in the ichnological fossil record, are here quantitatively described for the ÿ rst time. ˜ e data coming from this research will provide scientists with new valuable elements thus far undetected anywhere else in the world.
Keywords - Human ichnology, Fossil footprints, Roccamonÿ na volcano, Morphometric analysis, Homo heidelbergensis.
Introduction
An increasingly multidisciplinary approach and the development of increasingly precise and detailed surveys and techniques of data analysis are giving a decisive contribution to the knowledge of the appearance, cultural level and environments of our ancestors who lived in prehistoric times. In this joint effort, human paleo-ichnology also gives a precious contribu-tion due to its power to record the fossil frames of some movements “frozen” in the rock. These movements, like in a modern crime scene inves-tigation, can be very often contextualized in space and time with great precision, often giving important behavioral information.
Unfortunately, human fossil footprints are very rare and preserved only on soft rocks at high risk of preservation (Bennett et al., 2013). Fossil human footprints currently known in the world are always preserved on subplanar or slightly inclined surfaces, with the only exception of the Foresta site (Tora e Piccilli, Central Italy)
(Bennett & Morse, 2014; Panarello, 2016). Here human fossil footprints, traditionally known as “Devil’s Trails”, previously tentatively attributed to Homo heidelbergensis (Panarello et
al., 2017), but actually not yet precisely
attrib-utable to a specific human species (Panarello et
al., 2020 and references therein), are preserved
on a strongly steep slope of Brown Leucitic Tuff (BLT) which is located on the North-Eastern slope of the Roccamonfina volcano (Mietto et
al., 2003; Avanzini et al., 2008; Scaillet et al.,
2008; Santello, 2010; Panarello, 2016; Panarello
et al., 2017) (Fig. 1). The trampled surface has
been 40Ar/39Ar radiometrically dated at 349±3 ka (Scaillet et al., 2008; Santello, 2010) (Fig. 2a).
The strong inclination of this trampled slope enables scientists to elaborate dynamic models of human gait, that are not possible elsewhere so far (e.g. Saborit et al., 2019).
An extended preliminary report of the fossil footprints and trackways of the “Devil’s Trails” palaeontological site was published by Avanzini
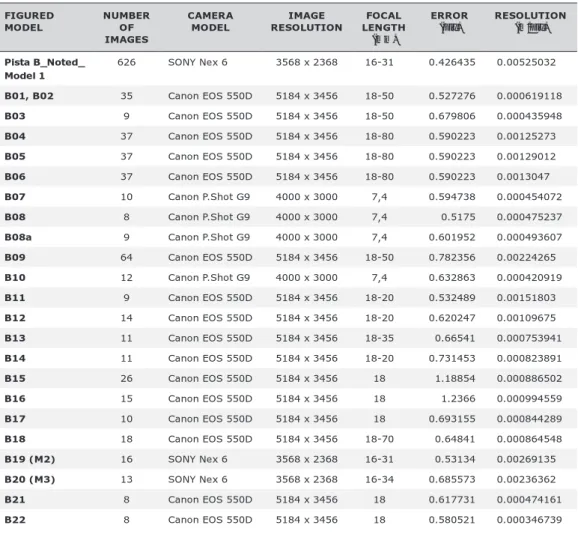
Fig. 2 – Foresta (Tora e Piccilli), “Devil’s Trails” Palaeontological site: view from the East of the tuff-slope along which Trackway B runs (the direction is indicated by red arrows) (a); Southern oblique view of Trackway B (3D generated Photo) (b). The colour version of this fi gure is available at the JASs website.
described in this report the so-called “Trackway B” soon seemed to be particularly interesting (Figs. 2b, 3, 4), because it preserved some uncommon and never previously observed footprints and gait pattern. These footprints were first interpreted as the prints left by a hominin during a long slide
while walking in a quite straight and diagonal descending direction toward South-East. New analyses led by the scientific team of Paolo Mietto (University of Padua) and carried out by means of the most recent and reliable photogrammetric 3D modelling techniques provided new valuable
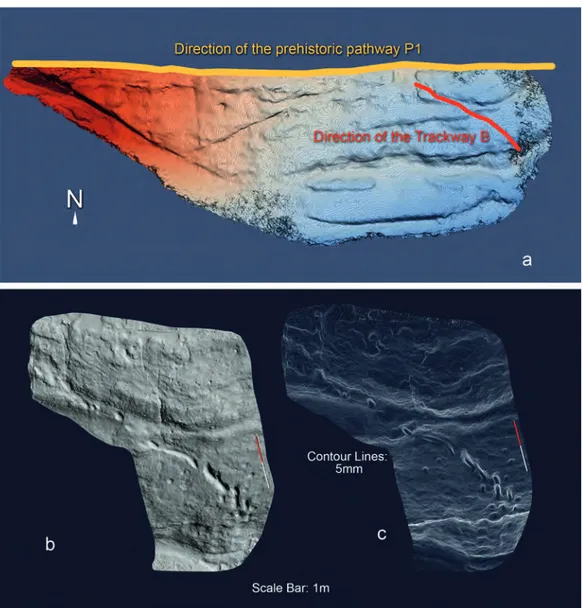
Fig. 3 - 3D generated block surface of the “Devil’s Trails” Palaeontological site: Aerial Southern view of the entire slope [the direction of the prehistoric pathway is marked in yellow from which Trackway B branches off; the direction of Trackway B is marked in red] (a); Zenithal fl at view of the SE area with Trackway B (scale bar= 1m) (b); Contour lines 5 mm (c). The colour version of this fi gure is available at the JASs website.
evidence. These data confirm the first hypotheses and allow a thorough description for the first time of the fossil prints of some human body parts which are elsewhere unknown so far (Mietto et
al., 2003; Avanzini et al., 2008; Panarello et al.,
2018, 2020 and references therein). Methods
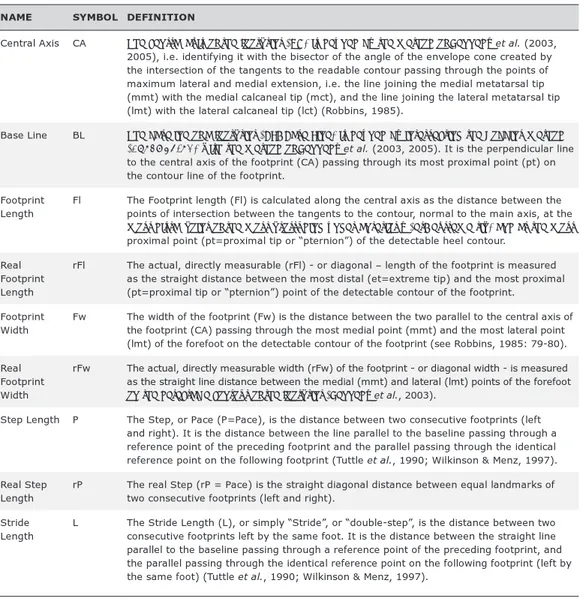
All scientific evidence has been georefer-enced with a Garmin Etrex 10 (accuracy ±3 m) and totally photographed by Canon EOS 550D, Canon PowerShot G9 and Sony NEX 6 cameras. Then all the pictures have been processed with Agisoft Photoscan Pro and detailed 3D models of the general surface and of each structure have been created following the procedures of Mallison & Wings (2014). Each model has been scaled on the basis of a metallic scale-bar. Finally, in respect of the latest scientific protocols (Falkingham et
al., 2018) and according to the procedure of
Belvedere et al. (2013) some detailed contour maps and high-resolution depth maps have been created through Kitware Paraview. Each param-eter of the figured models is shown in Table 1 according to the method of Lockley et al. (2015). The 3D models elaborated for this report are also used in other ongoing research, so their open files will only be made available on spe-cific request. For measurements of lengths and inclinations the following instruments have been used: GemRed digital inclinometer with spirit levels (length: 400 mm; resolution: 0.1; range: 4x90° (0~360°); objective measured error ±0.6°); TACKLife Digital Inclinometer Mini Digital Protractor, mod. MDP02 (accuracy ±0.3°; reso-lution: 0.1; range: 4x90° [0~360°]).
Dimensional conventions
Since best preserved part of the footprints is almost always the heel-strike zone, the most proximal point of the impression (pt) was chosen as the default anatomical landmark for measur-ing gait parameters.
After a careful analysis of the most com-mon and reliable procedures of footprint and
Fig. 4 - Sketch of the general course of Trackway B from its beginning to the verge of the drop of slope with the progression-line (blue dotted line). The colour version of this fi gure is avail-able at the JASs website.
gait analysis, a series of dimensional conven-tions has been created and shown in Table 2 and Figure 5. They seem to be the most reli-able and the most objectively applicreli-able in the case of the tracks preserved along the “Devil’s Trails” Trackway B.
Description and comparison
Trackway B starts at coordinate point WGS 84 N41°19.956’-E14°01.495’, at an altitude of about m. 294 (±3), and ends at coordinate
point WGS 84 N41°19.954’-E14°01.498’, with a difference in level (locally measured) of about 4,15 m.
The general trackway is composed of a total succession of 25 actual prints, 21 of which are footprints left by bare feet. The other fossil traces include a left handprint (TP_M1) (Panarello
et al., 2018), two other possible handprints
(B19, B20, also called M2 and M3) and a last print which could only be interpreted as the imprint left by a right gluteus (B21). The foot-prints of Trackway B are entaxonic, plantigrade, longer than wide, kidney-shaped, regularly and
Tab. 1 - Parameters of the photogrammetric models of Trackway B.
FIGURED
MODEL NUMBER OF IMAGES
CAMERA
MODEL RESOLUTIONIMAGE LENGTHFOCAL (mm) ERROR (pix) RESOLUTION (m/pix) Pista B_Noted_ Model 1 626 SONY Nex 6 3568 x 2368 16-31 0.426435 0.00525032 B01, B02 35 Canon EOS 550D 5184 x 3456 18-50 0.527276 0.000619118 B03 9 Canon EOS 550D 5184 x 3456 18-50 0.679806 0.000435948 B04 37 Canon EOS 550D 5184 x 3456 18-80 0.590223 0.00125273 B05 37 Canon EOS 550D 5184 x 3456 18-80 0.590223 0.00129012 B06 37 Canon EOS 550D 5184 x 3456 18-80 0.590223 0.0013047 B07 10 Canon P.Shot G9 4000 x 3000 7,4 0.594738 0.000454072 B08 8 Canon P.Shot G9 4000 x 3000 7,4 0.5175 0.000475237 B08a 9 Canon P.Shot G9 4000 x 3000 7,4 0.601952 0.000493607 B09 64 Canon EOS 550D 5184 x 3456 18-50 0.782356 0.00224265 B10 12 Canon P.Shot G9 4000 x 3000 7,4 0.632863 0.000420919 B11 9 Canon EOS 550D 5184 x 3456 18-20 0.532489 0.00151803 B12 14 Canon EOS 550D 5184 x 3456 18-20 0.620247 0.00109675 B13 11 Canon EOS 550D 5184 x 3456 18-35 0.66541 0.000753941 B14 11 Canon EOS 550D 5184 x 3456 18-20 0.731453 0.000823891 B15 26 Canon EOS 550D 5184 x 3456 18 1.18854 0.000886502 B16 15 Canon EOS 550D 5184 x 3456 18 1.2366 0.000994559 B17 10 Canon EOS 550D 5184 x 3456 18 0.693155 0.000844289 B18 18 Canon EOS 550D 5184 x 3456 18-70 0.64841 0.000864548 B19 (M2) 16 SONY Nex 6 3568 x 2368 16-31 0.53134 0.00269135 B20 (M3) 13 SONY Nex 6 3568 x 2368 16-34 0.685573 0.00236362 B21 8 Canon EOS 550D 5184 x 3456 18 0.617731 0.000474161 B22 8 Canon EOS 550D 5184 x 3456 18 0.580521 0.000346739
alternately patterned in such a way as to always direct the medial concavity of the plantar arch towards the progression line (Fig. 4).
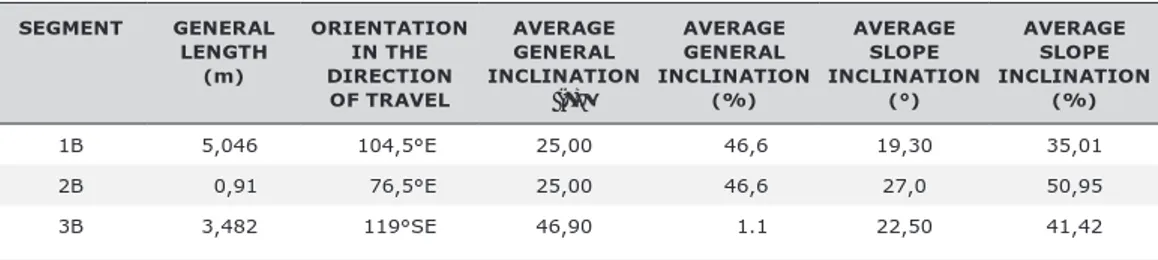
Trackway B (Figs. 2, 3, 4, 11) (from the most proximal point of the footprint B00 to the most distal point of the footprint B22) is ~9,4m long and can be divided into three seg-ments (1B, 2B and 3B). Two of these segseg-ments are fairly straight. In the central part of the
trackway a long fossil slide is preserved. Named as B9, it was created by the sliding of the track-maker’s left bare foot. The curvature of this long slide marks a clear change of direction towards SE. The angle between segments 1B and 3B is ~147° SE. The other general dimensions and characteristics of Trackway B are shown in Table 3. All the other dimensions measured according to the fixed conventions are shown in Tables 3,
Tab. 2 - Dimensional conventions.
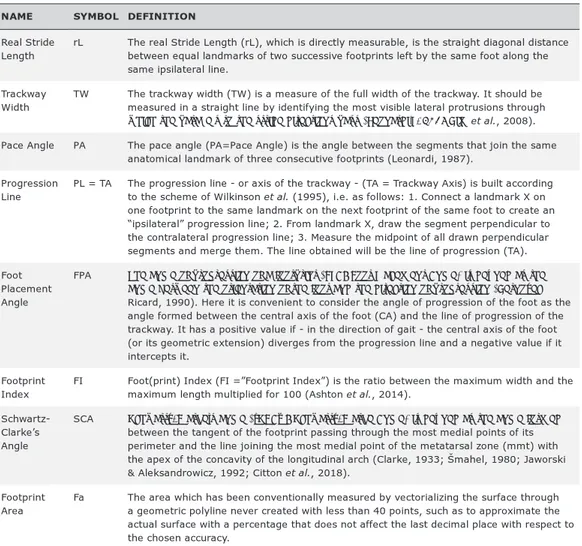
NAME SYMBOL DEFINITION
Central Axis CA The central axis of the footprint (CA) is defi ned by the method of Kennedy et al. (2003, 2005), i.e. identifying it with the bisector of the angle of the envelope cone created by the intersection of the tangents to the readable contour passing through the points of maximum lateral and medial extension, i.e. the line joining the medial metatarsal tip (mmt) with the medial calcaneal tip (mct), and the line joining the lateral metatarsal tip (lmt) with the lateral calcaneal tip (lct) (Robbins, 1985).
Base Line BL The baseline of a footprint (BL=Base Line) is defi ned by intersecting the Robbins method (1985: 67-84) with the method of Kennedy et al. (2003, 2005). It is the perpendicular line to the central axis of the footprint (CA) passing through its most proximal point (pt) on the contour line of the footprint.
Footprint
Length Fl The Footprint length (Fl) is calculated along the central axis as the distance between the points of intersection between the tangents to the contour, normal to the main axis, at the most distal point of the most protruding fi nger anteriorly (et=extreme tip) and at the most proximal point (pt=proximal tip or “pternion”) of the detectable heel contour.
Real Footprint Length
rFl The actual, directly measurable (rFl) - or diagonal – length of the footprint is measured as the straight distance between the most distal (et=extreme tip) and the most proximal (pt=proximal tip or “pternion”) point of the detectable contour of the footprint.
Footprint Width
Fw The width of the footprint (Fw) is the distance between the two parallel to the central axis of the footprint (CA) passing through the most medial point (mmt) and the most lateral point (lmt) of the forefoot on the detectable contour of the footprint (see Robbins, 1985: 79-80). Real
Footprint Width
rFw The actual, directly measurable width (rFw) of the footprint - or diagonal width - is measured as the straight line distance between the medial (mmt) and lateral (lmt) points of the forefoot on the detectable contour of the footprint (Kennedy et al., 2003).
Step Length P The Step, or Pace (P=Pace), is the distance between two consecutive footprints (left and right). It is the distance between the line parallel to the baseline passing through a reference point of the preceding footprint and the parallel passing through the identical reference point on the following footprint (Tuttle et al., 1990; Wilkinson & Menz, 1997). Real Step
Length
rP The real Step (rP = Pace) is the straight diagonal distance between equal landmarks of two consecutive footprints (left and right).
Stride
Length L The Stride Length (L), or simply “Stride”, or “double-step”, is the distance between two consecutive footprints left by the same foot. It is the distance between the straight line parallel to the baseline passing through a reference point of the preceding footprint, and the parallel passing through the identical reference point on the following footprint (left by the same foot) (Tuttle et al., 1990; Wilkinson & Menz, 1997).
4, 5 and 6. An estimation of trackmaker’s stat-ure has been also made by using the method of Fessler et al. (2005). The estimation data are shown in Table 7. The preservation of the foot-prints is non homogeneous. To give an idea of the degree of preservation of the best footprints, two samples have been provided in Figures 6 and 7.
The movements described by the fossil foot-prints of Trackway B are quite uncommon and really singular.
Starting from the oldest human fossil path-way up to now known (Panarello et al., 2017b), which is located on the top of the slope, Trackway B runs quite regularly toward South-East (footprints B00-B05). Between the foot-prints B05-B06 the trackmaker’s foot crosses the progression line. Then the slope becomes steeper and the trackmaker must manage a dan-gerous incline and a sometimes-slippery ground: a very slight footprint (B08) flanking left the footprint B07 suggest that the trackmaker was
NAME SYMBOL DEFINITION Real Stride
Length rL The real Stride Length (rL), which is directly measurable, is the straight diagonal distance between equal landmarks of two successive footprints left by the same foot along the same ipsilateral line.
Trackway Width
TW The trackway width (TW) is a measure of the full width of the trackway. It should be measured in a straight line by identifying the most visible lateral protrusions through which the parallels to the stride directions pass (Leonardi, 1987; Kim et al., 2008). Pace Angle PA The pace angle (PA=Pace Angle) is the angle between the segments that join the same
anatomical landmark of three consecutive footprints (Leonardi, 1987). Progression
Line PL = TA The progression line - or axis of the trackway - (TA = Trackway Axis) is built according to the scheme of Wilkinson et al. (1995), i.e. as follows: 1. Connect a landmark X on one footprint to the same landmark on the next footprint of the same foot to create an “ipsilateral” progression line; 2. From landmark X, draw the segment perpendicular to the contralateral progression line; 3. Measure the midpoint of all drawn perpendicular segments and merge them. The line obtained will be the line of progression (TA). Foot
Placement Angle
FPA The angle of progression of a footprint (FPA=Foot Placement Angle) is defi ned as the angle between the orientation of the foot and the direction of progression (Kernozec & Ricard, 1990). Here it is convenient to consider the angle of progression of the foot as the angle formed between the central axis of the foot (CA) and the line of progression of the trackway. It has a positive value if - in the direction of gait - the central axis of the foot (or its geometric extension) diverges from the progression line and a negative value if it intercepts it.
Footprint Index
FI Foot(print) Index (FI =”Footprint Index”) is the ratio between the maximum width and the maximum length multiplied for 100 (Ashton et al., 2014).
Schwartz-Clarke’s Angle
SCA Schwartz-Clarke’s angle (“SCA” =Schwartz-Clarke Angle) is defi ned as the angle formed between the tangent of the footprint passing through the most medial points of its perimeter and the line joining the most medial point of the metatarsal zone (mmt) with the apex of the concavity of the longitudinal arch (Clarke, 1933; Šmahel, 1980; Jaworski & Aleksandrowicz, 1992; Citton et al., 2018).
Footprint
Area Fa The area which has been conventionally measured by vectorializing the surface through a geometric polyline never created with less than 40 points, such as to approximate the actual surface with a percentage that does not affect the last decimal place with respect to the chosen accuracy.
Fig. 5 - Graphical schemes of the adopted dimensional conventions (Modifi ed from Robbins, 1985; Leonardi, 1987; Tuttle et al., 1990; Kennedy et al., 2003, 2005; Wilkinson et al., 1995; Citton et al., 2017). The colour version of this fi gure is available at the JASs website.
Tab. 3 - General dimensions and characteristics of Trackway B. SEGMENT GENERAL LENGTH (m) ORIENTATION IN THE DIRECTION OF TRAVEL AVERAGE GENERAL INCLINATION (°) AVERAGE GENERAL INCLINATION (%) AVERAGE SLOPE INCLINATION (°) AVERAGE SLOPE INCLINATION (%) 1B 5,046 104,5°E 25,00 46,6 19,30 35,01 2B 0,91 76,5°E 25,00 46,6 27,0 50,95 3B 3,482 119°SE 46,90 1.1 22,50 41,42
able to stand on the right foot for a moment slightly touching the upstream slope with his left foot. After having chosen to cut the slope in an almost diagonal way, the trackmaker went on touching the ground with the right foot and sinking deeply in the soft substrate (B08a). The following step had an unexpected consequence: after having moved forward the trackmaker placed his left foot down (B09) and the ground gave way and made him slip for ~90 cm.
The complexity of this movement and of the following moments can be summarized in as fol-lows. The trackmaker completely loses balance as a consequence of the long slide due to the subsidence of the soft and slippery ground; dur-ing this slide the trackmaker leans over onto his left flank and quickly moves forward, sinking his left hand on the side of the slope and strongly pushing it to give to the body enough impetus to
regain balance (Panarello et al., 2018). During this extremely dynamic movement, the track-maker finds a secure foothold on the right foot and is thus enabled to significantly lengthen and cross the step by supporting the left foot, which creates an extremely deep footprint (B11) (Figs. 8, 9, 10; Tabs. 8, 9).
The dimensional data collected from the fos-sil evidence of the described movement pattern (Tab. 8, Fig. 8) appear fully compatible with those available for the human body (Picasso, 2012). Moreover, they perfectly match the dimensions of a trackmaker who is about 1,50/1,60 m tall, with a left foot about 23 cm long and with a total arm length of about 52 cm.
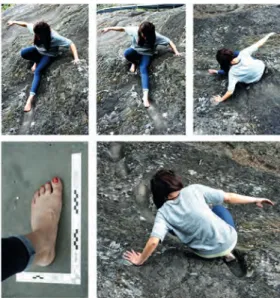
For a simple experimental testing of this dimensions, a re-enactment of the described movements has been done by a present-day female model (F.V.) who is 1,56 m tall, who has
Fig. 6 - Western photographic oblique view (3D generated) of the footprints B07 and B13. The colour version of this fi gure is available at the JASs website.
Fig. 7 - 3D generated views of two of best-preserved fossil footprints of Trackway B (scale bar: 10 cm): Zenithal depth maps (a); Zenithal contour lines 1mm (b); Zenithal fl at surface with rFl land-marks marked in red (c); transverse view with rFl landland-marks marked in red (d); coloured contour lines 1mm (e). The colour version of this fi gure is available at the JASs website.
a left foot 23 cm long and a total-arm length (achromion to stylion) of 52,5 cm. A good dimensional correspondence can be seen in the superimposed movements as shown in Figure 9 and in the distance FM=51,6858 cm (Fig. 8, Table 8), which roughly corresponds to model’s arm-length.
From B11 to B13 a progressive regaining of body balance can be inferred. After the foot-print B14, the direction of the trackway slightly turns South-East and the trackmaker reaches the verge of a sharp drop of the slope. Here a recent destruction of the original tuff formation makes it difficult to be completely objective in evaluating the ichnological evidence. Nevertheless, two hol-lows on the tuff ground which flank, respectively right and left, the last footprints of Trackway B can be reasonably interpreted only as the hand-prints (B19 or M2; B20 or M3) (Fig. 13) left by the trackmaker’s hands on the ground to move the body forward over the verge of the drop (Fig. 11). This possibility is also endorsed by another wide print called B21 (Fig. 12) which is located immediately after the drop of the distal part of the tuff slope. It looks like a large impact zone and is clearly and easily recognizable. It is saddle-shaped and located in a right position when compared to the geometrical progression-line of Trackway B. When it was unearthed, in October 2009, it looked like the imprint of a human buttock and seemed somehow linked to Trackway B. After the complete fieldwork, the new general unearthed evidence suggested that this first impression could be correct. Actually, the dimension of the print B21 (max length: 28,5; max width: 17,9 cm) and its position between the terminal part of Trackway B and the last footprint B22 (Figs. 11, 14) (which is located in a right position at a lower altitude) strongly suggest that the interpretation of B21 as the print of a right gluteus may be the most cred-ible. Furthermore, the measurable anthropomet-ric data of B21 do not fall beyond the available anatomical parameters for a gluteus of a human body having limb dimensions like those meas-ured for the trackmaker B (Fig. 8; Tabs. 4, 7, 8, 9) (http://roymech.org/Useful_Tables/Human/ Human_sizes.html; Buxton, 2015).
Fig. 8 – Foresta (Tora e Piccilli), “Devil’s Trails” Palaeontological site: the slide zone (scale-bar: 1m; landmarks as in Table 8): Zenithal 3D gen-erated photo (a); Contour map 1mm with land-marks marked in red (b). The colour version of this fi gure is available at the JASs website.
Fig. 9 - Visual summary of the experimental re-enactment test on footprints B08-B10 area. The colour version of this fi gure is available at the JASs website.
Tab. 4 - Trackway B footprints dimensions. Fl = Footprint Length; rFl = Real Footprint Length;
Fw = Footprint Width; rFw = Real Footprint Width; FPA = Foot Placement Angle‡; FI = Footprint
Index*; rFI = Real Footprint Index; SCA = Schwartz-Clarke Angle‡; Fa = Footprint Area.
FOOTPRINT (foot) (cm)Fl (cm)rFl (cm)Fw (cm)rFw FPA ‡ (°) FI * (Fw÷Fl) X100 (%) rFI (rFW÷rFL) X100 (%) SCA‡ (°) (cmFa2) B00 (left) 22.0 22.0 10.6 10.3 -9 48.2 46.8 N.M. 197 B01 (right) 22.0 22.0 10.8 11.0 33 49.1 50.0 48 194 B02 (left) 23.4 23.0 10.6 10.5 -23 45.7 45.6 N.M. 206 B03 (right) 23.0 23.0 9.3 10.0 13 40.4 43.5 N.M. 179 B04 (left) 21.0 21.0 9.9 10.0 32 47.1 47.6 75 152 B05 (right) 24.1 23.2 10.7 10.5 -0.01 44.4 45.2 43 199 B06 (left) 22.6 22.5 9.5 10.0 -10 42.0 44.4 N.M. 173 B07 (right) 23.5 23.0 10.6 10.5 -10 45.1 45.6 62 196 B08 (left) 22.9 22.0 11.1 11.0 -13 48.5 50.0 N.M. 201 B08a (right) 22.7 22.5 10.8 11.0 3 45.6 48.9 N.M. 181 B09** (left) N.M. 90.1 N.M. 9.5 7 N.M. N.M. N.M. N.M. B10 (right) 20.9 21.0 10.8 10.5 33 51.7 50.0 N.M. 167 B11 (left) 23.4 23.0 10.7 10.0 -11 47.7 43.5 76 205 B12 (right) 23.8 23.2 9.7 10.0 14 40.7 43.1 51 173 B13 (left) 23.3 23.1 10.9 10.5 -20 46.8 45.4 57 197 B14#(right) N.M. N.M. 10.7 11.0# 45 N.M. N.M. N.M. N.M. B15 (right) 23.1 23.1 10.1 10.6 25 43.7 45.9 47 162 B16 (left) 23.1 23.0 10.4 10.4 -4 45.0 45.2 N.M. 179 B17 (right) N.M. N.M. 9.9 10.0 -4 N.M. N.M. N.M. N.M. B18 (left) 24.0 23.1 10.6 10.4 -9 44.2 45.0 72 195 B22 (right) N.M. N.M. N.M. N.M. N.M. N.M. N.M. N.M. N.M. General Mean 22.9 22.6 10.4 10.4 - 45.6 46.2 - 185.6 SD 0.93 0.73 0.51 0.42 - 3.0 2.31 - 16.19 Best preserved Mean 23.5 23.1 10.3 10.3 - 44.2 44.7 - 187.2 SD 0.40 0.083 0.53 0.249 - 2.43 1.047 14.412 Confi dence Interval (98%) 23.1 - 23.9 23.0 - 23.2 9.8 - 10.8 10.1 - 10.5 - 41.8 - 46.5 43.7 - 45.7 - 173.3-201.1
In the raws in bold the best preserved footprints are listed, which are also the most reliable for each statistic evaluation. N.M. = Not Measurable.
** Although B09 has been created by a left foot, it is not actually a simple footprint, but a very long slide. For this reason, for its being a substantial statistic outlier, its dimensions have not been considered in any quantitative estimation. # Not precisely measurable value.
‡ This measure is only approximate and no arithmetic mean has been calculated since each movement is too strongly conditioned by geomorphology.
Tab. 5 - Pace (Step) and Trackway Width*. P = Step; rP = Real Step; TW = Trackway Width.
FOOTPRINTS P (cm) (cm)rP TW * (cm) B00-B01 74.54 83.0 23.80 B01-B02 36.70 46.1 26.38 B02-B03 75.79 76.8 28.42 B03-B04 44.37 48.9 29.14 B04-B05 60.15 68.8 13.63 B05-B06 48.85 47.4 17.79 B06-B07 76.39 71.1 62.63 B07-B08 11.42 47.6 63.90 B08-B08a 54.56 61.1 29.71 B08a-B09 60.73 43.9 15.27 B09-B10 N.M. 112.6 12.24 B10-B11 72.50 71.8 20.17 B11-B12 70.49 59.6 30.05 B12-B13 41.01 38.6 36.20 B13-B14 17.91 46.0 75.93 B13-B15 51.53 42.8 39.48 B15-B16 25.09 38.3# 50.78 B16-B17 43.61 47.5# 48.84 B17-B18 27.88 37.8# 46.92 B18-B22 N.M. 173.0 N.M. General mean 49.6 57.3 24.8 SD 20.4 19.3 8.5 Confi dence Interval (98%) 37.3-61.9 46.1-68.5 18.48 – 31.12
- The anatomical landmark chosen for measuring step is always pt, i.e. the most proximal point of the heel. * The sequences of footprints are underlined, in which
abrupt and voluntary changes of direction take place, which significantly widen the track width at that point. For this reason these values have not been used in any consideration about Trackway B width. * The sequences of footprints are in bold, in which the
trackmaker is forced to widen more his/her legs to remain balanced, in an area where the inclination is well over 80%. Therefore, these values were not used in the counts of TW * The pace between B18 and B22 (underlined in bold raw in the table) cannot be considered in statistical determi-nations because these footprints are not in continuity. # Value not precisely measurable.
Finally, if we assume that B21 could be, on the contrary, a certain structure created by an anthropic cut of the tuff-slope to make a sort of ladder, we would find no reasonable explanation to the fact that it is very closely located (a few centi-metres) near an actual carved rough stair (Fig. 11). The last footprint of Trackway B (B22) (Figs. 11, 14) is located at the base of the difference in elevation of the slope, in an almost completely destroyed part of original tuff formation. B22 is only preserved in its most proximal part, but there
Tab. 6 - Stride and Pace Angle. L = Stride; rL = Real Stride; PA = Pace Angle¥.
FOOTPRINTS L (cm) (cm)rL PA ¥ (°) B00-B02 121.28 128.0 171 B01-B03 108.18 122.0 161 B02-B04 107.88 119.5 141 B03-B05 113.16 116.8 165 B04-B06 92.52 113.7 161 B05-B07 124.45 118.2 168 B06-B08 47.41 55.5 46 B07-B08a 32.24 40.9 36 B08-B09 113.55 100.0 142 B08a-B10 170.66 156.3 179 B09-B11 193.59 183.0 166 B10-B12 136.32 130.0 176 B11-B13 114.04 96.0 152 B12-B14 40.38 70.6 53 B12-B15 87.68 71.7 118 B13-B16 89.22 73.4 131 B15-B17 75.84 62.1 91 B16-B18 65.51 58.9 78 General mean 91.8 92.3 124.4 SD 31.6 29.9 48.2 Confi dence Interval (98%) 71.2-112.4 72.8-111.7 93.05-155.7
¥ This measure is only approximate because strongly conditioned by geomorphology. The underlined val-ues are not used in any statistical analysis, as they are strongly influenced by the long slip.
Tab. 7 - A stature estimation for Trackmaker Bǂ.
FOOTPRINT
(position) FOOTPRINT REAL LENGTH rFL (cm) ESTIMATED STATURE (100XrFL)/14.7 [RATIO 14.7%] (cm) ESTIMATED STATURE (100XrFL)/15.5 [RATIO 15.5%] (cm) ESTIMATED STATURE (100XrFL)/15.2 [RATIO 15.2%] (cm) ESTIMATED STATURE (100XrFL)/15.6 [RATIO 15.6%] (cm) B00 (left) 22.0 149.6 141.9 144.7 141.0 B01 (right) 22.0 149.6 141.9 144.7 141.0 B02 (left) 23.0 156.5 148.4 151.3 147.4 B03 (right) 23.0 156.5 148.4 151.3 147.4 B04 (left) 21.0 142.8 135.5 138.1 134.6 B05 (right) 23.2 157.8 150.0 152.6 148.7 B06 (left) 22.5 153.1 145.2 148.0 144.2 B07 (right) 23.0 156.5 148.4 151.3 147.4 B08 (left) 22.0 149.6 141.9 144.7 141.0 B08a (right) 22.5 153.1 145.2 148.0 144.2 B09* (left) 90.1 - - - -B10 (right) 21.0 142.8 135.5 138.1 134.6 B11 (left) 23.0 156.5 148.4 151.3 147.4 B12 (right) 23.2 157.8 150.0 152.6 148.7 B13 (left) 23.1 157.1 149.0 152.0 148.1 B14 (right) 21.5# 146.2# 138.7# 141.4# 137.8# B15 (right) 23.1 157.1 149.0 152.0 148.1 B16 (left) 23.0 156.5 148.4 151.3 147.4 B17 (right) N.M. N.M. N.M. N.M. N.M. B18 (left) 23.1 157.1 149.0 152.0 148.1 B22 (right) N.M. N.M. N.M. N.M. N.M. General Mean 22.6 153.5 145.6 148.5 144.7 SD 0.728 4.973 4.730 4.807 4.668
Best preserved Mean 23.1 157.0 148.9 151.8 147.9
SD 0.083 0.537 0.65 0.547 0.547 Confidence interval (98%) 23.0-23.2 156.5-157.5 148.3-149.5 151.3-152.3 147.4-148.4 Mean of means 152.9 149.8 SD 5.73 2.76 Final Mean 151.3 SD 2.19
The bolded footprints are the best preserved ones. They have got the power to give the most reliable statistical information.
ǂA range of ratios for the estimation of the stature is fixed according to the statistical model of Fessler et al. (2005).
# The distal margin of footprint B14 cannot be determined with sufficient objectivity, therefore all parameters derived from its real length (rFl) have not been taken into account in the calculation of mean values and in other statistical estimates. The same footprint, moreover, appears partially altered by a recent cut even at its proximal edge.
is no doubt about its authenticity as a footprint. Its surviving part, in fact, preserves the complete touch-down area of a right foot, where the marks of the change of direction of the trackmaker’s left foot during its sinking and sliding forward are clearly visible. Finally, the partial footprint B22 appears as the only smooth area within a very rough and altered surface (Fig. 14e).
The number and the characteristics of the ichnological finds worldwide and the different dimensional conventions through which they are surveyed and analyzed make it impossible to make a strict and objective comparison of the various available dataset. Every comparison could turn out to be, in fact, at best approximate if not completely unreliable. Anyway the length and width of the footprints of the trackmaker B of Foresta (Tora e Piccilli) seem perfectly match the dimensional ranges up to now available (Bonmatí
et al., 2010; Carretero et al., 2012; Dingwall et al.,
2013; Pablos, 2015; Pablos et al., 2017; Jungers
et al., 2016; McNutt et al., 2018), just like the
estimated average stature of ~151.3 cm made through the method of Fessler et al. (2005). Discussion
Only few human ichnosites are known in the world so far, and very few of them have been dated to an age older than 150 ka (Bennett & Morse, 2014 and references therein; Panarello, 2016 and references therein; Masao et al., 2017; Altamura et al., 2018). The “Devil’s Trails” of Foresta (Tora e Piccilli) belong to this very small group, but they are the only ones to be located on a very steep slope so far. That is why they are unique evidence of some uncommon and often instinctive movements that cannot be recon-structed elsewhere.
The icnhological actuality and the gen-eral taphonomical caracteristics of Trackway B have been already demonstrated and published (Mietto et al., 2003; Avanzini et al., 2008; Panarello et al., 2017). However, after new stud-ies and careful surveys some other elements of detail can be recorded. First of all, the width of
Tab. 8 - Slide movement measures.
SEGMENT LENGTH (cm) AM 75.2272 BM 75.5808 FM 51.6858 AF 23.9307 AC 43.9191 CD 86.5035 DE 48.3318 CE=CD+DE 134.8353
Landmarks description with reference to Fig. 8: A: The most proximal point of the footprint B08a. B: The most proximal point of the foot touchdown that
created the footprint B08a.
C: The most proximal point of the foot touchdown that created the footprint/slide B09.
D: The most proximal point of the foot touchdown that created the footprint B10.
E: The most distal point of the footprint B10. F: The highest point of the possible hip impact on the
sidewall.
M: The deepest point of TP_M1 handprint.
Tab. 9 - Other dimensional data of footprint B11.
PARAMETER CURVILINEAR LENGTH (cm)
Left Calf Max Width 22
Left Calf Mid Width 15
Left Ankle Width 10 Straight length from the
top of the calf-print to the heel strike zone of the footprint
Trackway B (“TW” in Table 5) that never exceeds 40 cm (Bates, 1950; Kim et al., 2008), except when the trackmaker must make some unnatural movements to change direction or maintain the general body balance.
As already noted, the footprints of Trackway B are not homogeneously preserved and, in some cases, they have been partially altered also by quarrying activities that took place in histori-cal times (Panarello et al., 2017b and references therein). This happened because the quarrymen transformed the general footprint hollows into support areas for footwear in some steepest zones (Panarello, 2008, 2016 and references therein). Fortunately, the great depth of the general hol-lows containing the footprints has ensured that the anthropic cut almost never reaches the actual footprints that have not been damaged as a con-sequence. The greatest damage, on the other
hand, has to be attributed to natural agents and to the uncontrollable impact on the site by visi-tors who do not know or cannot understand the extreme delicacy of a fossil footprint. Best pre-served footprints and the data relating thereto, which are very useful for statistical and anthro-pometric comparisons, have been highlighted in the tables, in which the same collected data have been summarized.
The careful observation of Trackway B gait pattern (Fig. 4) shows that the first touch of the heel on the ground (both of the left and of the right foot) is always located in an advanced posi-tion if compared to the previous one, except for the footprint B11 (left foot). On the contrary, the first impact zone of this footprint is in a back position if compared to that of B10 and shows a noticeable leg lift, which is followed by a heavy left foot support, so that the foot sinks for about
Fig. 10 - Southern frontal view of the footprint B11 (entire leg) (scale bar: 10cm): 3D-generated photo (a); contoured (2mm) depth map (b). The colour version of this fi gure is available at the JASs website.
36 centimeters. During this sinking, the left foot rotates toward the medial direction (i.e. toward the progression line). This quite uncommon movement gives us the possibility to measure the dimensions of the whole leg, with the calf and the ankle (Fig. 10, Tab. 9) and to be sure that the trackmaker was rapidly sliding forward when he leaned his left foot on the steep and slippery slope. Unfortunately, to date, these quantitative data are not objectively comparable to any other of this kind, because no other similar evidence is currently known.
The gait parameters of Trackway B have more meaning and are more eloquent if they are considered “step by step” rather than in their
average values. The pace and the stride, in fact, are extremely irregular and strongly conditioned by the local geomorphology and by the consist-ency of the substrate.˜ ˜
Conclusions
The results of the present research have allowed researchers to draw attention to and to quantitatively describe for the first time the fossil prints of a complete leg (calf, ankle and foot) and of a probable gluteus of a Middle-Pleistocene hominin in a sub-aerial and completely free from any cultural connotation environment.
Fig. 11 - Eastern photographic view of the most distal part of Trackway B (the recent carved anthropic ladder, and the footprints from B19 to B22 are marked, respectively, with dotted and continuous white lines). The colour version of this fi gure is available at the JASs website.
Fig. 12 - B21 (right gluteus?) (southern view, scale bar: 10cm): 3D-generated photographic view (a); contour map 1mm (b). The colour ver-sion of this fi gure is available at the JASs website.
Furthermore, the 3D photogrammetric modelling and a careful and prolonged direct analysis of the trampled surface of the “Devil’s Trails” palaeontological site have permitted the compilation and the provision of a completely new, updated and reliable dataset of each ichno-logical evidence of the Trackway B.
Finally, new collected data have enabled researchers to confirm the actuality and to give a more detailed description of the particularly unique walking pattern of a Middle-Pleistocene hominin during his instinctive attempt to regain and/or preserve balance after a sudden and pro-longed slide along a very steep and slippery slope.
Fig. 13 - M2 (B19) and M3 (B20) 3D generated zenithal blocks (southern view, scale bar: 10cm): fl at surface (a); photographic view (b); contour map 1mm (c). The colour version of this fi gure is available at the JASs website.
If considered as “frames in sequence”, the footprints of the Trackway B are a sort of quite unique motion-picture of everyday life of a pre-historic hominin.
Acknowledgements
I would like to thank very much Paolo Mietto, Maria Rita Palombo, Italo Biddittu, Mauro Antonio Di Vito, Gennaro Farinaro, David D’Andrea, Anna Mariani, Teresa Gray, Antonella Tomeo and Manuela Scaramuzzino for their pre-cious advices and help.
Fig. 14 – Footprint B22 (right foot heel strike zone) (scale-bar: 10cm): northern zenithal 3D-generated photo (a); fl at surface (northern zenithal view) (b); contour map 1mm (northern zenithal view) (c); Depth map (northern zenithal view) (d); South-Eastern photographic view (e). The colour version of this fi gure is available at the JASs website.
References
Altamura F., Bennett M.R., D’Août K. et al. 2018. Archaeology and ichnology at Gombore II-2, Melka Kunture,Ethiopia: everyday life of a mixedage hominin group 700,000 years ago. Sci. Rep., 8: 2815. DOI:10.1038/ s41598-018-21158-7.
Ashton N., Lewis S.G., De Groote I. et al. 2014. Hominin Footprints from Early Pleistocene Deposits at Happisburgh, U.K. PlosOne, 9: e88329. DOI: 10.1371/journal.pone.0088329. Avanzini M., Mietto P., Panarello A. et al. 2008.
The Devil’s Trails: Middle Pleistocene Human Footprints Preserved in a Volcanoclastic Deposit of Southern Italy. Ichnos, 15: 179-189.
Bates G.H. 1950. Track Making by Man and Domestic Animals. J. Anim. Ecol., 19: 21-28. Belvedere M., Jalil N.E., Breda A. et al. 2013.
Vertebrate footprints from the Kem Kem beds (Morocco): A novel ichnological ap-proach to faunal reconstruction. Palaeogeogr.
Palaeoclimatol. Palaeoecol., 383: 52-58.
Bennett M.R., Falkingham P., Morse S.A. et al. 2013. Preserving the Impossible: Conservation of Soft-Sediment Hominin Footprint Sites and Strategies for Three-Dimensional Digital Data Capture. PlosOne, 8: e60755. DOI: 10.1371/ journal.pone.0060755.
Bennett M.R. & Morse S.A. 2014. Human
Footprints: Fossilised Locomotion? Springer,
L o n d o n - C h a m - H e i d e l b e r g - N e w York-Dordrecht.
Bonmatí A., Gómez-Olivencia A., Arsuaga J.-L.
et al. 2010. Middle Pleistocene lower back and
pelvis from an aged human individual from the Sima de los Huesos site, Spain. Proc. Natl. Acad.
Sci. USA,107: 18386–18391. DOI: 10.1073/
pnas.1012131107 + SI.
Buxton P. (ed) 2015. Metric Handbook: Planning
and Design Data. 5th edition. Routledge,
London-New York.
Carretero J.-M., Rodríguez L., García-González R. et al. 2012. Stature estimation from com-plete long bones in the Middle Pleistocene hu-mans from the Sima de los Huesos, Sierra de Atapuerca (Spain). J. Hum. Evol., 62: 242-255.
Citton P., Romano M., Salvador I. et al. 2018. Reviewing the upper Pleistocene human foot-prints from the ‘Sala dei Misteri’ in the Grotta della Bàsura (Toirano, northern Italy) cave: An integrated morphometric and morpho-classifi-catory approach. Quat. Sci. Rev., 169: 50-64. Clarke H.H., 1933. An objective method of
meas-uring the height of the longitudinal arch in foot examinations. Res. Q., 4: 99-107.
Dingwall H.L., Hatala K.G., Wunderlich R.E.
et al. 2013. Hominin stature, body mass, and
walking speed estimates based on 1.5 million-year-old fossil footprints at Ileret, Kenya. J.
Hum. Evol., 64: 556-568.
Falkingham P.L., Bates K.T., Avanzini M. et al. 2018. A Standard Protocol for Documenting Modern and Fossil Ichnological Data. Palaeontology, 6: 69-480. DOI: 10.1111/pala.12373.
Fessler D.M.T., Haley K.J. & Lal R.D. 2005. Sexual dimorphism in foot length proportion-ate to stature. Ann. Hum. Biol., 32: 44–59. Jaworski J.M. & Aleksandrowicz R. 1992. A
com-parison of three methods of plantographic foot ex-cavation assessment. Anthropologie, 30: 197-198. Jungers W.L., Grabowski M., Hatala K.G. et al. 2016.
The evolution of body size and shape in the human career. Philos. Trans. R. Soc. Lond. B Biol. Sci., 371: 20150247. dx.doi.org/10.1098/rstb.2015.0247. Kennedy R.B., Chen S., Pressman I.S. et al. 2005.
A large-scale statistical analysis of barefoot im-pressions. J. Forensic Sci., 50: 1-10.
Kennedy R.B., Pressman S.I., Chen S. et al. 2003. Statistical Analysis of Barefoot Impressions. J.
Forensic Sci., 48: 1-9.
Kernozek T.W. & Ricard M.D. 1990. Foot Placement Angle and Arch Type: Effect on Rearfoot Motion. Arch. Phys. Med. Rehabil., 71: 988-991.
Kim J.Y., Kim K.S., Lockley M.G. et al. 2008. Hominid Ichnotaxonomy: An Exploration of a Neglected Discipline. Ichnos, 15: 126-139. Leonardi G. (ed) 1987. Glossary and Manual of
Tetrapod Footprint Palaeoichnology. Departamento
Nacional da Produção Mineral, Brasilia.
Lockley M.G., McCrea R.T. & Buckley L.G. 2015. A review of dinosaur track occurrences from the Morrison Formation in the type
area around Dinosaur Ridge. Palaeogeogr.
Palaeoclimatol. Palaeoecol., 433: 10-19.
Mallison H. & Wings O. 2014. Photogrammetry in paleontology – a practical guide. Journal of
Paleontological Technique, 12: 1-31.
Masao F.T., Ichumbaki E.B., Cherin M. et al. 2017. New footprints from Laetoli (Tanzania) provide evidence for marked body size varia-tion in early hominins. Elife, 5: e19568. DOI: 10.7554/eLife.19568.
McNutt E.J., Zipfel B. & DeSilva J.M. 2018. The evolution of the human foot. Evol. Anthropol., 27: 1-21. DOI: 10.1002/evan.21713.
Mietto P., Avanzini M. & Rolandi G. 2003. Human footprints in Pleistocene volcanic ash.
Nature, 422: 133.
Pablos A. 2015. The foot in the Homo fos-sil record. Mitteilungen der Gesellschaft für
Urgeschichte, 24: 11-28.
Pablos A., Pantoja-Pérez A., Martínez I. et al. 2017. Metric and morphological analysis of the foot in the Middle Pleistocene sample of Sima de los Huesos (Sierra de Atapuerca, Burgos, Spain). Quat. Int., 433: 103–113.
Panarello A. 2008. Cave e cavatori di tufo nell’areale del
sistema vulcanico del Roccamonfina (Caserta). Primi passi nella conoscenza del patrimonio archeominerario dell’alta Terra di Lavoro. Autorinediti, Napoli.
Panarello A. 2016. Elementi di Paleoicnologia
de-gli Ominidi. Armando Caramanica Editore,
Marina di Minturno.
Panarello A., Mazzardo L. & Mietto P. 2018. The devil’s touch: a first dataset from what could be the oldest human handprint ever found (Central-Southern Italy). Alpine and
Mediterranean Quaternary, 31: 37-47. DOI:
10.26382/AMQ.2018.03.
Panarello A., Palombo M.R., Biddittu I. et al. 2017. Fifteen Years Along the “Devil’s Trails”: Achievements and Perspectives. Alpine and
Mediterranean Quaternary, 30: 137-154.
Panarello A., Palombo M.R., Biddittu I.˜ et
al.˜ 2020. On the devil’s tracks: unexpected
news from the Foresta ichnosite (Roccamonfina
volcano, central Italy).˜J. Quat. Sci, 35: 1-13. DOI: 10.1002/jqs.3186.
Panarello A., Santello L., Farinaro G. et al. 2017b. Walking along the oldest human fossil path-way (Roccamonfina volcano, Central Italy)? J.
Archaeol. Sci. Rep., 13: 476-490.
Picasso B. 2012. Fondamenti di Meccanica e Biomeccanica:
Meccanica dei corpi rigidi articolati. Springer,
Milan-Dordrecht-Heidelberg-New York-London.
Robbins L.M. 1985. Footprints. Collection,
Analysis, and Interpretation. Charles C. Thomas
Publisher, Springfield (Illinois).
Saborit G., Mondanaro A., Melchionna M.
et al. 2019. A Dynamic Analysis of Middle
Pleistocene human walking gait adjustment and control. Italian Journal of Geosciences, 138: 231-238. DOI: 10.3301/IJG.2019.03 Santello L. 2010. Analysis of a trampled
forma-tion: the Brown Leucitic Tuff (Roccamonfina volcano, Southern Italy). Ph.D. Thesis in “Scienze della Terra”, Università degli stu-di stu-di Padova, Dipartimento stu-di Geoscienze, Tutor: Paolo Mietto, Co-Tutor: Hans-Ulrich Schmincke, (http://paduaresearch.cab.unipd. it/2566/1/PhD_thesis_Lisa_Santello.pdf ) and references therein.
Scaillet S., Vita-Scaillet G. & Guillou H. 2008. Oldest human footprints dated by Ar/Ar. Earth
Planet. Sci. Lett., 275: 320-325.
Šmahel Z. 1980. Effects of Body Weight on the Configuration of the Plantar Arch (planimetric study). Hum. Biol., 52: 447-457.
Tuttle R., Webb D., Weidl E. et al. 1990. Further Progress on the Laetoli Trails. J. Archaeol. Sci., 17: 347-362.
Wilkinson M.J. & Menz H.B. 1997. Measurement of gait parameters from footprints: a reliability study. Foot (Edinb.), 7: 19-23.
Wilkinson M.J., Menz H.B. & Raspovic A. 1995. The measurement of gait parameters from foot-prints. Foot (Edinb.), 5: 84-90.
Editor, Giovanni Destro Bisol
This work is distributed under the terms of a Creative Commons Attribution-NonCommercial 4.0 Unported License http://creativecommons.org/licenses/by-nc/4.0/