UNIVERSITÀ DEGLI STUDI DELLA TUSCIA DI VITERBO
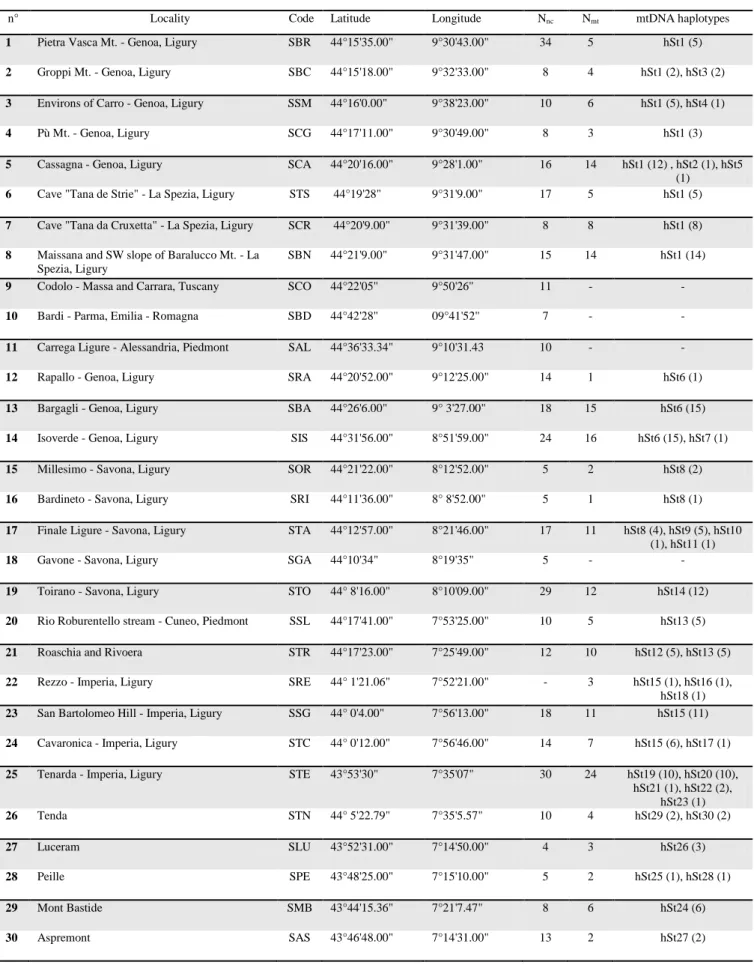
DIPARTIMENTO DI SCIENZE ECOLOGICHE E BIOLOGICHE
Corso di Dottorato di Ricerca in
Ecologia e Gestione delle Risorse Biologiche - XXVI Ciclo
Refuges, divergence and hybridization in naturally fragmented species: the
case of the European Plethodontid Salamanders (Genus Hydromantes)
(s.s.d. BIO/07)
Tesi di dottorato di: Daniela Lucente
Coordinatore del corso: Tutor:
Prof. Giuseppe Nascetti Dott.ssa Roberta Cimmaruta
INDICE
1. INQUADRAMENTO DELLA RICERCA 3 2. LUCENTE. D, NASCETTI, G., CIMMARUTA, R. PERSISTENCE, ISOLATION AND
DIVERSIFICATION OF A NATURALLY FRAGMENTED SPECIES IN REFUGIAL AREAS 11
2.1 INTRODUCTION 12
2.2 MATERIALS AND METHODS 14
2.2.1 Sampling and laboratory procedures 14
2.2.2 Mitochondrial data analysis 15
a) Phylogenetic analysis 15
b) Population genetic structure and demographic analysis 16
2.2.3 Allozyme data analysis 17
2.3 RESULTS 18
2.3.1.1 Mitochondrial data analysis 18
a)
Sequence variation 18b)
Phylogenetic analysis 18c)
Population genetic structure and demographic history 192.3.1.2 Allozyme data analysis 20
2.4 DISCUSSION 22
2.4.1.1 Population structure of H. strinatii 22
2.4.1.2 Evolutionary process and diversification in H. strinatii 23
2.5 CONCLUSIONS 25
2.6 ACKNOWLEDGEMENTS 25
2.7 TABLES AND FIGURES 26
3. CIMMARUTA R., FORTI G., LUCENTE D., NASCETTI G. THIRTY YEARS OF ARTIFICIAL SYNTOPY BETWEEN HYDROMANTES ITALICUS AND H. AMBROSII AMBROSII (AMPHIBIA,
PLETHODONTIDAE) 42
3.1 INTRODUCTION 43
3.2 MATERIALS AND METHODS 44
3.3 RESULTS 45
3.4 DISCUSSION 46
3.5 ACKNOWLEDGEMENTS 48
3.6 TABLES AND FIGURES 49
4. DISCUSSIONE GENERALE 51
5. BIBLIOGRAFIA 57
Inquadramento della ricerca
Il potenziale evolutivo di una specie è inevitabilmente funzione della sua struttura genetica (Nettel et al., 2008), la quale è il prodotto dell’azione congiunta di fattori di diversa natura (Barton, 2003) come: eterogeneità ambientale, eventi storico-demografici, frammentazione, flusso genico, deriva genetica e ibridazione. Identificare quali tra questi sono maggiormente responsabili della struttura genetica di una data specie è fondamentale per comprendere i processi microevolutivi che hanno determinato la distribuzione geografica delle singole linee intraspecifiche ed il mantenimento dei loro livelli di diversità nel tempo (Knowles and Richard, 2005).
In questo senso, un contributo significativo proviene da casi di studio riguardanti l’analisi filogeografica di specie che presentano dispersione limitata e popolazioni isolate e caratterizzate da una forte frammentazione all’interno dell’areale. Nella letteratura degli ultimi trent’anni è emerso che, in organismi animali così caratterizzati (soprattutto piccoli mammiferi, rettili, anfibi e invertebrati quali artropodi e molluschi), è quasi sempre possibile riscontrare un pattern genetico ricorrente e ben definito. In particolare, tali specie tendono ad avere poche linee evolutive genealogicamente antiche, la cui separazione spesso coincide con eventi paleogeografici e/o paleo-climatici noti. Ciascuna linea evolutiva è rappresentata da popolazioni generalmente differenziatesi in rifugi separati ed è caratterizzata da un set di aplotipi geograficamente ben localizzati (Avise, 2000; Avise, 2009). Il risultato è dunque una forte strutturazione geografica della diversità genetica.
Però, se da un lato le specie caratterizzate da abitudini sedentarie tendono a conservare meglio l’impronta di eventi storico-demografici e biogeografici pregressi, dall’altro, esse hanno spesso popolazioni di piccole dimensioni e risultano quindi vulnerabili agli effetti dei processi casuali di deriva genetica. E’ infatti noto che il tasso di deriva aumenta con il diminuire delle dimensioni effettive della popolazione (Crow e Kimura, 1970; Wright, 1931). Ne consegue che, in questi casi, la natura intrinsecamente stocastica di tali processi tende a confondere le tracce di eventi demografici passati, rendendo difficile la ricostruzione della storia evolutiva delle specie in questione, nonché l’interpretazione dei relativi pattern genetici (Koizumi et al., 2012.; Monaghan et al., 2002; Vandergast et al., 2004). Anzi, per alcune delle specie in questione la deriva genetica è stata chiamata in causa come forza predominante nel guidare i processi di diversificazione tra popolazioni e di determinazione della variabilità genetica complessiva (Knowles e Richard 2005; Koizumi et al., 2012). Ciononostante specie poco vagili e con popolazioni piccole e frammentate hanno mostrato, al crescere del numero di casi di studio, di essere in grado di mantenere elevati livelli di variabilità genetica e un chiaro segnale filogeografico, a dispetto dell’azione di forze stocastiche (quali appunto la deriva genetica), che tenderebbero a diluirli.
A tale riguardo, un caso emblematico è quello di Cambaroides japonicus, specie dalle abitudini sedentarie, suddivisa in piccole popolazioni isolate all’interno delle sorgenti dei corsi d’acqua in cui vive (Koizumi et al., 2012). I due cladi principali in cui questa specie è suddivisa hanno origine molto antica (Pliocene, 3-5 Ma), ma nonostante ciò la diversità genetica sembra essersi mantenuta nel corso di milioni di anni. Durante le glaciazioni, le popolazioni di questa specie sono sopravvissute all’interno di rifugi centrali dai quali hanno successivamente ricolonizzato le aree circostanti attraverso un processo di tipo stepping-stone. L’attuale assetto genetico della specie è il risultato di un ruolo predominante della deriva che, durante le fasi di ricolonizzazione, agendo sotto forma di effetti del fondatore ripetuti, ha portato alla fissazione di singole mutazioni nei siti colonizzati: l’evidenza principale a supporto di tale scenario è rappresentata dal fatto che le attuali popolazioni sono caratterizzate ciascuna da aplotipi per lo più esclusivi. Tuttavia, nonostante la deriva
genetica in questo caso sia stata chiamata in causa come fattore dominante nel plasmare la struttura genetica di questa specie, essa non è riuscita a cancellare del tutto le tracce antiche del processo graduale che ha portato al differenziamento tra le popolazioni, tanto che la proiezione nello spazio dei rapporti di ancestralità/discendenza tra i vari aplotipi permette di ricostruire chiaramente il processo di colonizzazione stepping-stone. In altri casi invece, la diversità genetica sembra essersi mantenuta attraverso una frammentazione e ripartizione della variabilità ancestrale causata da eventi biogeografici e demografici passati e dalla successiva azione della deriva genetica sulle popolazioni rimaste in condizione di isolamento persistente (Knowles e Richard, 2005). In ogni caso, quello che emerge in questo contesto, è che queste specie costituiscono un vero e proprio paradosso, dal momento che l’elevato grado di frammentazione e la tendenza alla sedentarietà, non hanno impedito il mantenimento di alti o relativamente alti livelli di variabilità genetica nel tempo.
Questi pattern evolutivi unici rendono le specie in questione dei modelli di studio intriganti per osservare gli effetti dell’interazione di fattori di diversa natura sui processi di differenziamento intraspecifici e per meglio comprendere quali dinamiche microevolutive debbano essere mantenute nel tempo, al fine di preservare il potenziale evolutivo di una specie.
Senza dubbio, nell’interpretazione di questi pattern, non si può prescindere dal prendere in considerazione gli effetti degli eventi paleo-climatici che si sono verificati nel tempo. Infatti, come ormai ampiamente dimostrato, l’attuale suddivisione delle linee evolutive intraspecifiche, è in parte il risultato dell’alternanza di fasi glaciali ed interglaciali che si sono succedute nel corso del Quaternario. Benché con conseguenze differenti alle diverse latitudini e sulla base della topografia, queste grandi oscillazioni climatiche hanno avuto effetti diretti sulla maggior parte dei taxa animali e vegetali a livello globale (Jansson and Dyneius, 2002), determinando contrazione ed isolamento delle popolazioni durante i periodi climatici sfavorevoli e successivi eventi di espansione e ricolonizzazione associati a condizioni climatiche più idonee (Hewitt, 1996, 2001, 2004; Schmitt, 2007). Durante gli eventi di espansione, le linee evolutive precedentemente differenziatesi in condizioni di isolamento sono spesso andate incontro a contatti secondari lungo le rotte di dispersione, (Cooper et al., 2011; Devitt et al., 2013 Galbreath et al., 2009; Kropf et al., 2002; Mila et al., 2013; Miraldo et al., 2011; Petit et al., 2003; Shepard e Burbrink, 2009; Zemlak et al., 2008), determinando una riorganizzazione dei genomi e, in alcuni casi, un incremento dei livelli di diversità genetica proprio in corrispondenza delle zone di contatto (Bay et al., 2004; Nettel et al., 2008; Zemlak et al., 2008).
Un gruppo animale che presenta le caratteristiche peculiari appena esposte è rappresentato dai Pletodontidi. Con 27 generi e 440 specie (Amphibia Web, 2014), costituiscono la più ampia famiglia di anfibi urodeli. Nel corso della sua storia evolutiva, questo taxon è andato incontro ad una rapida ed intensa radiazione adattattiva, colonizzando con successo Nord, Centro e Sud America. Da qui, durante periodi di riscaldamento globale, si sarebbe spinto fino in Eurasia (Vieites et al., 2007), dove è attualmente rappresentato solo da due generi, uno asiatico (Karsenia) ed uno europeo (Hydromantes). Nella regione neartica, dove si concentra quasi l’intera ricchezza di specie della famiglia, questi anfibi presentano spesso concentrazioni sorprendenti di diversificazione a diversi livelli gerarchici e su scale spaziali relativamente ridotte (Garcia-Parìs, 2000). Alle varie latitudini, queste specie si sono adattate ad habitat molto differenti, dalle foreste alle aree sub-desertiche. Nonostante ciò, nel corso del tempo hanno mantenuto una spiccata conservazione di caratteristiche fenotipiche (morfologiche, comportamentali, fisiologiche, dello sviluppo) che si riflette tutt’oggi in una serie di caratteri
comuni all’intero taxon (Wake, 1983). Primi fra tutti, l’elevata filopatria e la bassa vagilità: nel genere Ensatina, ad esempio, gli individui si spostano in media non più di 20 m l’anno e nell’arco di diversi anni le distanze massime osservate non superano i 60 m per le femmine e i 120 m per i maschi (Staub et al., 1995); mentre da uno studio condotto su Plethodon cinereus è emerso che nell’arco di cinque anni gli individui non si disperdevano oltre i 10 m dal sito natale, con valori medi di 2-4 m per le femmine e 6-8 m per i maschi (Liebgold et al., 2011). Pertanto, gli home range sono piccoli (in genere dell’ordine di pochi mq) e al loro interno i movimenti limitati rendono questi animali per lo più dei “sit-and-wait-foragers” (Cabe et al., 2007; Nishikawa, 1990).
I Pletodontidi sono inoltre caratterizzati dall’assenza di polmoni (caratteristica per altro unica tra i Vertebrati) e, nella maggior parte dei casi, dalla sostituzione dello stadio larvale acquatico con uno sviluppo di tipo diretto. Ciò implica che, sia per la respirazione cutanea sia per la deposizione delle uova, questi organismi necessitano inevitabilmente di un’elevata umidità e di temperature relativamente basse. Tali limiti fisiologici fanno si che il bilanciamento idrico assuma dunque un’importanza cruciale ai fini della sopravvivenza, traducendosi in una stretta associazione a condizioni microclimatiche ristrette e, conseguentemente, in una distribuzione delle popolazioni dettata dall’eterogeneità ambientale. A tale riguardo, un recente studio di Peterman e Semlitsch (2013) sulla salamandra Plethodon albagula, ha messo in luce come la distribuzione spaziale dell’abbondanza degli individui e la presenza di stadi diversi del ciclo biologico della specie, fosse tutt’altro che uniforme all’interno dell’areale, bensì plasmata da gradienti ambientali di temperatura e umidità.
Tutte queste caratteristiche appena descritte fanno si che i Pletodontidi abbiano range ristretti con popolazioni frammentate e filogeograficamente ben strutturate, a testimonianza della loro bassa dispersione, ma anche della loro antichità (Garcia-Parìs et al., 2000; Larson et al., 1984; Jockush and Wake, 2002; Pereira e Wake, 2009; Shepard and Burbrink, 2009, Wells, 2007). Ma benché l’antichità delle linee evolutive e la strutturazione genetica dimostrino che questi animali sono sopravvissuti con successo ai grandi eventi climatici del passato (Wake, 2009), rappresentando in taluni casi dei veri e propri relitti pleistocenici (Yanev e Wake, 1981), è ormai ampiamente dimostrato che durante il Quaternario le loro popolazioni sono andate incontro a cambiamenti spaziali e demografici. La bassa dispersione, l’elevata filopatria e l’eterogeneità ambientale hanno fatto si che questi cambiamenti siano avvenuti per lo più attraverso processi di differenziamento a scala locale e frammentazione genetica a scala regionale (Garcia-Paris et al., 2000; Kuchta et al., 2009; Shepard e Burbrink, 2009). Evidenze a riguardo derivano soprattutto da ricerche condotte su Pletodontidi nordamericani del genere Plethodon, che attualmente include 55 specie distribuite nelle foreste delle regioni montuose degli Appalachi e delle Interior Highlands. Le specie appartenenti a questo genere sono essenzialmente costituite da popolazioni geograficamente disgiunte su isolati montuosi differenti, separati tra loro da valli a condizioni più xeriche o connessi da stretti passi di alta quota. Sui singoli isolati, specie diverse si sostituiscono l’un l’altra lungo gradienti altitudinali. Sebbene per alcune di queste le oscillazioni climatiche sembrino non aver intaccato la stabilità demografica delle popolazioni (Shepard and Burbrink, 2008), per molte altre specie non è stato così. Queste ultime, seguendo gli spostamenti dei piani vegetazionali, sono andate incontro ad un’alternanza di eventi di contrazione ed espansione soprattutto in senso altitudinale (Shepard and Burbrink, 2009). E’ proprio durante le espansioni che si è più volte verificato l’incontro tra unità filogeografiche distinte, a livello sia intraspecifico che inter-specifico (Devitt et at., 2013; Weisrock et al., 2005). I contatti tra linee evolutive diversificatesi in isolamento rappresentano un’occasione per testare se i processi microevolutivi in atto durante le fasi di
divergenza allopatrica abbiano portato o meno al raggiungimento di un isolamento riproduttivo completo. In quest’ottica, i Pletodontidi rappresentano forse uno dei gruppi animali più interessanti da studiare, poiché un aspetto emergente nella letteratura a riguardo è che questi animali hanno avuto e continuano ad avere una storia evolutiva complessa e dinamica, fatta di frequenti interazioni tra popolazioni a diversi stadi di isolamento e speciazione. Uno degli esempi più calzanti a riguardo è quello della specie ad anello Ensatina eschscholtzii che in California è presente con un complesso di sette sottospecie distribuite intorno alla zona arida della Central Valley. All’interno di questo range, per lo più continuo, zone di contatto ricorrenti si formano tra linee evolutive a diversi stadi di differenziamento. I processi di diversificazione in questa specie sembrano essere a carico di una stretta interconnessione tra divergenza adattativa, divergenza non adattativa e isolamento storico. In un precedente lavoro (Stebbins, 1949), la suddivisione in sottospecie si è basata sui diversi morfotipi riscontrati, che sembrano essere un adattamento di tipo antipredatorio. Uno studio più recente (Pereira e Wake, 2009), effettuato mediante l’impiego di marcatori nucleari allozimici, ha evidenziato che la transizione da una forma fenotipica all’altra è sempre concordante con le discontinuità genetiche emerse per i dati molecolari. Questo supporta l’ipotesi che ci sia stata senza dubbio una divergenza adattativa e che questa sarebbe stata facilitata da periodi di isolamento, più o meno prolungati, causati sia dai grandi cambiamenti climatici sia dai processi geologici che hanno interessato la regione della Sierra Nevada. In realtà, in questa specie, i periodi di isolamento hanno interessato anche popolazioni morfologicamente simili e geograficamente continue. Ciò ha causato una struttura genetica molto frammentata dove unità evolutive fenotipicamente differenti mostrano livelli di differenziamento pari o inferiori a quelli riscontrati tra unità fenotipicamente criptiche (Kutcha et al., 2009; Wake, 1997). Infatti, attraverso tutto il range della specie, sono presenti zone di ibridazione con alta frequenza di individui ibridi, sia tra popolazioni morfologicamente distinte che tra popolazioni simili. In ogni caso, l’intensità dell’ibridazione è molto più elevata tra popolazioni eco-morfologicamente affini che non tra quelle appartenenti a sottospecie distinte: nelle prime, le zone di contatto arrivano a raggiungere estensioni di quasi 100 km, mentre nelle seconde risultano spazialmente molto più localizzate, estendendosi in media per poco più di 8 km. Quello di Ensatina è forse il caso che più esemplifica e sintetizza i meccanismi di azione dei processi di diversificazione tipici dei Pletodontidi, che alternano periodi di isolamento con forte accumulo di divergenza, a episodi di contatto secondario in cui i pool genici diversificatisi in allopatria tornano a fondersi (totalmente o parzialmente, grazie ad una plasticità fenotipica e genetica che permette il flusso genico anche tra taxa mediamente differenziati) generando i livelli particolarmente alti di diversità genetica che caratterizzano queste specie.
Da dati più recenti però inizia ad emergere che anche altri processi contribuiscono agli elevati livelli di diversità riscontrati, primo tra tutti il mantenimento della variabilità genetica primaria delle popolazioni ancestrali. E’ questo il caso della specie americana Batrachoseps major: in generale, questo pletodontide presenta una forte strutturazione genetica, con livelli complessivamente alti di diversità e aplotipi per lo più esclusivi delle singole località ma, contemporaneamente, le linee evolutive principali continuano a mantenere, nel tempo e nonostante la forte antichità del differenziamento, una serie di polimorfismi ancestrali (Martinez-Solano et al., 2012). Questo tipo di dati dimostra che, anche in specie con popolazioni piccole e frammentate, una parte rilevante della diversità genetica può essere spiegata come diversità primaria, originatasi e mantenutasi in popolazioni isolate, ancorché di piccole dimensioni. Un numero sempre crescente di studi analoghi a quello citato su B. major sta rivalutando il ruolo della diversità primaria, dimostrando che anche in specie per le quali il meccanismo del “flush and crash” era ritenuto l’unico vero processo strutturante delle popolazioni (proprio come
nei pletodontidi), l’accumulo di diversità grazie alla persistenza delle popolazioni può essere un meccanismo di rilievo, se non addirittura il principale, nel determinare i livelli di variabilità genetica attuali (Bryson et al., 2014; Byrne, 2008; Byrne e Hopper, 2008; Kuchta et al., 2009; McGiure et al., 2007; Morando et al., 2004; Nevill et al., 2010; Tapper et al., 2014).
I Pletodontidi italiani del genere Hydromantes, oggetto del presente studio, sono perfettamente in linea con le caratteristiche generali della famiglia.
Il genere Hydromantes è l’unico rappresentante europeo e probabilmente costituisce un relitto di un periodo in cui i Pletodontidi avevano una distribuzione eurasiatica molto più ampia (Wake, 2013: Darlington 1957, p. 163). Particolarità del genere, che ne ha reso in parte difficile la collocazione sistematica, è quella di avere distribuzione disgiunta: tre specie sono endemiche della regione californiana della Sierra Nevada, mentre le altre otto sono esclusive dell’Italia. Di queste ultime, tre hanno una distribuzione peninsulare e le altre cinque sono presenti solamente in Sardegna. L’attuale classificazione divide il genere in tre sottogeneri: Hydromantes, Speleomantes e Atylodes (Wake., 2012). Al sottogenere Hydromantes appartengono le tre specie californiane (H. brunus, H. shastae e H. platycephalus); al sottogenere Speleomantes appartengono le tre specie italiane continentali (H. ambrosii, H. italicus e H. strinatii) e le quattro specie della Sardegna orientale (H. flavus, H. imperialis, H. sarrabusensis e H. supramontis); infine il sottogenere Atylodes è monospecifico, poiché include solo la specie A. genei, localizzata nella parte sud-occidentale della Sardegna. La separazione dei geotritoni italiani all’interno di due sottogeneri distinti, è stata proposta per dare risalto alle differenze significative tra la specie sud-occidentale sarda e le altre specie insulari e peninsulari. Infatti, non solo i due sottogeneri presentano differenze morfologiche e cariologiche significative, ma sulla base delle ricostruzioni filogenetiche A. genei occupa sempre una posizione basale nelle filogenesi, rappresentando quindi il sister taxon delle restanti specie europee di Hydromantes (Carranza et al., 2008; van der Mejiden, 2009).
Questi anifibi, comunemente noti come geotritoni, sono animali subtroglofili, caratterizzati da livelli di differenziamento interspecifico variabili. Tra specie insulari e specie continentali i livelli di divergenza sono elevati e anche le distanze genetiche tra coppie di specie sarde sono dell’ordine di valori che nei Pletodontidi risultano con molta probabilità in un isolamento riproduttivo completo (Chiari et al., 2012; van der Meijden et al., 2009). Nel gruppo di specie continentali, invece, i livelli di differenziamento inter- ed intra-specifico sono distribuiti secondo un continuum, piuttosto che in due classi di valori discrete: il grado di divergenza genetica fra cladi della stessa specie e fra specie distinte sono spesso sovrapponibili. Non sorprende, quindi, che casi di ibridazione ed introgressione tra specie distinte siano stati dimostrati in condizioni sia naturali sia artificiali, suggerendo che i contatti secondari tra linee evolutive separate possano aver svolto un ruolo importante nel generare e mantenere la forte variabilità genetica di queste specie (Cimmaruta, 1993; Nascetti et al., 1996).
E’ proprio alle tre specie continentali che è stata rivolta l’attenzione in questa ricerca. Di seguito sono riportate le relative distribuzioni geografiche:
Hydromantes strinatii (Aellen, 1958): distribuito nel sud-est della Francia, nella porzione più orientale
del “Departement des Alpes-de-Haute-Provence” (Basses-Alpes) e “Departement des Alpes-Maritimes”. In Italia è diffuso attraverso tutta la Liguria, arrivando fino alla propaggine nord occidentale dell’Appennino Tosco-Emiliano e toccando le provincie di Cuneo, Alessandria, Massa-Carrara, Pavia, Piacenza e Parma.
Hydromantes ambrosii (Lanza, 1955): occupa un range ristretto, che ricade tra la Liguria e la Toscana,
dove è rispettivamente presente con due sottospecie, le cui popolazioni sono geograficamente separate dal fiume Magra. che segna il confine tra la provincia di La Spezia e quella di Massa Carrara. Nello specifico, la sottospecie H. a. ambrosii occupa la parte sud-occidentale della provincia di La Spezia, mentre H. a. bianchii occupa la parte meridionale della provincia di Massa Carrara.
Hydromantes italicus (Dunn, 1923): presenta un range relativamente ampio con popolazioni distribuite
tra l’Appennino Tosco-Emiliano, le Alpi Apuane e l’Apennino centrale (Appennino Umbro-Marchigiano e Appennino Abruzzese).
Nel continuum della distribuzione delle tre specie continentali, H. ambrosii occupa una posizione geografica intermedia, poiché essendo distribuito tra la Liguria orientale e la Toscana settentrionale, le sue popolazioni sono parapatriche non solo rispetto a H. italicus, ma anche rispetto al geotritone di Strinati. Lavori precedenti (Cimmaruta, 1993; Forti, 1998), hanno evidenziato che in H. a. ambrosii sono presenti alleli tipici di H. strinatii e H. italicus, ma presenti a bassa frequenza in H. ambrosii. Sulla base di ciò, era stato ipotizzato che la variabilità del pool genico di questa specie potrebbe essere in parte dovuta all’ibridazione con una delle altre due specie continentali. Per verificare questa ipotesi, e quindi testare il grado di isolamento riproduttivo tra i geotritoni continentali, nel 1983 è stato avviato un esperimento di sintopia artificiale tra H. a. ambrosii e H. italicus (Forti et al., 2002) dal quale, nell’arco di tredici anni, è emerso che i due taxa presentano un isolamento riproduttivo incompleto, testimoniato dalla formazione di una progenie ibrida con ibridi vitali e fertili. Successivamente all’avvio di questo esperimento, è stata identificata, sulle Alpi Apuane, una zona di ibridazione ed introgressione tra H. italicus e la sottospecie H. a. bianchii (Cimmaruta et al., 1993; Nascetti et al., 1996; Ruggi et al., 2005). Tra le tre specie, H. italicus è quella che mostra la struttura genetica più omogenea, nonché i più alti valori di flusso genico, lasciando ipotizzare che per questa specie l’Appennino non abbia rappresentato una barriera nelle fasi di espansione dell’areale. I livelli di variabilità riscontrati, sulla base di marcatori nucleari allozimici, diventano più alti solo nella parte settentrionale del suo areale, proprio in prossimità della zona di contatto con la sottospecie H. a. bianchii. Ciò che si verifica è un’introgressione fortemente asimmetrica, dal momento che mentre gli alleli tipici di H. italicus penetrano nel pool genico di H. ambrosii per non più di 15 km, l’introgressione di quelli di H. ambrosii in H. italicus si verifica su un’estensione di circa 90 km (Ruggi et al., 2005). Invece, tra H. strinatii e H. ambrosii non è mai stata trovata fino ad oggi nessuna zona di ibridazione, nonostante le due specie vivano in stretta parapatria, con le popolazioni più vicine che distano meno di un km l’una dall’altra (Forti et al., 1997).
In contrasto con gli scenari appena descritti sta il fatto che nessun caso di contatto secondario tra linee evolutive intraspecifiche è mai stato evidenziato all’interno dell’areale di nessuno dei tre taxa in questione.
Rispetto alle altre due specie, nel geotritone di Strinati sono stati riscontrati i livelli di variabilità e frammentazione genetica più elevati (Forti et al., 1997). Poiché questa specie è anche quella che presenta il maggior grado di eterogeneità ambientale all’interno del suo range, sia da un punto di vista orografico che climatico, ci sembra plausibile l’ipotesi che essa possa aver avuto una storia evolutiva particolarmente complessa, durante la quale episodi di isolamento ed espansioni potrebbero essere stati frequenti. Inoltre, parte delle sue popolazioni ricadono nell’area delle Alpi Marittime, al confine tra Francia sud-orientale e Liguria occidentale, nota area di rifugio glaciale (Schönswetter et al., 2005), nonché uno dei più importanti hotspot di
biodiversità del Mediterraneo (Médail & Quézel, 1997) sia per gli elevati tassi di ricchezza specifica sia per il numero di endemismi individuati (Casazza et al., 2008). Inoltre il crescente accumulo di studi concernenti specie con popolazioni residenti in questa zona, ha messo in luce come quest’ultima abbia svolto, in alcuni casi, un ruolo di area ancestrale per l’origine di specie e popolazioni (Casazza et al., 2008; Garnier et al., 2004; Grassi et al., 2009; Habel et al., 2005).
Dal momento che le specie in esame si distribuiscono lungo un range geografico praticamente continuo, succedendosi l’un l’altra dalla Francia sud-orientale fino all’Appennino Abruzzese, rappresentano degli ottimi casi di studio, lì dove il fine ultimo è quello di comprendere quali meccanismi concorrono alla generazione e al mantenimento della diversità genetica in presenza di forte frammentazione naturale delle popolazioni.
Il lavoro di tesi si è quindi orientato ad impiegare tecniche molecolari per investigare il ruolo dei diversi pattern e processi di distribuzione della diversità genetica, con particolare riguardo a:
- ruolo dei processi di ibridazione ed introgressione nella generazione della diversità genetica a livello inter- ed intra-specifico, da confrontare con il mantenimento di diversità genetica primaria, in specie caratterizzate da popolazioni piccole ed altamente frammentate;
- influenza degli eventi paleogeografici nel plasmare la struttura genetica in specie legate ad ambienti di rifugio con caratteristiche ambientali costanti (grotte) e caratterizzate da scarsa vagilità.
Gli studi sulla struttura genetica e la filogeografia di H. strinatii sono stati condotti con l’obiettivo di ricostruire la storia evolutiva della specie, nonché la distribuzione geografica dei pattern di diversità genetica al suo interno e di verificare se, durante il Pleistocene, le popolazioni sono sopravvissute in condizioni di isolamento in micro-rifugi separati oppure se fluttuazioni cicliche abbiano creato l’opportunità di contatti secondari tra unità evolutive distinte. Nel primo caso ci si aspetta un pattern di forte differenziamento tra genomi tuttora residenti nelle varie aree di rifugio e caratterizzati da una diversità genetica primaria, nel secondo caso dovrebbero essere evidenziabili tracce di contatti secondari o addirittura un rimescolamento ed un’omogeneizzazione del pool genico.
Inoltre, il ruolo dell’ibridazione introgressiva è stato analizzato anche prendendo in esame gli effetti di un esperimento di sintopia artificiale, avviato trent’anni fa, tra H. a. ambrosii e H. italicus (Forti et al., 2002). L’obiettivo in questo caso è stato quello di valutare il grado di isolamento riproduttivo tra i due taxa e l’eventuale estensione dei meccanismi di ibridazione introgressiva.
I risultati conseguiti sono stati raccolti in due articoli, di cui uno (attualmente in fase di sottomissione) sulla filogeografia di H. strinatii dal tilolo “PERSISTENCE, ISOLATION AND DIVERSIFICATION OF A NATURALLY FRAGMENTED SPECIES IN REFUGIAL AREAS” ed un secondo (già pubblicato su Amphibia-Reptilia) che riguarda i risultati dell’esperimento di sintopia artificiale dal titolo “THIRTY YEARS OF ARTIFICIAL SYNTOPY BETWEEN HYDROMANTES ITALICUS AND H. AMBROSII AMBROSII (AMPHIBIA, PLETHODONTIDAE)”.
2. PERSISTENCE, ISOLATION AND DIVERSIFICATION OF A NATURALLY
FRAGMENTED SPECIES IN REFUGIAL AREAS
Lucente D., Nascetti G. and Cimmaruta R.
Abstract
The study of the phylogeography of the European plethodontid salamander Hydromantes strinatii using allozyme and mitochondrial markers allowed recovering a phylogenetic signal despite the stochasticity introduced by the genetic drift due to the small size and the high isolation characterizing the populations of this species. Two highly divergent clades were recovered in the eastern and central-western part of the range, with a further geographic sub-structuring. Nuclear and mt markers recovered substantially the same population groups but were conflicting in reconstructing their relationships. This apparent incongruence highlighted the action of different mechanisms such as incomplete lineage sorting and possible male-mediated gene flow between differentiated lineages. The troglophilic habit of this species provides the opportunity to evidence the importance of caves as microrefugia in maintaining the genetic diversity of this species through persistence of local populations, as highlighted by high nucleotide and haplotype diversity, strong geographic genetic structuring and lack of expansion. This signature was found in the populations from Ligurian and Maritime Alps, in agreement with the complex orography and paleoclomatic history of this Mediterranean hotspot.
Keywords: Hydromantes strinatii; Plethodontid salamanders; phylogeography; microrefugia; lineage sorting; secondary contact; Maritime Alps; Ligurian Alps; allozymes; Cytochrome-b cytb; NADH-dehydrogenase subunit 2 ND2
2.1 INTRODUCTION
The role of the Italian peninsula as a refuge during ice ages has been repeatedly evidenced for many different species, with particular regard to the southern area represented by Calabria (Canestrelli et al., 2006, 2008, 2011; Hewitt, 2011). Other northernmost areas such as the Ligurian and French Maritime Alps have been recently pointed out as glacial refugia, at least during the Last Glacial Maximum (LGM) (Casazza et al., 2010; Diadema et al., 2005; Schonswetter et al., 2005). The study effort on this subject is proportional to the relevance of this process with respect to the present patterns of diversity and distribution. Indeed, for many species a significant portion of their current range has been recently recolonized from these refugia, leaving identifiable genetic patterns (i.e. “northern purity-southern richness” and “refugia within refugia”; Gomez and Lunt, 2007; Hewitt, 2004). However, many studies have shown more complex pictures, frequently characterized by discordant mitochondrial (mt) vs. nuclear (nc) patterns, which required complex explanation to be reconciled. These include gene flow between differentiated lineages (either mediated by sex-biased dispersal or not), selective sweeps in mt vs. nc markers, incomplete lineage sorting, long-distance dispersal and/or unusually high migratory rates (Clark et al., 1998; Funk and Homland, 2003; Maddison, 1997; Rheindt and Edwards 2011; Toels and Brelsford, 2012).
More recently, a role for the survival of local populations has been proposed for microrefugia, occurring at a local scale and offering steady and favourable conditions despite the adverse climatic conditions at regional scale (Bryson et al., 2014; Dobrowski, 2011; Mosblech et al., 2011). The idea roots in the study of European forest trees, whose present distribution was hypothesized as due to recolonization from scattered populations based on the finding of higher genetic diversity in northern Alps, i.e. outside the European southern macrorefugia (Birks and Willis, 2008; Petit et al., 2003). The concept was found well fitting to species from topographically complex or fragmented habitats, including Australian granite outcrops and cold-tolerant micromammals (Bhagwat and Willis, 2008; Tapper et al., 2014). Within this context, species linked to subterranean habitats are of particular interest, since caves warrant steady and surface-independent environmental conditions and some data exist proving troglobiont survival in Pleistocene glaciated areas (Allegrucci et al., 2005; Derkarabetian et al., 2010; Hedin, 1997). Even more interesting may be the study of troglophilic species, able to exploit both subterranean and epigean habitats, thus well conforming to the microrefugia model. This postulates that under unfavourable conditions, such as during glacial stages, the species may occupy southern macrorefugia by habitat shift and, at the same time, persist in glaciated areas within hypogean microrefugia. This would allow maintaining unusually high levels of genetic diversity, thanks to the retention of part of the pre-contraction genetic variation at the intrapopulation level and by the maintenance of any new acquired genotype in the microrefugia (Mosblech et al., 2011). Under improved climatic conditions the recolonization process would origin from both micro- and macrorefugia, thus producing a pattern characterized by a particularly high level of diversity and by the presence of highly differentiated populations representing microrefugia (Mosblech et al., 2011). This is for example the case of the North American vaejovid scorpion Pseudouroctonus reddelli, showing the expected pattern due to the microrefugia model: high genetic diversity at both nucleotide and haplotype level coupled with high genetic structuring, minimal geographic and population expansion, persistence of local populations even in presence of unfavourable Pleistocenic climatic conditions. The troglophilic habit of the species allowed its survival in caves across its range, where local populations retained genetic diversity instead of losing it through habitat shift/contraction (Bryson et al., 2014).
The importance of caves as microrefugia for troglophilic species deserves deeper analyses, since their role may add to our comprehension of process and mechanism leading to the extant patterns of diversity aside from widely studied macrorefugia. A species of particular interest in this context is the plethodontid salamander Hydromantes strinatii, a troghlophilic amphibian inhabiting northwestern Italy and French Maritime Alps (Lanza et al., 2006). H. strinatii is lungless, as all Hydromantes species, thus relying on cutaneous respiration and so needing steady moist and fresh environments to avoid dehydration and respiratory insufficiency. Moreover these species lack an aquatic larval stage since the metamorphosis is completed within the egg, again requiring a moist, fresh and steady habitats where females can attend to their eggs until hatching occurs (Cimmaruta et al., 1999; Lanza et al., 1995; Salvidio et al., 1994). For these reasons there is a strong association of H. strinatii with retreats, as caves and fissure systems, able to warrant the environmental parameters they need during unfavourable climatic periods such as Mediterranean spring and summer. These features make H. strinatii a good case study within troglophilic species, since it has some of the traits identifying vertebrate species able to survive in microrefugia such as a small body size (Mosblech et al., 2011). Even more relevant, the strict dependence from underground retreats implies that populations of H. strinatii are of small size, naturally fragmented and, due to their low vagility, highly isolated (Lanza et al., 2006). They can be therefore considered “permanently rare species”, supposed to have a light genetic load and therefore at lower risk of extinction when constrained in microrefugia (Mosblech et al., 2011). A further reason of interest is linked to the distribution of the species, inhabiting, in the central and western part of its range, the Ligurian and Maritime Alps. This area is characterized by a very complex orography, including karst areas, and by a peculiar paleoclimatic history. The ice sheet which covered the Western Alps during Quaternary glaciations showed a patchy distribution in the coastal zones and many peripheral areas remained free from ice, so constituting refugial micro-areas which resulted in a strikingly high species richness and endemism concentration of plant species (Casazza et al., 2008, 2010; Grassi et al., 2009) as well as a zone of coexistence of in situ differentiated lineages in animals (Garnier et al, 2004; Habel et al., 2005; Rousselet et al., 2010).
In this paper we used partial sequences of the mitochondrial genes cytochrome-b (cytb) and NADH-dehydrogenase sub-unit 2 (ND2) and allozyme analysis to study the genetic structure and the phylogeography of H. strinatii. This allowed investigating if a phylogeographic signal holds, or is instead overwhelmed by stochastic variation, in a troglophilic species characterized by small population size, low gene flow and pronounced genetic drift. We tested if persistence in microrefugia contributed to present genetic diversity of the species, leaving the expected signature of high haplotypic and nucleotidic diversity associated to strong geographic structuring and to lack of expansion. Also, we tried to assess if the distinctive topography of the Ligurian and Maritime Alps was relevant in determining patterns and processes acting on H. strinatii by contrasting the pattern of genetic diversity observed in the populations from this central-western part of the range vs. that observed in the easternmost populations, living in a more homogeneous environment.
2.2 MATERIALS AND METHODS
2.2.1 Sampling and laboratory procedures
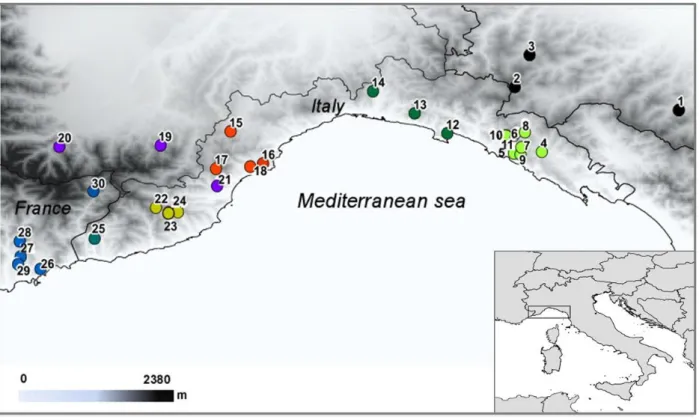
An overall number of 385 specimens of H. strinatii were sampled from 30 sites distributed throughout the species range (Table 1 and Fig. 1). Standard horizontal starch gel electrophoresis was carried out for all samples using 33 putative allozyme loci, using the laboratory procedures described in detail in Lanza et al. (1995). The following loci were analyzed: Lactate dehydrogenase (Ldh-1 and Ldh-2; EC 1.1.1.27), Malate dehydrogenase (Mdh-1 and Mdh-2; EC 1.1.1.37), Malate dehydrogenase NADP+-dependent (Mdhp-1 and Mdhp-2; EC 1.1.1.40), Glucose-6-phosphate dehydrogenase (G6pdh; EC 1.1.1.49), glyceraldehyde 3-phosphate dehydrogenase (GAPDH; EC1.2.1.12,), Superoxide dismutase (Sod-1 and Sod-2; EC 1.15.1.1), Purine nicoside phosphorilase (Np; EC 2.4.2.1), Aspartate transaminase (Aat-1 and Aat-2; EC 2.6.1.1), Creatine kinase (Ck; EC 2.7.3.2), Adenosine kinase (Adk; EC 2.7.1.20), Peptidase C (PepC-2; EC 3.4.11.1), Mannose phosphate isomerase (Mpi; EC 5.3.1.8), Glucose phosphate isomerase (Gpi; EC 5.3.1.9), Glycerol-3-phosphate dehydrogenase (alfa-GPDH; EC 1.1.1.8), 3-hydroxybutyrate dehydrogenase (HBDH, EC 1.1.1.30), Isocitrate dehydrogenase (Icdh-1 and Icdh-2; EC 1.1.1.42), NADH dehydrogenase (NADH-dh; EC 1.6.99.3), Peptidase-D (Pep-D; EC 3.4.11.1 using Phe-Pro as substrate) Adenosine deaminase (Ada-1 and Ada-2; EC 3.5.4.4), Esterase (Est; 3.1.1.1), Leucine aminopeptidase (Lap; EC 3.4.11.1), Carbonic anhydrase (Ca-2, Ca-3; EC 4.2.1.1), Phosphoglucomutase (Pgm-1 and Pgm-2; EC 5.4.2.2), Fumarase (Fum; EC 4.2.1.2).
In addition, for 194 individuals total genomic DNA was extracted from frozen tissue using the cetyltrimethylammonium bromide (CTAB) protocol (Doyle & Doyle 1987).
Partial sequences of the mitochondrial genes cytochrome-b (Cytb) and NADH dehydrogenase subunit 2 (ND2) were obtained using specifically designed primers: HST-1f (5’-TTTATTGATTTACCAACCCCATCT-3’) and DEB-1r (5’-CAGGGGTGAAGTTTTCTGGAT-3’) for Cytb; HND1-f (5’-TCAAGCTTATCCACCGGAAC-3’) and MAT2-r (5’-TTGGTGGTAGTCCGCCTAAG-3’) for ND2. Amplification was performed by polymerase chain reaction (PCR) in a volume of 25 µl, containing MgCl2 (2.5 mM ), the reaction buffer (1X; Promega), the four dNTPs (0.2 mM each), the two primers (0.2 µM each), the enzyme Taq polymerase (2 U; Promega) and 2 µl of DNA template. PCR reactions were carried out in Hain Lifescience Q-Sat 24 thermal cycler using the following program: denaturation at 94°C for 5 minutes followed by 35 cycles at 94°C for 30 s, 53°C for 1 min, 72°C for 1 min and a final elongation step at 72°C for 10 min.
Purification and sequencing reactions were outsourced to Macrogen Inc. (www.macrogen.com).
Electropherograms were checked by eye with Chromas v.1.6 (Technelysium Pty Ltd) and sequences were then aligned using the software ClustalX v.1.83 (Thompson et al. 1997).
Two specimens of the closely related species H. supramontis and H. imperialis were used as outgroups.
2.2.2
Mitochondrial data analysisPhylogenetic analysis
In order to reconstruct phylogenetic relationships between mitochondrial lineages, we conducted maximum likelihood (ML) and bayesian inference (BI) analyses for the combined dataset of Cytb and ND2 genes, applying in both cases a partition strategy by genes. Sequences of both Cytb and ND2 genes were obtained from Sardinian Hydromates species H. supramontis and H. imperialis and used as outgroups (GenBank accession n. KJ834013-14 and KJ834057-58)
We computed ML analysis in RAxML GUI v.1.3 (Silvestro and Michalak, 2011) using a GTRGAMMA model and setting partitions by codon positions for each gene. The ‘ML + thorough bootstrap’ option, with one thousand of bootstrap replicates and ten independent searches were implemented and a 50% majority-rule consensus tree was computed. Bayesian inference was carried out using MrBayes v.3.2.2 (Ronquist et al., 2011), specifying different evolutionary models for the distinct codon positions. When the outgroup was excluded, the following optimal models of sequence evolution were selected with jModelTest v.2.1.2 (Darriba et al., 2012) under a Bayesian Information Criterion (BIC) and starting with a ML optimized tree: TPM3uf+I, HKY and TrN respectively for the 1st, 2nd and 3rd codon positions of the Cytb gene; HKY, F81 and TrN+I for the 1st, 2nd and 3rd codon positions of the ND2 gene. We ran three ‘heated’ and one ‘cold’ chain for 2 million generations, sampling every 100 generations and discarding 25% of the total sampled trees from the beginning of the chain as burn-in. Standard deviations of split frequencies among chains resulted less than 0.01 and potential scales reduction factors (PSRF) for all parameters were close to one, indicating that convergence was reached. We used Tracer v1.6.0 to check for an acceptable number of independent samples (Rambaut and Drummond, 2007).
We estimated the TMRCA (Time since the Most Recent Common Ancestor) using BEAST 1.8 (Drummond and Rambault, 2007). This analysis was carried out on the topology of the Bayesian tree for the concatenated data set including all the lineages recovered, using the nucleotide substitution model recovered with jModeltest and enforcing a relaxed molecular clock. According to literature, all the Authors agree in dating back the split between eastern Sardinian and mainland lineages to the Messinisn salinity crisis, regardless the markers used in their studies (Carranza et al., 2008; Nascetti et al., 1996). Therefore, the analyses were conducted by constraining the split node between mainland Hydromantes species (represented by H. strinatii) and Eastern Sardinian species (represented by H. supramontis and H. imperialis) at 5.33 ma, which is the end of the Messinian salinity crisis (5.96-5.33 ma; Hsu et al., 1973; Krijgsman et al., 1999). Two independent runs were conducted for 20 million generations, sampling every 1000 generations and after discarding the first 20000 steps as burn-in. For each run the achievement of convergence was inspected using the program Tracer 1.6.0 before combining both to estimate the posterior distribution.
Construction of a haplotype network was carried out by median-joining (MJ) algorithm (Bandelt et al., 1999) as implemented in the software Network v.4.6.0 (http://www.fluxus-engineering.com) under Greedy FHP criterion (Foulds et al., 1979) and default parameters values.
Genetic distances between identified groups were computed in MEGA (Tamura et al., 2007) under the Kimura two-parameter (K2P) model (Kimura, 1980).
Population genetic structure and demographic analysis
To investigate population genetic structure we first ran our data in SAMOVA v.1.0 (Spatial Analysis of Molecular Variance; Dupanloup et al., 2002). This method is based on a simulated annealing approach that partitions populations into groups on the basis of geographic proximity and maximization of genetic differentiation. The method needs an a priori range of K values to be set (where K is the number of groups) and then computes, for each K, the amount of genetic variance at the following different hierarchical levels: between groups (FCT), between populations within groups
(FSC) and within populations (FST). The optimum number of groups is inferred looking at the total
genetic differentiation between them (FCT), as proposed in Dupanloup et al. (2002). We specifically
tested K values ranging from 2 to 25 and performed 100 simulated annealing processes. Additionally, we carried out the identification of groups under a Bayesian clusterization approach, using the software BAPS v.6.0 (Corander et al., 2007, 2008a; Cheng et al., 2013). This method permits to detect optimal clusterization solutions either using a priori geographic information or the only genetic data. In order to observe if there was a convergence of the results, we implemented genetic mixture analyses using the non spatial clustering option. In each case we used the ‘Not Fixed K” mode, specifying 20 as the upper limit for the number of clusters and carrying out five replicates for each K.
Once that the best number of groups was selected according to both SAMOVA and BAPS, all the following analyses data were carried out for each of the detected population group.
Haplotype (h) and nucleotide (π) diversity were estimated for each cluster using DNAsp v5.10, as well as the gene flow parameter Nm (Librado and Rozas, 2009).
A hierarchical analysis of molecular variance (AMOVA; Excoffier et al., 1992) was executed in Arlequin v.3.5 (Excoffier et al., 2010) using a pairwise FST distance matrix and running 1000
permutations.
Tajima’s D (Tajima, 1989), Fu’s Fs (Fu, 1997) and Ramos-Onsins & Rozas’ R2 (Ramos-Onsins and Rozas, 2002) statistical neutrality tests were applied to each group to detect possible historical population growth. Also, we examined distribution of the number of differences between pairs of haplotypes by a mismatch analysis (Slatkin and Hudson, 1991), evaluating both the sum of square deviations (SSD; Harpending et al., 1993) and Harpending’s raggedness index (hg; Harpending, 1994) for each group. Tajima’s D, Fu’s Fs and mismatch distribution were computed in Arlequin v.3.5 (Excoffier et al., 2010), while for R2 computations we used DNAsp v.5 (Librado and Rozas, 2009).
To verify if population genetic structure conformed to an isolation by distance model (IBD), a Mantel test was executed in Arlequin v.3.5 (Excoffier et al., 2010). A genetic FST distance matrix
was performed against a geographic distance matrix (with distances expressed in km), using 10000 permutations. Computations were done for each single group and for the whole populations set.
2.2.3 Allozyme data analysis
Allozyme allele frequencies, conformity to Hardy-Weinberg equilibrium and linkage-disequilibria were calculated using the software Genepop 4.2 (Raymond and Rousset, 1995) testing for departures from expectations using Fisher’s method. The parameters of genetic variability per population were estimated using the software Genetix (Belkir et al., 2001): mean number of alleles (Na), observed heterozygosity (Ho), expected heterozygosisty (He), percentage of polymorphic loci under 99% criterion (P99). The software Genodive 2.0 (Meirmans and Van Tienderen, 2004) was used to estimate the effective numbers of alleles (Ne).
The partitioning of genetic diversity was analyzed for variable loci using the Fixation index FST, as implemented in Genepop 4.2 (Raymond and Rousset, 1995). The significance of pairwaise FST
values was tested using Fisher’s method followed by Bonferroni correction (Rice, 1989).
A Principal Component Analysis was carried out using a matrix of covariance of allele frequencies as implemented in Genodive 2.0 (Meirmans and Van Tienderen, 2004) and the significance of the population differentiation represented by the PCA-axes was tested by 100000 permutations.
A Bayesian model-based algorithm was used to assign individuals to genetically homogeneous groups, as implemented in STRUCTURE v.2.3.4 (Pritchard et al., 2000). We used an admixture ancestry model assuming correlated allele frequencies and different values of FST for
different subpopulations. Priors were set choosing sampling location information (LOCPRIOR) and using both the mean value of FST and associated standard deviation obtained by previous calculations.
Length of the burn-in period was of 100000 replicates, followed by 100000 Markov chains Monte Carlo (MCMC) replicates and for each K, ranging from 2 to 12, four runs were conducted. The Evanno algorithm (Evanno et al., 2005) was then applied to the results using the online software Structure Harvester v.0.6.93 (Earl and vonHoldt, 2012) to select the optimal K based on both the log probability of the data and the inferred ∆K.
An analysis of molecular variance was carried out assuming a stepwise model as implemented in Genodive 2.0 (Meirmans and Van Tienderen, 2004) partitioning populations according to the K=6 groups recovered by STRUCTURE.
A Mantel test was performed in Arlequin v.3.5 (Excoffier et al., 2010) contrasting a FST
distance matrix vs. a geographic distance matrix (km). The isolation by distance hypothesis was tested for the whole population set, for the two main mitochondrial clades and for the K groups recovered by STRUCTURE.
To identify which loci mostly contribute to the assignment, the program WHICHLOCI was used to rank the scored loci acording to their ability in correctly assign individuals to their population of origin. The programs proceeds through trial assignments determining the assignment efficiency for each single locus (Bank and Olsen, 2003). The analysis was carried out creating 50 synthetic populations through resampling and ranking loci after constraining a minimum percentage of assignment of 95%.
2.3 Results
2.3.1 Mitochondrial data analysis
Sequence variation
The 687-bp fragment of cyt-b sequenced had 59 variable positions (5 singletons) 54 of which were parsimony informative, providing 24 different haplotypes over the 194 specimens scored. The obtained sequences are available in GenBank (Accession n: KJ834015-38). Nucleotide percentages were: T 33.9%, C 22.0%, A 30.4% and G 13.7%. The estimated nucleotide diversity (π) had a mean value of 0.028.
The 702 bp fragment from ND2 gene had 54 variable positions (1 singleton) 53 of which were parsimony informative The 194 specimens scored provided 18 haplotypes, available in GenBank (Accession n: KJ834039-56). Nucleotide percentages were: T 31.2%, C 23.2%, A 35.6% and G 10.0%. The estimated nucleotide diversity (π) had a mean value of 0.025.
The alignment of the concatenated sequences was of 1389 bp, including 113 polimorphic sites, 107 of which were parsimony informative and providing an overall number of thirty haplotypes, as listed in table 1. The estimated values of nucleotide (π) and haplotype (h) diversity were 0.026 and 0.87, respectively. The genetic divergence calculated according to Kimura 2 Parameter (K2P) was 0.028 (±0.003).
Each haplotype was recovered in only one or a few geographically very close localities (Fig. 1).
Phylogenetic analysis
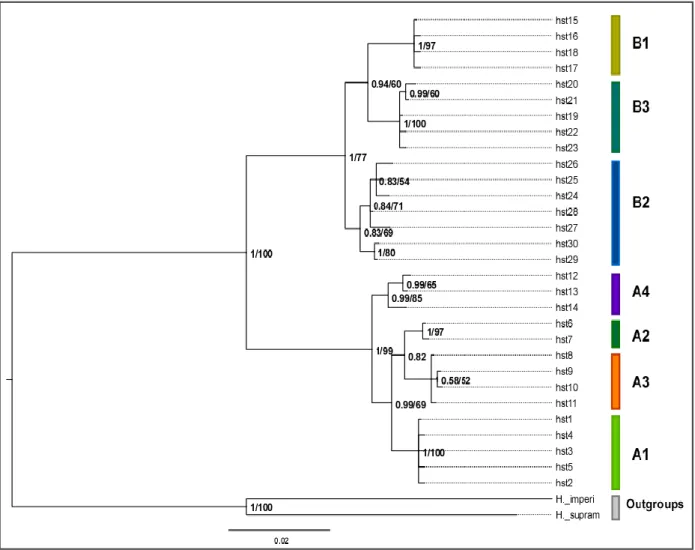
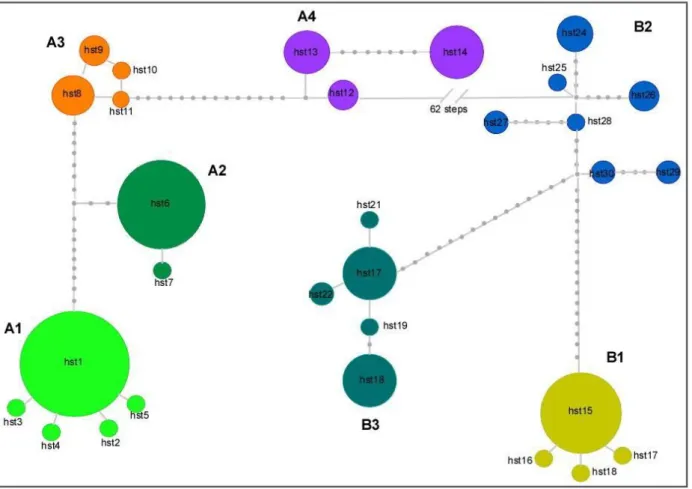
All the phylogenetic reconstructions agreed in showing two well supported reciprocally monophyletic groups, including the haplotypes recovered in the eastern-central and western part of the range, respectively: the eastern clade (Clade A) included the haplotypes recovered from the samples 1 to 21 and the western clade (Clade B) contained those from samples 22 to 30 (Fig. 2). These two clades received a high support for both ML and BI analyses (Fig 2). The Clade A was further subdivided into four geographically distinct sub-clades including the haplotypes from: the easternmost part of the range (sub-clade A1, samples 1-11), the “Rapallo area” (sub-clade A2, samples 12-14), the “Finalese” region (sub-clade A3, samples 15-18), and the “Roburent” region (sub-clade A4, samples 19-21). The branching order within the Clade A was unresolved except for the sub-clade A4, shown as monophyletic and well supported in all the topologies recovered (ML: 85%; BI: 99.6 %). The Clade B was subdivided in three sub-clades each including the haplotypes from a geographic area: “San Bartolomeo Hills” (B1, samples 22-24), “Tenarda” area in the Ligurian Alps (B2, sample 25) and the French Maritime Alps (B3, samples 26-30). The outcome of the median-joining network calculation provided further support to the results of the tree-building methods. We recovered the same two main phylogroups (A and B) separated from a total of 62 steps (Fig 3). Within each phylogroup, the haplotypes were structured in seven geographically distinct haplogroups connected by 7 to 17 mutational steps and completely congruent with the seven sub-clades recovered in the phylogenetic analyses. The sub-clade A1 displayed a starlike pattern, with the haplotype hst1 found at a high frequency in all the samples and representing the 91.5% of its haplotypic diversity. In the sub-clade B3, grouping the haplotypes from the French Maritime Alps, each population was characterized by its own exclusive haplotype(s), with those haplotypes recovered from Tenda (26) showing an intermediate position between the sub-clade B2 (Tenarda, sample 25) and the other haplotypes from French Maritime Alps.
The estimates of K2P distance between the seven lineages gave values comprised between 0.8% and 5.4%. The minimum divergence of 0.8% (p-distance=0.8%) was recovered between the sub-clades A2 and A3, even if they were not the geographically nearest groups. The values of maximum divergence, comprised between 5.0% and 5.4% (p-distance values from 4.7% to 5.2%) were always found in pairwise comparisons between sub-clades A vs. B.
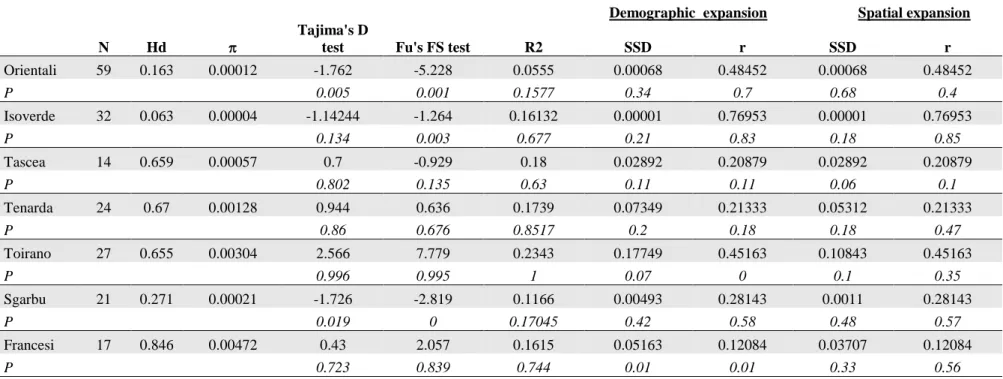
Population genetic structure and demographic history
The SAMOVA analysis showed that the best partitioning of genetic variation was achieved with seven clusters: FCT index grew from 0.79 to 0.95 for K between 2 and 7 and then slightly moved between 0.96 and 0.99
for K between 7 and 25. Accordingly, the algorithm implemented in BAPS recovered 7 as the best group membership solution with a posterior probability of 1.00. The 7 population groups inferred were completely coincident with the seven sub-clades recovered with the phylogenetic analyses, confirming the genetic and geographic pattern of differentiation previously evidenced. The AMOVA analysis was performed on the seven groups recovered by SAMOVA and showed that nearly all the genetic variation was due to the among-group level of variation (95.23%, P < 0.0001), while 3.78% was due to the among-population within-group level and 1.00% to the within-population level (Table 2).
The seven clades had heterogeneous levels of both haplotype and nucleotide diversity, with lower values presented by the eastern (A1) and Rapallo (A2) sub-clades (π ranging 0.00004 and 0.00012; h between 0.063 and 0.163) and the highest values recorded for the French clade (B3) with π = 0.00472 and h = 0.846.
Inferred levels of gene flow were very low both between groups (average Nm = 0.02) and within groups (Nm = 0.04-1.93). Within groups the lowest values of gene flow were estimated within sub-clades A4 and B2.
The Mantel test results showed no correlation between genetic and geographic distances within the seven groups detected. However, a pattern of isolation-by-distance came out when considering the entire species range (r = 0.52; p < 0.0001). A significant correlation was also observed within the clade A (r = 0.71; p < 0.0001), conversely clade B exhibited no IBD (r = 0.71; p < 0.0001).
The demographic test statistics and the analysis of the mismatch distribution computed for each of the seven clades showed only weak signs of past demographic expansion (Table 3). Both Tajima’s D and Fu’s Fs gave negative and significant values for the eastern clade A1 and for the S. Bartolomeo clade B1. However, the most sensitive R2 test did not result in any significant value. On the contrary, the mismatch distribution showed that the frequencies of pair-wise haplotype differences expected under the assumption of a sudden demographic expansion and those observed from the data were similar for all the clades except B3, so that the parametric bootstrap approach did not reject the sudden expansion model for the other 6 clades (A1, A2, A3, A4, B1, B2). However, the curves obtained from observed vs. expected differences were graphically coincident only for clades A1, A2 and B1. Overall, the values obtained testing the demographic history of H. strinatii provided weak and sometimes contrasting signals, reasonably supporting a past expansion only for clades A1 and B1.
The chronogram with the obtained confidence intervals (Fig. S1) showed that all the lineages are of Pleistocenic origin, since the split between the two main clades A and B occurred around 1.8 ma (1.82 ± 0.4). Within the clade A the supported note splitting the sub-clade A4 vs. all the others is dated 485000 ya (± 180000 ) and within the clade b the mains split (B3 vs B1+B2) dated back to 564000ya (± 200000). The differentiation of tip haplotypes occurred between 77000 and 25000 ya.
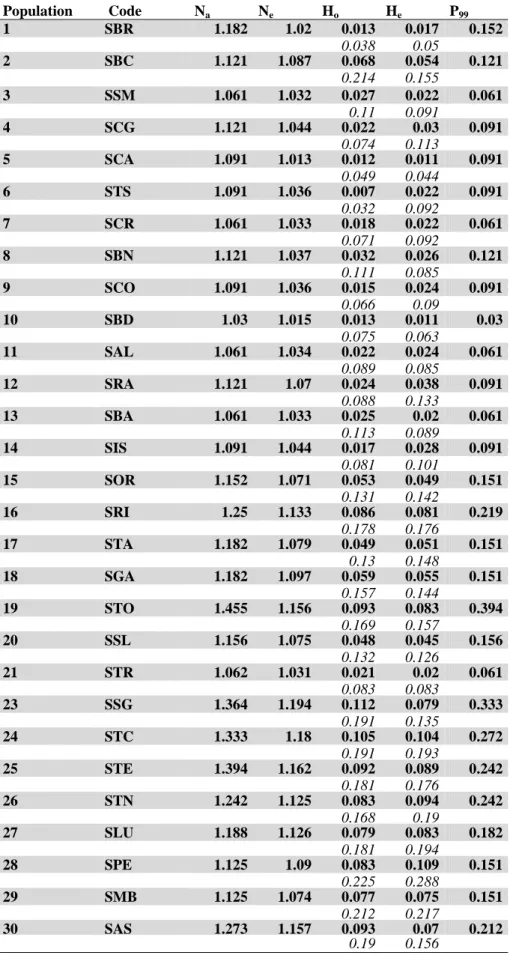
2.3.2 Allozyme data analysis
Eight loci of the 33 studied resulted monomorphic (Nadh-dh, Np, Sod-1, Sod-2, Adk, Lap, Fum, Mpi) while the remaining 25 had from two to four alleles per population (Table S1). Twenty private or rare alleles were found, 17 of which were from populations from the Central-Western (CW) part of the range (samples 15-30). The same CW populations showed higher levels of genetic variation than the Eastern (E) samples. The values of the expected heterozigosity He ranged from 0.020 to 0.109 in the CW samples and between 0.011 and
0.054 in the E ones; the percentage of polymorphic loci P99 was between 6.1 and 39.4 % in CW samples while the E samples provided lower values between 3 and 12.1% (Table 4). Sampled populations were all in Hardy-Weinberg equilibrium except three, showing a heterozygote deficiency at locus Pep-D. Linkage disequilibrium was calculated for pairwise loci across all populations and no loci pairs showed significant linkage disequilibrium after Bonferroni correction (P < 9.5 x 10⁵).
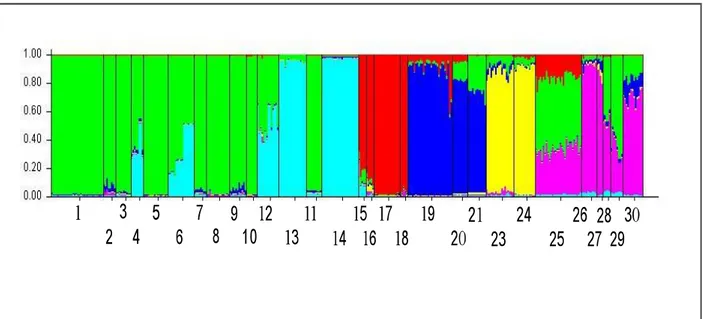
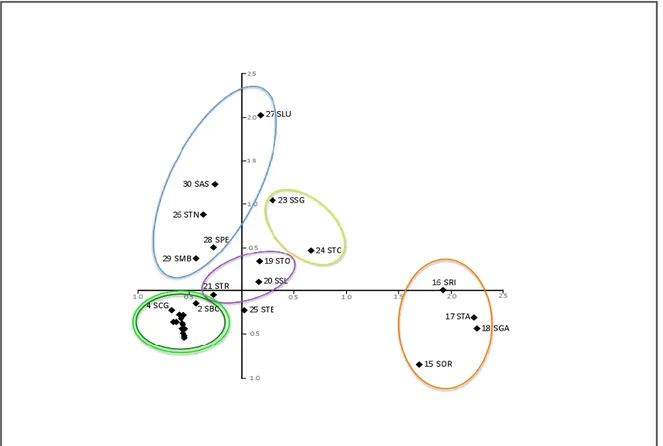
Assignment test using the Bayesian model-based analysis implemented in STRUCTURE subdivided the studied samples in six clusters (K=6) as indicated by both the higher value of ΔK and by the plateau of the estimate Ln probability. The same pattern was recovered carrying out the analysis over the 18 most polymorphic loci alone (data not shown). The six clusters recovered were geographically consistent and largely in agreement with the groups identified by haplotype analyses (Fig. 4). The eastern samples were grouped in two clusters, one comprising samples from 1 to 11 (corresponding to mtA1) and another including samples 12-14 from the “Rapallo area” corresponding to mtA2, with the samples 4, 6 and 11 (SCG, STS, SAL) showing some degree of admixture between these two groups. The samples from the “Finalese” area (15-18) were assigned to a cluster corresponding to mtA3, with nearly no admixture, while those from the “Roburent” area (19-21) formed a fourth cluster corresponding to mtA4. The cluster mtB1 from “San Bartolomeo Hills” was recovered also by STRUCTURE (sample 22 was not scored for allozymes). The sixth cluster was geographically located in the westernmost part of the range, including the samples from Tenarda and the Maritime French Alps (corresponding to clusters mtB2 and mtB3, respectively) and showed various admixture degrees except in populations 28 (SPE) and 30 (SAS). In particular, all the individuals from population 25 (STE) were strongly admixed with clusters A1 and A3. A Principal Component Analysis (PCA) explained 61.0 % of variation with two axes, recovering the larger part of the clusters identified by STRUCTURE (Fig. 5). The only exceptions were the easternmost samples (clusters mtA1 + mtA2), which were lumped together. The samples from the Finalese area (15-18, cluster mtA3), which showed no admixed genotypes, resulted clearly separated while the sample 25 (STE) showed an intermediate position, in accordance with the high level of admixture evidenced by the assignment analysis. The AMOVA carried out taking into consideration the six clusters inferred from STRUCTURE analysis evidenced that the within population and the between clusters levels nearly equally contributed to the total variation (48% and 43%, respectively, P < 0.0001 for both), while a small bur significant fraction of total variation was recovered among populations within the groups (9%, P < 0.0001).
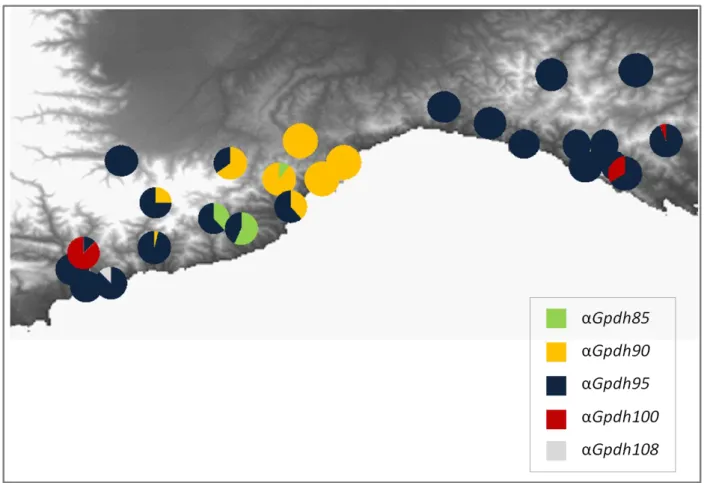
The software WHICHLOCI was used to identify the loci with the greater assignment power, resulting in a ranking with -Gpdh, 6Pgdh, Ada-2, Est-4 and Aat-1 as the top five loci, with scores nearly double than the following three loci (Mdhp-1, Mdhp-2, Pgm-1). The geographic pattern of the allele frequencies at the top five loci evidenced distinct population groups in agreement with the clustering emerging from previous analyses (STRUCTURE, PCA), due to both private alleles and changes in allele frequencies. As an example, the allele frequencies of the locus -Gpdh reported in Fig. 6 showed an eastern group characterized by a widespread
monomorphism (-Gpdh85), while the “Finalese” and “San Bartolomeo Hills” groups were evidenced by nearly exclusive alleles (-Gpdh80 and -Gpdh75). The westernmost populations shared the most common allele -Gpdh85 but those from “Roburent” area (19-21) were characterized by the presence of the allele -Gpdh75, in common with the nearest group from “Finalese” (15-18), while those from the French Maritime Alps shared the allele -Gpdh100 with the far away easternmost group.
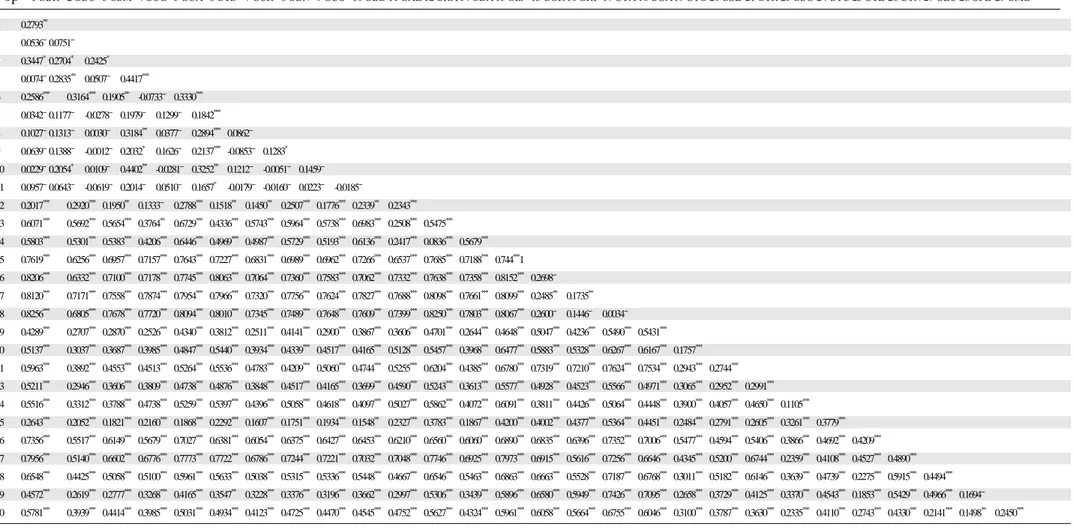
The pairwise FST estimates were always highly significant except when confronting samples from the eastern part of the range (1-11), where only 21 comparisons out of 55 were significant (Table S2). The overall FST was 0.54 (± 0.066) and the highest values (above 0.70) were recorded when comparing the samples from the “Finalese” (15-18) vs. all the others, with particularly high values vs. the eastern samples (even above 0.80). To investigate the correspondence of population genetic structuring to a model of Isolation By Distance (IBD), FST and geographic distance values were compared by a mantel test. The results obtained showed a positive correlation across the whole range of the species (r = 0.192, P = 0.0009) as well as within the eastern part of the range (samples 1-14, r = 0.351, P = 0.0080), while IBD does not hold for the western populations.
2.4 DISCUSSION
2.4.1 Population structure of H. strinatii
The results obtained, irrespective of the marker used, evidenced substantial geographical structuring in H. strinatii, as expected stated the low vagility and the strong link of this species to the local refuges represented by caves and fissure systems. Large genetic divergence over small geographic scales is quite common in plethodontids, especially if living in geographically old areas (Jockusch and Wake, 2002). However, the geographic pattern of diversity evidenced is not homogeneous across H. strinatii range, suggesting different processes leading to the extant eastern (E, 1-14), central (C, 15-21) and western (W, 22-30) population groups. In particular, the E populations are characterized by a low level of genetic diversity, concordantly revealed by both mt and nc markers. A single main haplotype is shared by the larger part of samples within each of the two sub-clades living in this area (A1, A2), together with a few rare singleton differentiated haplotypes. Also, the lowest values for allozyme variability parameters are recorded from these populations, irrespective of the sample size. The pattern of differentiation between populations conforms to IBD model, linking genetic and geographic distances along a NW-SE axis. Since small population size and low gene flow, which are usually invoked to explain low genetic variation (Amos and Harwood, 1998), are typical features of Hydromantes, they cannot account for the lower genetic variation of the E vs. CW populations. On the contrary, the signature of an expansion process is present in these populations, having a low genetic variability, a low number of widespread haplotypes and a geographic pattern of genetic diversification following an “expansion route” (Hewitt, 2000, 2004; Ibrhaim et al., 1996). In agreement, the sub-clade A1 (1-11) showed sign of expansion according to neutrality tests and mismatch analysis.
In the C and W parts of the range our data highlighted a higher genetic fragmentation. Nearly each population has its own haplotype and all the FST values for pairwise comparisons are highly significant. The IBD model
does not hold in this area: there is no relationship between genetic and geographic distance, with highly differentiated sample pairs found in the range of a few kilometres. Both nc and mt markers identified 3 groups in the C part of the range, but in the W part the mt data were able to discriminate two distinct sub-clades while allozymes grouped all the W samples in a single cluster. Despite mt and nc data are substantially in agreement in subdividing population groups, the relationships emerging are not concordant. The mt data placed the C samples from the “Finalese” (15-18) in a monophyletic group with the E samples, while the same populations formed the most differentiated group according to allozyme data (Fig. 5). In the W part of the range, the two mt sub-clades were clearly defined while allozymes grouped all W samples in a single cluster characterized by high admixture levels (Fig. 4). In the samples 25, 28 and 29 all the individuals showed a mixed ancestry, with an approximately equal fraction inherited both from the W clade they belong to and from E groups. In sample 25 some degree of admixture with the “Finalese” group was also recorded. This incongruence between mt and nc data can be explained by the “classical” hypotheses of secondary contacts due to sex biased dispersal, which has been frequently used to reconcile contrasting patterns of nc and mt markers in plethodontids. The allopatric divergence is considered as a rule in salamanders since their low vagility promotes genetic fragmentation as soon as a species disperses over a relatively wide area, especially if this is characterized by complex orography and paleogeographic history (Jockusch and Wake, 2002). Higher mutation rate and smaller population size of mt vs. nc genes would account for the deeper differentiation achieved by mt, while the frequent phylopatry of female