U
NIVERSITY OF
T
USCIA
V
ITERBODEPARTMENT OF PLANT PROTECTION
PHILOSOPHIAE DOCTOR IN PLANT PROTECTION AGR/12
- XXIV CICLE -
Fagus sylvatica (L.) fungal communities biodiversity and
climate change – a risk analysis
by
ALESSANDRA FONTENLA
Coordinator Prof. Leonardo Varvaro
Supervisor
Dott.ssa Anna Maria Vettraino
Assistant supervisor Prof. Andrea Vannini
Abstract
The latitudinal and altitudinal influences on the diversity and abundance of phyllosphere (leaves and twigs) fungal community of European beech (Fagus
sylvatica L.) were investigated with culture-dependent method and 454 sequencing.
Ninety healthy trees and 10 declining trees distributed in two altitudinal gradients and one latitudinal gradient resulted in a total of ca. 4,000 colonies (clustered in 97 OTUs) and 170.000 ITS rDNA sequences (grouped in 895 MOTUs). Community richness was explored completely in 454 sequencing, resulting ca. 10-fold higher in respect with that detected with culture-dependent method. The abundance of several species (Apiognomonia errabunda, Biscogniauxia nummularia and Epicoccum
nigrum) and taxonomic groups (Pleosporales, Capnodiales, Helotiales) were found
to be related with altitude and latitude. Fungal assemblages composition resulted scarcely comparable between the two techniques.
Key words: culture-dependent method, 454 sequencing, fungal endophytes, phyllosphere, altitude, latitude, climate change
Riassunto
L’influenza della altitudine e latitudine su diversità e abbondanza della comunità fungina della fillosfera (rami e foglie) del faggio (Fagus sylvatica L.) è stata valutata mediante l’utilizzo isolamenti su terreno di coltura e 454 sequencing (pirosequenziamento). Da novanta alberi di faggio sani e 10 deperienti distribuiti su due gradienti abitudinali e uno altitudinale sono state isolate in totale ca. 4.000 colonie (raggruppate in 97 OTU) e 170.000 sequenze della regione ITS dell’rDNA (raggruppate in 895 MOTU). Il 454 sequencing ha permesso di apprezzare totalmente la ricchezza della comunità fungina risultata ca. 10 volte superiore rispetto quella rilevata mediante gli isolamenti. L’abbondanza e distribuzione di alcune specie (Apiognomonia errabunda, Biscogniauxia nummularia e Epicoccum nigrum) e gruppi tassonomici (Pleosporales, Capnodiales, Helotiales) è risultata dipendere dall’altitudine e latitudine. La composizione della comunità rilevata con le due differenti tecniche è risultata poco confrontabile.
Parole chiave: isolamenti, pirosequenziamento, endofiti fungini, fillosfera, altitudine, latitudine, cambiamento climatico
Contents
1 – Climate change (CC) impact on Southern Europe forests ... 1
1.1 – Forest ecosystems are affected by CC ... 1
1.2 – Southern Europe climate scenarios ... 1
1.3 – Predictions on climate change impact on forests growth ... 2
1.4 – Climate change impact on forests susceptibility to pathogens ... 3
1.5 – Forests endophytes and CC ... 5
1.6 – European beech distribution and ecology ... 7
1.7 – European beech, endophytes and CC ... 8
References ... 9
2 – Aims ... 13
3 – Samplings on climatic gradients ... 15
3.1 – Experimental design ... 15
3.1.1 – Study sites ... 15
3.1.2 – Altitudinal gradients ... 19
3.1.3 – Latitudinal gradient ... 23
3.2 – Samplings and pre-processing ... 25
References ... 26
4 – Chapter 1: analysis of biodiversity of European beech endophytes community assemblages detected along climatic gradients: culture-dependent method ... 28
4.1 – Materials and methods ... 28
4.1.1 – Endophytes isolation from beech leaves and twigs ... 28
4.1.2 – DNA extraction, amplification and sequencing ... 28
4.1.3 – OTUs clustering ... 29
4.1.4 – Climatic data elaboration ... 30
4.1.5 – Statistic analysis ... 30
4.2 – Results ... 31
4.2.1 – General results ... 31
4.2.2 – Altitudinal Gradient 2010 (Abruzzi) ... 35
4.2.3 – Altitudinal Gradient 2011 (Latium) ... 37
4.2.4 – Latitudinal Gradient 2010 ... 39
4.3 – Discussion ... 46
4.4 – Conclusions ... 51
References ... 51
5 – Chapter 2: analysis of the biodiversity of European beech phyllosphere (leaves and twigs) detected on climatic gradients: massively parallel 454 sequencing (GS FLX Titanium) ... 55
5.2 – Materials and methods ... Errore. Il segnalibro non è definito. 5.2.1 – Experimental design ... 55
5.2.2 – DNA extraction, amplification and 454 sequencing ... 56
5.2.4 – Molecular Bioinformatics and Operational Taxonomic Units (MOTUs)
designation ... 59
5.2.3 – Statistic analysis ... 60
5.3 – Results ... 60
5.3.1 – 454 sequencing output ... 60
5.3.2 – Customer-curated database mapping effectiveness... 61
5.3.3 – General results ... 62
5.3.4 – Altitudinal Gradient 2010 (Abruzzi) ... 65
5.3.5 – Altitudinal Gradient 2011 (Latium) ... 66
5.3.6 – Latitudinal Gradient 2010 ... 67
5.4 – Discussion ... 68
5.5 – Conclusions ... 71
References ... 71
6 – General discussion and conclusion ... 73
References ... 75
1
1 – Climate change (CC) impact on Southern Europe forests 1.1 – Forest ecosystems are affected by CC
According to the IPCC Fourth Assessment Report, during the 20th century, most of Europe experienced several changes in weather pattern determining notable impacts on the forests ecology and the forest sector. Average annual surface temperature increased over the continent of 0.8°C, with stronger warming over most regions in winter than in summer. At the same time precipitation trends, while increasing in northern Europe, showed decrease in southern Europe (up to 20% in some areas). In the past few decades a progressive increase in annual forest CO2 storage capacity due to increased CO2 atmosphere concentration, lengthening of the growing season and increased nitrogen deposition has been observed globally. Even though in Southern Europe biomass production has reduced as a consequence of rainfall decrease and warmer/drier conditions, especially after severe drought events (e.g. year 2003). Besides that in the Mediterranean Basin forest biomass is further threatened because of increased forest fires and pests damages. In temperate regions climate change has not such a severe effects as damages are balanced by positive influence of reduced risk of frost, longer growing season duration and advance in phenology increased biomass (Parry et al., 2007).
1.2 – Southern Europe climate scenarios
IPCC Fourth Assessment Report predicts European annual temperature in all Europe to increase further over the 21th century of 0.1 to 0.4°C/decade. On the other hand precipitations are expected to decrease in the south whereas small or ambiguous changes are supposed to occur in temperate areas. It is likely that the precipitation seasonality will change, moreover intense precipitation events will be more frequent, especially in winter. Also the intensity and frequency of summer heat-waves are expected to rise. On the mountains the duration of snow cover is expected to decrease
2
by several weeks for each °C of temperature increase in the Alps region at middle elevations.
1.3 – Predictions on climate change impact on forests growth
All these climate changes will necessarily affect plant that can grow and survive only within specific ranges of climatic and environmental conditions.
If conditions change beyond the tolerances of species, then they respond by shifting the timing of life-cycle events (e.g. bud burst, blooming, autumn leaves drop), shifting range boundaries (e.g., moving northward and upward), changing genetics, or totally disappearing. In fact larger long-lived trees and shrubs are under great threat in respect of faster-reproduction-cycles plants (e.g. herbs, ferns and mosses) from the impacts of climate change because they can't adapt to local conditions quickly enough and relocate (Lenoir et al., 2008). In particular drought at low altitude and/or latitude range edge may have profound consequences for the persistence of tree populations where current increases in temperature are not matched by increases in precipitation (Jump et al., 2006). Besides temperature effect, timing of species shift depends on rate at which seeds can reach new climatically suitable regions (Moore & Allard, 2008). In the Mediterranean, forest area is expected to expand northward contracting in the south (Parry et al., 2007) where the distribution of a number of typical tree species is likely to decrease (Schröter et al., 2005). Both conifers and broadleaves Net Primary Production (NPP) is likely to increase throughout the century in northern and maritime temperate zones of Europe, and at higher elevations in the Alps, until dropping by the end of the century due to water and nutrients limitations (e.g. nitrogen, phosphorus, sulphur, some micronutrients). Anyway water stress in the south may be partially compensated by elevated CO2 levels resulting in increased trees grow rate and water-use efficiency. Elevated CO2 levels may induce the increase of leaf area and thickness, number of leaves, total leaf area per plant and diameter of stems and branches. Finally fire danger, length of the fire season, and fire
3
frequency and severity are very likely to lead to increased dominance of shrubs over trees in the Mediterranean (Parry et al., 2007; Moore & Allard, 2008)
1.4 – Climate change impact on forests susceptibility to pathogens
The relationship between climate, forests and disturbance agents (e.g. fire, drought, landslides, species invasions, insect and disease outbreaks and storms, etc.) results very complex as CC is expected to impact at the same time on:
- frequency, intensity, duration, and timing of abiotic disturbances; - forests susceptibility to disturbances;
- forest pests and the damage they cause influencing their development, survival, reproduction, distribution and spread. Affecting the relationships between pests and other species such as natural enemies, competitors and mutualists.
Complexity of such relationship results even more marked considering that any disturbance may enhance other disturbances in turn (Moore & Allard, 2008).
Forest fungal pathogens are indirectly affected by CC as hosts resistance is altered through changes in temperature, precipitation, atmospheric CO2 concentrations, N2 deposition, extreme events and other climatic factors altering tree physiology (Ayres and Lombardero, 2000). Impact extent of such changes depends on forest characteristics, age-class, structure and soil depth and type (Mortsch, 2006). For instance saplings and seedlings are more susceptible to drought than adult trees as their root systems cannot absorb water from great depths and do not contain abundant stores of nutrient and carbohydrates. Shallow-rooted trees are disadvantaged in respect of deep-rooted trees as well (Moore & Allard, 2008). A recent meta-analysis dealing with the drought effect on damage by forest insects and pathogen (Jactel et
al., 2012) reported that drought occurrence do not necessary cause high biotic
damage in forests. In some cases trees show even slighter damages under mild water stress conditions than unstressed trees, whereas above a threshold of stress severity, secondary pathogens may cause serious damages. This is consistent with the
4
‘growth–differentiation balance’ hypothesis (Herms & Mattson, 1992) according to which moderate drought may increase production of defensive chemical compounds in trees providing increased protection against pests and pathogens. Drought and higher atmospheric CO2 levels affect the nutritional quality of host trees for fungal pathogens altering the tissues water, carbohydrates and nitrogen contents (Jactel et
al., 2012). Low water availability causes a photosynthesis decrease and lower sugar
availability for pathogens in the plant tissues. Moreover during moderate drought periods, reduced water content and protein hydrolysis lead to higher nitrogen concentration in tree foliage. As a consequence stem primary pathogens will have lower provision of carbohydrates and nitrogen (Jactel et al., 2012) while higher nitrogen levels in the leaves of trees can immediately increase the incidence of a number of pathogens (Burdon, Thrall and Ericson, 2006). Finally extreme events as windstorms and lightning strikes, as well as causing mechanical breakdown in normal physiological function, can also allow entry of pathogens (Moore & Allard, 2008).
CC then has a direct impact on pathogens physiology, distribution, phenology and population genetics. The ability of a pathogen to respond to CC depends on a number of life history characteristics, making the possible responses quite variable among species. Desprez-Loustau et al. (2006) stated that the direct effect of drought on forest (primary) pathogens is expected mainly negative, as spore dispersal, germination and infection stages necessarily need high humidity conditions. In some cases pathogens infection (e.g. Phytophthora sp.) can only occur following a particular sequence of dry and wet conditions (Desprez-Loustau et al., 2006). On the contrary secondary pathogens (e.g. fungal endophytes) take more advantages of indirect effects of CC enhancing host trees susceptibility producing damages during/after the most severe drought events.
Therefore, having such different pathogen responses, when assessing the potential risk of tree damage due to drought the plant-pathogen relationship should be always considered. In particular the main predictors are the pathogen status (primary or
5
secondary), the tree part to be affected and the water stress severity (Jactel et al., 2012).
1.5 – Forests endophytes and CC
Endophytes are defined as “All organisms inhabiting plant organs that at some time in their life, can colonize internal plant tissues without causing apparent harm to the host” (Petrini, 1991). Among endophytes, fungal endophytes are ubiquitous and they can be specifically adapted to the host they colonized or they can be just incidental opportunists normally growing on other substrates (Schulz & Boyle, 2005). Endophytes reside exclusively within plant tissues and may grow within roots, stems and leaves. They may remain quiescent for the whole lifetime of the asymptomatic infected plant or for an extended period. Generally they emerge to sporulate only when substrate is senescent (Carroll, 1988; Stone at al., 2004; Sieber, 2007).
Forest trees are widely or totally colonized by ‘nonclavicipitaceous’ (NC) (or ‘non-balansiaceous’ endophytes according to Schulz & Boyle, 2005) fungal endophytes. NC-endophytes represent a polyphyletic assemblage of primarly ascomycetous fungi
with diverse and often poorly defined or unknown ecological role (Rodriguez et al.,
2008). Forest trees epigeous organs host NC-endophytes belonging to the 2nd and 3rd functional groups (i.e. Class 2 and Class 3) among those proposed by Rodriguez et al. (2008).
The Class 2 comprises species mainly belonging to Ascomycota (Pezizomycotina) and to Basidiomycota to a lesser extent. The diversity of species of this functional group in individual host plants is quite limited. They are able to colonize even extensively all the plant organs (roots, stems and leaves). Class 2 endophytes transmit both horizontally and vertically (via seeds coat), once inside the host they grow in intercellular spaces with a slight or none impact on hosts cell. Finally they emerge and sporulate at host senescence. Class 2 endophytes confer habitat-adapted benefits to their hosts (tolerance to a variety abiotic stress as drought, soil salinity, pH) and typically they have high infection frequencies (90-100%) in plant growing in
high-6
stress habitat. Some class 2 species have been reported to confer also tolerance to a variety of biotic such as pathogens through the production of secondary metabolites or through competition with pathogenic or parasitic species (Rodriguez et al., 2008).
In Class 3 endophytic Ascomycota are reported to be primary. Sordariomycetes and
Dothideomycetes are generally more represented than Pezizomycetes, Leotiomycetes
and Eurotiomycetes (Arnold et al., 2007; Higgins et al., 2007) but classes assemblage may vary according to biomes and hosts lineage. Among Basidiomycota the most frequent divisions are Agaricomycotina, Pucciniomycotina, and Ustilaginomycotina.
Basidiomycota frequency is higher in woody tissues than in foliage. Anyway Basiodiomycota endophytes species frequency is supposed to be underestimated by
cultured-based studies (Arnold et al., 2007). Class 3 endophytes are hyperdiverse within individual host tissues, plants and populations. As a consequence of horizontal transmission, they infect locally epigeous tissues with a little biomass (‘microthalli’ consisting of few cells, Stone, 1987), as a result any leaf represent a densely packed mosaic of species (Lodge at al., 1996) with a distinctive species assemblage (Arnold
et al., 2003). Ecological role of Class 3 endophytes is not univocal as they may
confer alternatively higher or lower resistance to drought or growth rate to their hosts.
CC has a direct effect on Class 3 endophytes as they reproduce by hyphal fragmentation or asexual/sexual spores produced on senescent tissues propagated by rain, wind or vector organisms. Class 3 endophytes colonization rate is faster when dew, rain or fog wet host tissues, while it resulted to be irrespective of leaf toughness and leaf chemistry (Arnold & Herre, 2003). Frequency, richness and diversity of Class 3 endophytes are closely related to climate and latitude. In fact they usually decrease moving poleward however local abiotic conditions can lead to unexpected diversity e.g. in wet microclimate areas (Arnold & Lutzoni, 2007). Additionally CC affects the ‘balanced antagonism’ (Schulz & Boyle, 2005) between endophyte and host tree. In a balanced situation both the partners adopt a survival strategy and do
7
not gain the upperhand in the interaction, even though endophytes could attack as they possess virulence factors and plants could react with preformed and induced defence metabolites. Anyway the balance may be just temporary since environmental factors and CC can affect the balance triggering host susceptibility and/or releasing pathogen quiescence (Schulz & Boyle, 2005; Desprez-Loustau et al., 2006). In this case disease develops.
1.6 – European beech distribution and ecology
European beech (Fagus sylvatica L.) is the most abundant broad-leaved forest tree in Central Europe known to have a remarkable importance for forestry and timber industry (Dittmar et al., 2003). F. sylvatica is widespread in middle, western and southern Europe area. Northern range limit goes through the Southern part of Great Britain, Northern Germany, Denmark and southern Sweden until reaching Norway in some isolated locations. Eastern borders go through Poland, western Ukraine, Moldavia and the Black sea coastline. In the southeastern and southern Europe it is still present in Balkan Peninsula, South Italy and Spain, mainly in Pyrenees and Cantabrian Mountains. European vertical occurrence range is from 17 m (above Bulgarian Black sea) to 2000 m. Also in Italy F. sylvatica is one of the most widespread wooden species together with sweet chestnut (Castana sativa Miller). Besides of its economic importance, European beech plays an important ecological and hydrogeological role in forest ecosystems (Danti et al., 2002). Its range includes all the Alpine areas; it goes down along Apennines and encounters its southernmost limit in Sicily (Hofmann, 1991) where it grows in separate spots on Nebrodi, Madonie, Etna and Peloritani Mountains (Schicchi et al., 2009). It is totally absent only in Sardinia and rare in Aosta Valley (Hofmann, 1991).
Fagus sylvatica is a typical oceanic and sub-oceanic climate species and can adapt
just partially to continental and mediterranean climate conditions. It needs moderately cold winters, rainy springs with fogs but without frost, long growing season without excessive evapotranspiration (Hofmann, 1991, Bernetti, 1995). It needs good soil
8
water retention but at the same time it doesn’t tolerate water-logging or flooding. Roughly it needs 800-1000 mm precipitation/year, this threshold can also be lower if atmospheric humidity remain throughout the year (frequently occurring fogs), especially at the beginning of the growing season and in early summer when water availability is crucial for foliage growth. As beech is generally shallow-rooted, it has to collect meteoric water or alternatively the stem flow (Hofmann, 1991; Borghetti & Magnani, 1999; Del Favero, 2004). Although early leaves yellowing is effective to prevent mortality due to summer drought (Hofmann, 1991; Del Favero, 2004), F.
sylvatica reacts to water-deficit stress with several physiological adaptations (e.g.
photosynthetic efficiency decrease, xylem embolism, restricted nutrient uptake capacity and growth reduction), resulting in a competitiveness loss in respect to drought-tolerant species (Geβler et al., 2006, Del Favero, 2008).
1.7 – European beech, endophytes and CC
CC affects F. sylvatica growth and health in Southern Europe. Recent dendroclimatological studies (Jump et al., 2006; Penuelas et al., 2007; Piovesan et
al., 2008; Michelot at al., 2011) reported a steep beech growth declines (lower basal
area increment, BAI) and stands replacement due drought since the 70s. This climate-related decline it is not an isolated phenomenon, but it is spread throughout all the southern edge of this species in Europe. As an example Jump et al. (2006) observed since 1975 a decline occurring in north-eastern Spain causing isolation and degradation of beech population and replacement by Quercus ilex L. (Holm oak). Trees symptoms were mainly discoloration and defoliation. By 2003, the growth of mature trees had further decrease of the 49% when compared with pre-decline levels. Also Piovesan et al. (2008) reported a decreasing BAI mainly at the lower altitudes of hills and mountains in Italian Apennines under the influence of long-term drought since 1970. CC may also threaten beech stands by affecting the endophytes-host balanced antagonism (Schultz & Boyle, 2005). Endophytes-related decline has been observed and documented rather frequently in the last decades. Most of the studies
9
have been conducted in Italy where poor crown conditions and diebacks have been observed in Tuscany (Clauser & Gellini, 1986; Bottacci et al., 1988; Moriondo & Mugnai, 1990; Bussotti et al., 1992; Danti et al., 2002, Danti & Sieber, 2004), Calabria (Paoletti et al., 1996; Moriondo et al., 1999), Abruzzi (this study, see 3.1.2) and Sicily (Granata & Whalley, 1994; Mazzaglia et al., 2002; Sidoti & Granata, 2003; Granata & Sidoti, 2004).
References
Arnold A.E., Henk D.A., Eells R.A., Lutzoni F., Vilgalys R., 2007. Diversity and phylogenetic affinities of foliar fungal endophytes in loblolly pine inferred by culturing and environmental pcr. Mycologia, 99: 185–206.
Arnold A.E., Herre E.A., 2003. Canopy cover and leaf age affect colonization by tropical fungal endophytes: ecological pattern and process in Theobroma cacao (Malvaceae). Mycologia, 95: 388–398.
Arnold A.E., Lutzoni F., 2007. Diversity and host range of foliar fungal endophytes: are tropical leaves biodiversity hotspots?. Ecology, 88: 541–549.
Arnold A.E., Mejía L.C., Kyllo D., Rojas E.I., Maynard Z., Robbins N., Herre E.A., 2003. Fungal endophytes limit pathogen damage in a tropical tree. Proceedings of the National Academy of Sciences, USA 100: 15649–15654.
Ayres M.P., Lombardero M.J., 2000. Assessing the consequences of climate change for forest herbivores and pathogens. Science of the Total Environment, 262: 263–286.
Bernetti G., 1995. Selvicoltura speciale. U.T.E.T., Torino, 415 pp.
Borghetti M., Magnani F., 1999. Relazioni idriche del faggio. In: Ecologia strutturale e funzionale delle faggete italiane. Edagricole, Bologna, 107-132.
Bottacci A., Brogi L., Bussotti F., Cenni E., Clauser F., Ferretti M., Gellini R., Grossoni P., Schiff S., 1988. Inquinamento Ambientale e Deperimento del Bosco in Toscana. Societa` Botanica Italiana, Regione Toscana, Firenze.
Burdon J.J., Thrall P.H. & Ericson L., 2006. The current and future dynamics of disease in plant communities. Annual Review of Phytopathology, 44: 19–39. Bussotti F., Cenni E., Ferretti M., Cozzi A., Brogi L., Mecci A., 1992. Forest
condition in Tuscany (central Italy): field surveys 1987–1991. Forestry 68: 11– 24.
Carroll G., 1988. Fungal endophytes in stems and leaves – from latent pathogen to mutualistic symbiont. Ecology, 69: 2–9.
Clauser F., Gellini R., 1986. Moria del bosco: osservazioni sulle latifoglie nel triennio 1982–1984 in Toscana. Atti della Societa` Toscana di Scienze Naturali residente in Pisa, Memorie, serie B 93: 11–25.
Danti R., Sieber T.N., 2004. Environmental changes and endophytes: two studies on European beech (Fagus sylvatica L.) in Italy, pp. 183-202. In Endophytism in
10
forest trees (Accademia Italiana di Scienze Forestali), Università degli studi, Firenze (IT)
Danti R., Sieber T., Sanguineti G., 2002. Endophytic mycobiota in bark of European beech (Fagus sylvatica) in the Apennines. Mycological research, 106 (11): 1343-1348.
Del Favero R., 2004. I boschi delle regioni alpine italiane: tipologia, funzionamento, selvicoltura. CLEUP. Padova, 599 pp.
Del Favero R., 2008. I boschi delle regioni meridionali e insulari d’Italia: tipologia, funzionamento, selvicoltura. CLEUP. Padova, 469 pp.
Desprez-Loustau M.L., Marҫais B., Nageleisen L.M., Piou D., Vannini A., 2006. Interactive effects of drought and pathogens in forest trees. Annals of Forest Science, 63: 597–612.
Dittmar C., Zech W., Elling W., 2003. Growth variations of Common beech (Fagus
sylvatica L.) under different climatic and environmental conditions in Europe - a
dendroecological study. Forest Ecology and Management 173: 63-78.
Geßler A., Keitel C., Kreuzwieser J., Matyssek R., Seiler W., Rennenberg H., 2007. Potential risks for European beech (Fagus sylvatica L.) in a changing climate. Trees, 21: 1–11
Granata G., Sidoti A., 2004. Biscogniauxia nummularia: pathogenic agent of a beech decline. Forest Pathology, 34: 363-367.
Granata G., Whalley A. J.S., 1994. Decline of beech associated to Biscogniauxia
nummularia in Italy. PETRIA – Giornale di Patologia delle Piante., 4 (2):
111-116.
Herms D.A., Mattson W.J., 1992. The dilemma of plants: to grow or defend. The Quarterly Review of Biology, 67: 283–335.
Higgins K.L., Arnold A.E., Miadlikowska J., Sarvate S.D., Lutzoni F., 2007. Phylogenetic relationships, host affinity, and geographic structure of boreal and arctic endophytes from three major plant lineages. Molecular Phylogenetics and Evolution, 42: 543–555.
Hofmann A., 1991. Il faggio e le faggete in Italia. Collana Verde 81, Corpo Forestale dello Stato, Roma.
Jactel H., Petit J., Desprez-Loustau M.L., Delzon S., Piou D., Battisti A., Koricheva J., 2012. Drought effects on damage by forest insects and pathogens: a meta-analysis. Global Change Biology 18: 267–276.
Jump A.S., Hunt J.M., Peñuelas J., 2006. Rapid climate change-related growth decline at the southern range-edge of Fagus sylvatica. Global Change Biology, 12: 2163–2174.
Karnosky D.F., Pregitzer K.S., Zak D.R., Kubiske M.E., Hendrey G.R., Weinstein D., Nosal M., Percy K.E., 2005. Scaling ozone responses of forest trees to the ecosystem level in a changing climate. Plant, Cell and Environment, 28: 965– 981.
11
Lenoir J., Gégout J.C., Marquet P.A., de Ruffray P., Brisse H., 2008. A significant upward shift in plant species optimum elevation during the 20th century. Science, 320: 1768-1771.
Lodge D.J., Fisher P.J., Sutton B.C., 1996. Endophytic fungi of Manilkara bidentata leaves in Puerto Rico. Mycologia, 88: 733–738.
Mazzaglia A., Librandi I., Granata G., Colasanti V., Anselmi N., 2002. Incidenza di
Biscogniauxia nummularia (Bull.: Fr.) O. Kuntze in fase endofitica su faggio in
boschi colpiti e non da deperimento (The incidence of endophytic Biscogniauxia
nummularia on Fagus sylvatica in declining and healthy forests), pp. 61-72, in
L’endofitismo di funghi e batteri patogeni in piante arboree e arbustive, Atti del Convegno Nazionale a cura di Franceschini, A. & Marras (Carlo Delfino Editore). Università degli studi, Sassari (IT)
Michelot A., Bréda N., Damesin C., Dufrêne E., 2011. Differing growth responses to climatic variations and soil water deficits of Fagus sylvatica, Quercus petraea and Pinus sylvestris in a temperate forest. Forest Ecology and Management, 265: 161-171
Moore B., G. Allard, 2008. Climate change impacts on forest health. Forest Health and Biosecurity Working Paper FBS/34E. Rome, FAO.
Moriondo F., Menguzzato G., Maresi G., Danti R., 1999. Un caso di moria del faggio nel bosco della Ferdinandea sulle Serre Calabresi. Informatore fitopatologico, 9 : 45-51.
Moriondo F., Mugnai L., 1990. A case of group dying of beech in Italy. Proceedings ‘8th Congress of the Mediterranean Phytopathological Union, , 8th Congress of the Mediterranean Phytopathological Union’, Agadir, Morocco, 28 October - 3 November 1990, pp. 121-122.
Mortsch L.D., 2006. Impact of climate change on agriculture, forestry and wetlands. In Bhatti J., Lal R., Apps, M. & Price, M., eds. Climate change and managed ecosystems, pp. 45–67. Taylor and Francis, CRC Press, Boca Raton, FL, US. Paoletti E., Goggioli V., Maresi G., 1996. Reperti di Biscogniauxia nummularia sul
faggio in Italia. Micologia italiana, 1: 27-35.
Parry M.L., Canziani O.F., Palutikof J.P., van der Linden P.J., Hanson C.E. (eds), 2007. Contribution of Working Group II to the Fourth Assessment Report of the Intergovernmental Panel on Climate Change, 2007. Cambridge University Press, Cambridge, United Kingdom and New York, NY, USA.
Penuelas J., Ogaya R., Boada M., Jump A. S., 2007. Migration, invasion and decline: changes in recruitment and forest structure in a warming-linked shift of European beech forest in Catalonia (NE Spain). Ecography, 30 (6): 829–837. Petrini O., 1991. Fungal endophytes in tree leale. In: Microbial Ecology of leaves
(eds. Andrews J.H., Hirano S.S) Springer, New York: 179-197.
Piovesan G., Biondi F., Di Filippo A., Alessandrini A., Maugeri M., 2008. Drought-driven growth reduction in old beech (Fagus sylvatica L.) forests of the central Apennines, Italy. Global Change Biology, 14 (6): 1265-1281.
12
Rodriguez R.J., White J.F., Arnold A.E., Redman R.S., 2008. Fungal endophytes: diversity and functional roles. New Phytologist, 182: 314-330.
Schicchi R., Marino P., Raimondo F.M., 2009. Esperienze finalizzate alla gestione conservativa dei boschi di faggio in Sicilia. Atti del Terzo Congresso Nazionale di Selvicoltura. Taormina (ME), 16-19 ottobre 2008. Accademia Italiana di Scienze Forestali, Firenze, pp. 909-914.
Schröter D., Cramer W, Leemans R., Prentice I.C., Araújo M.B., Arnell N.W., Bondeau A., Bugmann H., Carter T.R., Gracia C.A.,. de la Vega-Leinert A.C, Erhard M., Ewert F., Glendining M., House J.I., Kankaanpää S., Klein R.J.T., Lavorell S., Linder M., Metzger M.J., Meyer J., Mitchell T.D., Reginster I., Rounsevell M., Sabaté S., Sitch S., Smith B., Smith J., Smith P., Sykes M.T.,. Thonicke K, Thuiller W., Tuck G., Zaehle S., Zierl B., 2005. Ecosystem service supply and vulnerability to global change in Europe, Science, 310: 1333 -1337 Schulz B., Boyle C., 2005. The endophytic continuum. Mycological Research, 109:
661–687
Sidoti A., Granata G., 2003. Biscogniauxia nummularia primary pathogen on beech. Journal of Plant Pathology, 85 (4, Special issue): 317.
Sieber, T., 2007. Endophytic fungi in forest trees: are they mutualistic?. Fungal Biology Reviews, 21: 75-89
Stone J.K., Polishook J.D., White J.R.J., 2004. Endophytic fungi. In: Mueller G., Bills G.F., Foster M.S., eds. Biodiversity of fungi: inventory and monitoring methods. Burlington, MA, USA: Elsevier, 241–270.
Stone, J. K., 1987. Initiation and development of latent infections by Rhabdocline
13 2 – Aims
This study contributes to the aims of the Working Package 2 (WP2) of the European project ‘Biodiversity And Climate Change, A Risk Analysis’ (BACCARA, no 22000325). WP2 objective of is to predict the impact of climate change on tree-associated species diversity and performance. To achieve this general objective WP2 aims to characterize the climate sensitive processes controlling the composition of assemblages of tree-associated species and to assess the risk of tree-associated species composition and performance alteration due to climate change.
In this context the present doctoral thesis focuses on European beech (Fagus
sylvatica L.) phyllosphere fungal community structure variation along climatic
gradients and its response to climatic variables. European beech has been identified as a focal species since it is distributed over wide altitudinal and latitudinal gradients in Italy (from Sicily to the Alps covering ca. 1000 km, from 500 m up to 2000 m a.s.l.) as well as in Europe. Thus beech forests represent excellent ecosystems for studying direct and indirect effects of climate change on forest fungal community. In the present study climatic gradients designed within beech forests are assumed as spatial analogues of climate change. They are exploited to identify the effects of climatic variables on the composition, richness and diversity of endophytic communities and to identify critical climatic conditions driving the shift of endophytes from a latent to a pathogenic phase.
Synthetically the main objectives of this thesis are:
To outline the composition, richness and diversity of endophytes assemblages of healthy/declining forests on the climatic gradients by the use of a culture-based method and to identify the climatic factors upon which they depends (Chapter 1);
To outline the composition, richness and diversity of phyllosphere fungal assemblages of healthy/declining forests on the climatic gradients by the use of
14
high-throughput DNA 454 sequencing (GS FLX Titanium) and to identify the climatic factors upon which they depends (Chapter 2).
15 3 – Samplings on climatic gradients
3.1 – Experimental design 3.1.1 – Study sites
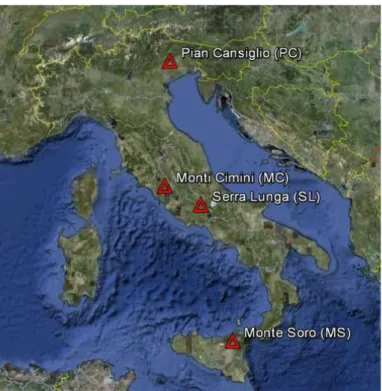
Fungal community analysis has been carried out on four different European beech stands located on the Italian territory (Fig. 3.1.1). According to the Worldwide Bioclimatic Classification System (available at www.globalbioclimatics.org) all the forests considered in this study are within the Temperate Macrobioclimate. Geographic location, stand description and bioclimate/vegetation classifications (tab. 3.1.1) of any site is provided below:
Fig. 3.1.1: Map showing the location of the 4 sites sampled in this study. Image created using Google Earth 2011 Tele Atlas, 2011 Europa Technologies, US Dept of State Geographer, 2011 Google.
Pian Cansiglio (PC) is a karst bowl-shaped plain located on alpine foothills in northeastern Italy (Belluno-Treviso, Veneto, lat. 46° 3' 54.00" N). Around the plain a pure State-owned beech forest grows between 1250 and 1450 m a.s.l..
16
Climate is strongly affected by the local geomorphology as moist and cold air coming from the sea collects in the bottom of the plain turning the climate to continental (thermal inversion) and allowing to species such as spruce and fir to grow at altitudes around 1000 m (Hofmann, 1991; Cescatti & Piutti, 1997). As continental features increase steeply at lower altitudes, in the bottom of the karst sinkholes only cushion plants and short shrubs can grow. Differently, at higher altitudes, beech can form a highly productive high-forest (with an average growing stock of about 287 m3/ha and a mean annual increase of 4.46 m3/ha, Caudullo et al., 2003) as climate becomes soon oceanic (Rivas-martinez
et al., 2004; Hofmann, 1991). Above 1250 m beech finds optimal growing
conditions as fog is year-round present, precipitation is abundant and evenly dispersed through the year (on the average 1800-1900 mm/year mm) and an annual average temperature is 5.1°C (Stergulc, 2000; Caudullo et al., 2003, Nascimbene et al., 2007) even though minimum temperatures during severe years may reach -35°C (Caudullo et al., 2003). The prevailing parent rock is limestone. Soils are well developed and well drained brown earths, characterized by zoogenic humus (Marchisio et al., 1994).
Monti Cimini (MC) is a volcanic complex in centre-western Italy (Viterbo, Latium, lat. 42° 24' 27.501" N) encompassing the extinct Cimino Volcano and the Vico caldera, which originated after the volcanic cone collapsing and now occupied by the Vico lake. Beech stands grow on Fogliano mountain, the highest peak (961 m a.s.l.) around the lake, on Venere Mountain (851 m a.s.l.), a volcanic cone within the Vico crater and on Cimino Mountain (1,053 m a.s.l.). Beech grows from 507 m upward, such an altitude is largely underneath the normal lower altimetric limit of this species (therefore they are called ‘depressed’ beech forests; Hofmann, 1991; Del Favero, 2010) in the Apennines (Montelucci, 1956). This is due to the proximity of the Tyrrhenian sea that keep the annual temperature range down and to the effect of occult
17
precipitation and upslope fogs formed by western winds blowing up the sides of the mountains (Hofmann, 1991). In Cimino Mountain beech ranges between 950 and 1050 m a.s.l., it forms an old-growth secondary forest as timber logging was stopped 1949 to preserve the social aesthetic value of the forest (Lo Monaco, 1983; Piovesan, 2008). Today the forest is in the demographic transition stage (Frelich, 2002) progressively turning from a single-layer canopy to a multi-cohort structure (Piovesan et al., 2011). The dominant even-aged cohort can rise to 40 m in height and it is 120-150 years old (Piovesan, 2008), it suffers natural mortality allowing the regeneration establishment. Also Venere Mountain (beech range from 550 to 850 m a.s.l.) and Fogliano Mountain beech forest were left develop naturally after intensive exploitation, therefore dominant cohort is now 150 years old, with sporadic individuals reaching 200 years old. Also in these cases forest showed a sudden reactivation of natural processes leading to structure diversification especially in Venere Mountain where the fertile deep volcanic soil makes growth rate very high (Piovesan et al., 2011).
Serra Lunga (SL) is a mountain slope located within a 3,000 ha community forest that is part of a wider forest area, included in the external belt of the Abruzzi National Park in central Italy (Collelongo, L’Aquila, Abruzzi, lat.41° 53' 11.41" N). The environmental and structural conditions of the stand are representative of central Apennine beech forests. Reported mean annual temperature range between 6.9 and 10°C while annual precipitation between 1,230 and 1300 mm/year at the upper forest limit (Petriccione, 2002; Scartazza
et al., 2004). At the lower altimetric (1300 m a.s.l.) limit beech stand
encounters mixed forest with hornbeam, European turkey oak and maples. On the other hand at the highest altitudes (1550 m) upper limit has been lowered by grazing. The State-owned Serralunga beech forest has been exploited intensively in the past for firewood production and cattle grazing, therefore
18
coppicing was a widespread woodland management method. But nowadays, as human pressure has lowered conversion of old coppices to high-forest is increasing especially in the most fertile sites.
Monte Soro (MS) is in northern Sicily at the southernmost limit of Europe beech range (Nebrodi mountains, Cesarò, Messina, Sicily, lat. 37° 53' 60.00" N). The Region-owned beech forest grows on Monte Soro between 1200 m and the mountain peak at 1847 m a.s.l.. Forest has been overexploited with grazing and 15-year-cycle-coppicing until 1993 when a Regional Park was instituted. Since 2004 silvicultural practices aimed to convert part of the old 30/50-years-beech coppice with standards on the N slope to an high-forest divided it in multi-aged compartments. The mean annual precipitation in this site is about 1460 mm, but sometimes it can be also much more exiguous as in 1990 (1064 mm). Beech can grow at such low latitudes thanks to the lingering snow, to the occult precipitation formed by cold air coming from the Tyrrhenian sea and to the sandstones bedrock that has an high moisture retaining capacity (Schicchi et al., 2009).
Since 1990 Monte Soro beech forest has been reported to be affected by serious decline associated with infections caused by the ascomycete
Biscogniauxia nummularia (Bull. :Fr.) O. Kunze. The most severe symptoms
occur in the southern slope especially in lowest part of beech vertical distribution. Probably this is due to the prolonged drought and high temperatures observed over the last decades making F. sylvatica more susceptible to the disease and to the soil with low water retention capacity (low organic matter content). In the summer trees exhibited foliar yellowing, microphylly, wilting and drop, stem cankers, black carbonaceous stromata bursting through the bark. Decline can cause the death in most cases within one or two years of one or more sprouts of the same stump or even of the entire stump in the most severe cases. Generally growth after declining episodes is
19
not recovered (Granata & Whalley, 1994; Mazzaglia et al., 2002; Sidoti & Granata, 2003; Granata & Sidoti, 2004).
Tab. 3.1.1: Bioclimate (Rivas-martinez et al., 2004) and vegetation (Ozenda & Borel, 2000)
classifications of the four European beech stands considered in the present study
Study
site Bioclimate
Thermoclimatic
Belts Climatic forest type
Geobotanical divisions (Rivas-martinez et al.,
2004a)
(Rivas-martinez
et al., 2004b) (Ozenda & Borel, 2000)
(Ozenda & Borel, 2000) PC Temperate Oceanic Oro-temperate
Lower and mid mountain: collinean and montane vegetation belts Alpine domain MC Temperate Oceanic Submediterranean Supra-submediterranean Supra-Mediterrannean vegetation belt Mediterranean domain SL Temperate Oceanic Supra-temperate Supra-Mediterrannean
vegetation belt Mediterranean domain MS Temperate Oceanic Submediterranean Supra-submediterranean
Monti- and Alti-
Mediterranean vegetation belt
Mediterranean domain
3.1.2 – Altitudinal gradients
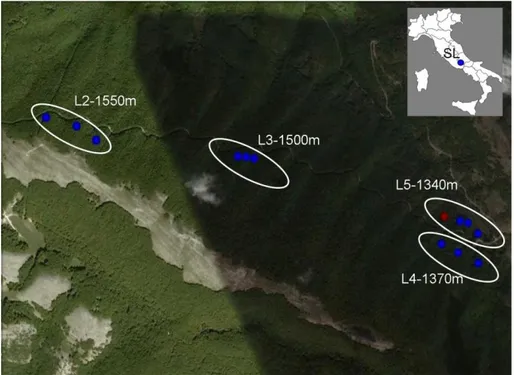
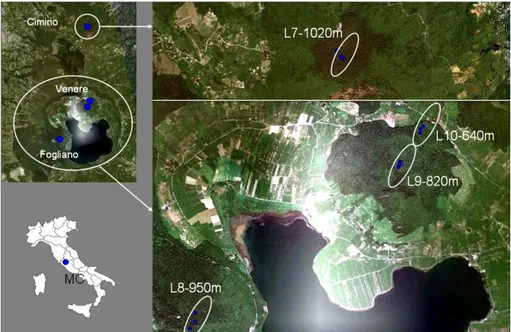
Fungal community analysis has been conducted on two altitudinal gradients in central Italy, the gradient ‘AG2010’ (Fig. 3.1.2.1) was located in the site SL, while the gradient ‘AG2011’ (Fig. 3.1.2.1) was located in MC. Each gradient included 4 altitudinal levels (Tab. 3.1.2.1) distributed on the symptomless pure beech forest making the gradient as wide as possible. While in SL all the four levels (L2, L3, L4 and L5) were on the same slope resulting in a 210-m-gradient, in MC it had been necessary to locate the levels on Cimino mountain (L7), on Fogliano mountain (L8) and on Venere mountain (L9 and L10) to obtain a 380-m-gradient. Gradients AG2010 and AG2011 were sampled in summers 2010 and 2011 respectively.
At each level three groups (plots) of five trees were chosen for samplings. Their d.b.h. ranged between 5 and 20 cm. When trees of the dominant cohort had too large diameters, young trees from regeneration were included in the plots. Distance between plots ranged between 50 and 200 m according to local slope and stand features. One extra-plot (SL13) stand was added and designed in a beech declining
20
area. In fact during the early on-the-spot investigation in SL, a notable beech decline has been observed at the lower limit of its vertical distribution (1300-1350 m a.s.l.). Observable symptoms were similar to those described for strip-cankering cause by
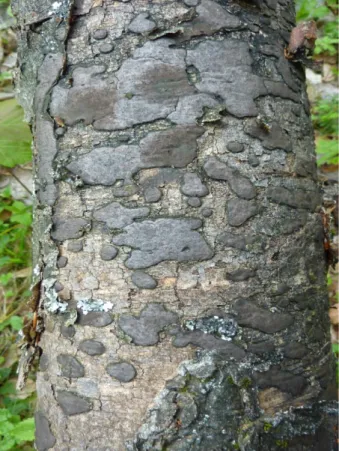
Biscogniauxia nummularia (Bull. :Fr.) O. Kunze (Granata & Whalley, 1994; Hendry et al., 1998). Diseased trees showed elongated cankers on stems (Fig. 3.1.2.3a),
leaves yellowing, microphylly and wilting, progressive stem and branches death from the top of the tree downward, death of the whole tree (Fig. 3.1.2.3c), black stromata bursting from the bark of death wooden tissues (Fig. 3.1.2.3b). The diseased trees showed also damages by other pests, e.g. abundant Mikiola fagi galls on leaves (Fig. 3.1.2.3d) and Kretzschmaria deusta fruit bodies bursting from necrotic wooden tissues. The plot SL13 included 5 symptomatic trees of this declining area.
Fig. 3.1.2.1: Map showing the location and altitude of the 4 levels (L2, L3, L4, L5) of the altitudinal gradient (AG2010) sampled in 2010 in SL site. Blue dots represent plot in healthy beech stand whereas the red dot the extra-plot in the declining forest. Image created using Google Earth 2011 and Microsoft Office Power Point 2003.
21
Fig. 3.1.2.2: Map showing the locations and altitude of the 4 levels (L7, L8, L9 and L0) of the altitudinal gradient (AG2011) on MC site. Image created using Google Earth 2011 and Microsoft Office Power Point 2003.
Tab. 3.1.2.1: Altitudinal levels plots and altitude of each altitudinal gradient AG2010 and AG2011 AG2010 AG2011 Level name Plots Altitude (m a.s.l.) Level name Plots Altitude (m a.s.l.) L2 SL4, SL5, SL6 1550 L7 MC1, MC2, MC3 1020 L3 SL1, SL2, SL3 1500 L8 MC4, MC5, MC6 950 L4 SL7, SL8, SL9 1370 L9 MC7, MC8, MC9 820 L5 SL10, SL11, SL12, 1340 L10 MC10, MC11, MC12 640 SL13 (declining) 1340
Climatic data were obtained from the Latium Regional Agency for Agriculture Development & Innovation (ARSIAL) and from the National Network for the Control of Forest Ecosystems (CONECOFOR) databases for site MC and SL respectively. In the former case monthly data for the years 2004-2011, recorded in Soriano nel Cimino (Poggio di Chia, 309 m a.s.l.) weather station, are available online at ARSIAL website (http://www.arsial.it/portalearsial/default.htm). In the latter case daily data for the years 2000-2010, recorded in Collelongo weather station (1560 m a.s.l.), were kindly released by CONECOFOR (Fig. 3.1.3.2).
22 Fig 3.1.2.3a: Strip canker (Biscogniauxia
nummularia) on a beech tree in the
declining plot SL13 (Collelongo, Abruzzi). May 2010
Fig 3.1.2.3b: Black stromata (Biscogniauxia
nummularia) bursting from tha bark of a
death beech stem in SL13. May 2010
Fig 3.1.2.3c: Declining beech trees in SL at 1300 m a.s.l. At this altitude beech is less
competitive than hornbeam (Ostrya
carpinifolia) and maples (Acer opalus, Acer campestre). Forest September 2010
Fig 3.1.2.3d: Mikiola fagi galls resulted very abundant on beech leaves in SL13. September 2010
23 3.1.3 – Latitudinal gradient
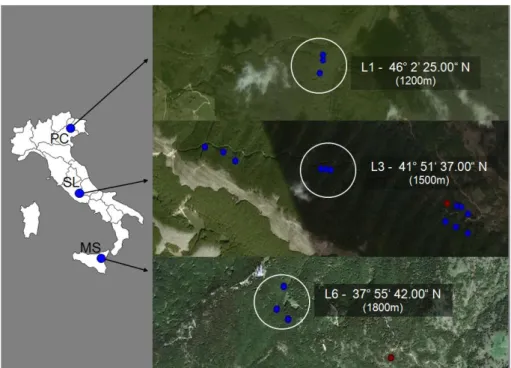
A similar criterion was used to design the latitudinal gradient (LG2010, Fig. 3.1.3.1) that was sampled in summer 2010. In this case the gradient included 3 latitudinal levels covering on the whole 920 kilometres, each one made up of 3 plots located at the same altitude in the healthy forest. The northern level (L1) is in PC site, the central level is in SL (L3, belonging to AG2010 too) and the southern level (L6) is in MS. Levels latitude, altitude and plots name are provided in Tab. 3.1.3.1. As well as for altitudinal gradient an extra-plot (MS4, 1680 m a.s.l) in the MS declining forest area (Granata & Whalley, 1994; Mazzaglia et al., 2002; Sidoti & Granata, 2003; Granata & Sidoti, 2004) had been added to samplings.
Fig. 3.1.3.1: Map showing the locations and latitude of the 3 levels (L1, L3, L6) of the latitudinal gradient (LG2010) along Italy. Blue dots represent plots in healthy beech stand whereas the red dots the extra-plots in the declining forest. Image created using Google Earth 2011 and Microsoft Office Power Point 2003.
24
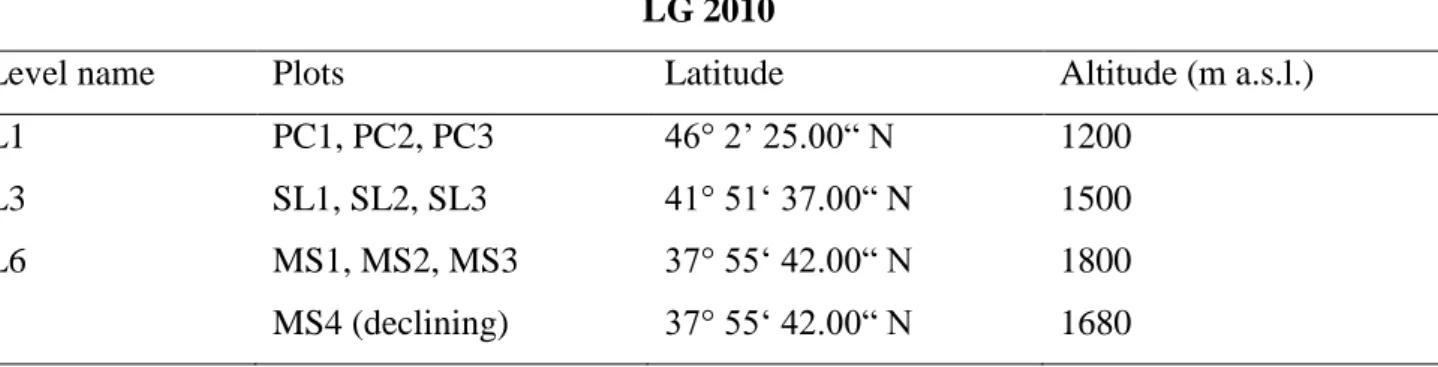
Tab. 3.1.3.1: Altitude, latitude and plots of the 3 levels of the latitudinal gradient LG2010 LG 2010
Level name Plots Latitude Altitude (m a.s.l.)
L1 PC1, PC2, PC3 46° 2’ 25.00“ N 1200
L3 SL1, SL2, SL3 41° 51‘ 37.00“ N 1500
L6 MS1, MS2, MS3 37° 55‘ 42.00“ N 1800
MS4 (declining) 37° 55‘ 42.00“ N 1680
Fig. 3.1.3.2: Bagnouls-Gaussen diagrams of the 4 study site for the years 2004-2010. Climatic data were recorded by CONECOFOR in PC and SL, by Sicilian Regional Department of Water and Waste - Water Observatory Service in MS and by Latium Regional Agency for Agriculture Development & Innovation (ARSIAL) in MC. Intersection of the two lines (solid lines indicate average annual precipitation trends, dashed lines indicate average annual temperature trends) indicate drought conditions. MC and MS weather stations are below the lower limit of beech vertical range, so they are likely to accentuate drought.
25
Daily climatic data related to the years 2004-2011 were given by CONECOFOR for PC (Vittorio Veneto weather station, 1100 m a.s.l.), whereas monthly records for the years 2000-2011 for MS site where requested to Sicilian Regional Department of Water and Waste - Water Observatory Service (Cesarò weather station, 1100 m a.s.l.).
3.2 – Samplings and pre-processing
Samplings on gradients were carried out following the calendar reported in Tab. 3.2.1. From any tree, 3 30-cm-twigs bearing at least 5 leaves were collected using a 3-m-handle telescopic tree pruner. Contact of the samples with the ground was accurately avoided to prevent any contamination by soil-borne organisms. Each twig base was wrapped with Parafilm® (Pechiney Plastic Packaging) to minimize water loss and packed in a plastic bag. Finally samples were quickly delivered to Forest Pathology laboratory in a refrigerated bag. From each of the twig, kept at 4°C until pre-processing beginning, 5 leaves and one 6-cm-twig-segment (ca. 5 mm in diameter) were chosen. Sterilization was carried out following the protocol of Fisher
et al. (1986): EtOH 75% 1 min, NaClO 3% 1 min, EtOH 75% 1 min, rinse with
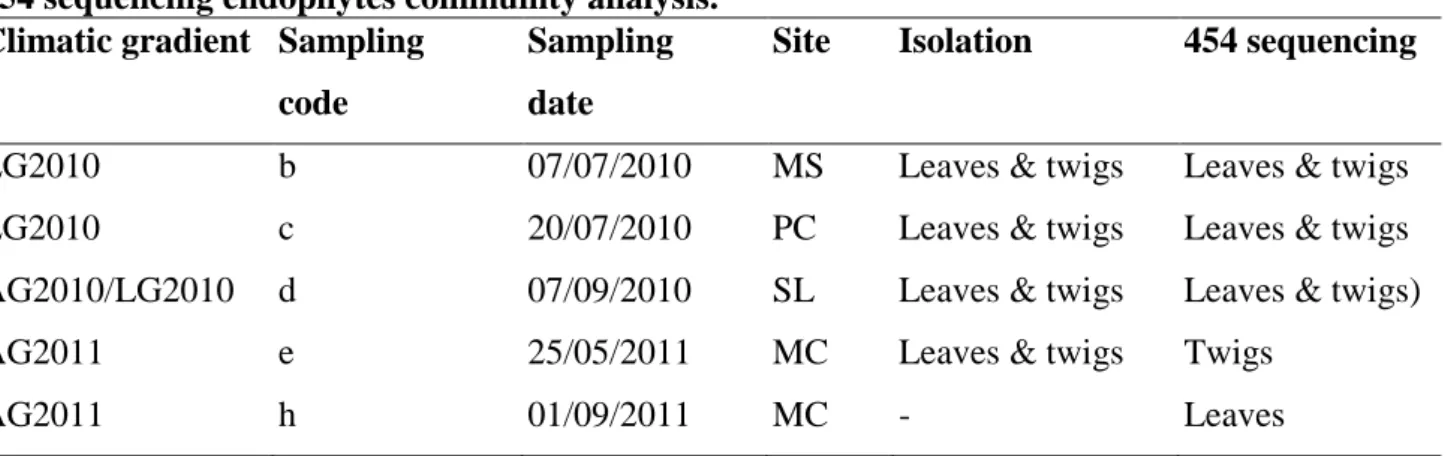
autoclaved distilled water. This protocol is effective in surface sterilization (no colonies develop after imprinting treated tissue on Potato Dextrose Agar medium) without affecting endophyte community. After sterilization, a 3-cm central portion of any 6-cm-twig-segment was cut out and the distal portions were discarded. Then any leaf and any 3-cm twig were split longitudinally with a scalpel, half of this material was destined to culture-dependent community analysis and the remaining half to culture-independent analysis. An exception was made in respect to this design for 2011 samplings as leaves collected in the sampling ‘e’ had not be used for 454 sequencing analysis but replaced with sampling ‘h’ leaves (Tab. 3.2.1).
26
Tab. 3.2.1: Samplings on climatic gradients have been carried out in summer 2010 and spring/summer 2011. Collected samples (leaves/twigs) were destined to culture-based and/or 454 sequencing endophytes community analysis.
Climatic gradient Sampling code
Sampling date
Site Isolation 454 sequencing
LG2010 b 07/07/2010 MS Leaves & twigs Leaves & twigs LG2010 c 20/07/2010 PC Leaves & twigs Leaves & twigs AG2010/LG2010 d 07/09/2010 SL Leaves & twigs Leaves & twigs) AG2011 e 25/05/2011 MC Leaves & twigs Twigs
AG2011 h 01/09/2011 MC - Leaves
References
Caudullo G., De Battisti R., Colpi C., Vazzola C., Da Ronch F., 2003. Ungulate damage and silviculture in the Cansiglio Forest (Veneto Prealps, NE Italy). Journal for Nature Conservation, 10: 233-241.
Cescatti, A., Piutti, E.,1998. Silvicultural alternatives, competition regime and sensitivity to climate in a European beech forest. Forest Ecology and Management, 102 (2–3): 213–223
Del Favero R., 2010. I boschi delle regioni dell’Italia centrale: tipologia, funzionamento, selvicoltura. CLEUP. Padova, 425 pp.
Fisher P.J., Anson A.E., Petrini O., 1986. Fungal endophytes in Ulex europaeus and
Ulex gallii. Transactions of the British Mycological Society, 96: 153–193.
Granata G., Sidoti A., 2004. Biscogniauxia nummularia: pathogenic agent of a beech decline. Forest Pathology, 34: 363-367.
Granata G., Whalley A. J.S., 1994. Decline of beech associated to Biscogniauxia
nummularia in Italy. PETRIA – Giornale di Patologia delle Piante., 4 (2):
111-116.
Hendry S. J., Lonsdale D., Boddy L., 1998. Strip-cankering of beech (Fagus
sylvatica): Pathology and distribution of symptomatic trees. New Phytologist,
140: 549-565
Hofmann A., 1991. Il faggio e le faggete in Italia. Collana Verde 81, Corpo Forestale dello Stato, Roma
Lo Monaco A., 1983. Proposte per un piano di valorizzazione naturalistica della “Faggeta” del Monte Cimino (Viterbo). Thesis, Faculty of Agraria, Università di Firenze, Italy.
Marchisio C., Cescatti A., Battisti A., 1994. Climate, soils and Cephalcia arvensis outbreaks on Picea abies in the Italian Alps. Forest Ecology and Management, 68: 375–384
Mazzaglia A., Librandi I., Granata G., Colasanti V., Anselmi N., 2002. Incidenza di
27
boschi colpiti e non da deperimento (The incidence of endophytic Biscogniauxia
nummularia on Fagus sylvatica in declining and healthy forests), pp. 61-72, in
L’endofitismo di funghi e batteri patogeni in piante arboree e arbustive, Atti del Convegno Nazionale a cura di Franceschini, A. & Marras (Carlo Delfino Editore). Università degli studi, Sassari (IT)
Montelucci G., 1956. Aspetti della Faggeta depressa del Monte Fogliano (Lago di Vico). Nuovo Giornale Botanico Italiano, vol. LXIII
Nascimbene J., Marini L., Nimis P.L., 2007. Influence of forest management on epiphytic lichens in a temperate beech forest of northern Italy. Forest Ecology and Management, 247: 43-47
Ozenda P., Borel J.-L., 2000. An ecological map of Europe: why and how? Comptes Rendus de l'Académie des Sciences, Paris, Sciences de la vie / Life Sciences 323: 983–994
Petriccione B., 2002. Survey and assessment of vegetation in the CONECOFOR Permanent Plots. Journal of Limnology, 61 (1): 19-24.
Piovesan G., Alessandrini A., Biondi F., Di Filippo A., Schirone B., Ziaco E., 2011. Bioclimatology, growth processes, longevity and structural attributes in an Italian network of old-growth beech forests spreading from the Alps to the Apennines. Pp. 173-192 in Knapp H.D., Fichtner A. (eds.), 2011. Beech Forests: Joint Natural Heritage of Europe, BfN-Skripten, Vol. 297, Federal Agency for Nature Conservation, Bonn, Germany.
Piovesan G., Biondi F., Di Filippo A., Alessandrini A., Maugeri M., 2008. Drought-driven growth reduction in old beech (Fagus sylvatica L.) forests of the central Apennines, Italy. Global Change Biology, 14 (6): 1265-1281
Rivas-Martínez S., Penas A., Díaz T. E., 2004a - Bioclimatic Map of Europe, Bioclimates. Cartographic Service. University of León, Spain. (www.globalbioclimatics.org)
Rivas-Martínez S., Penas A., Díaz T. E., 2004b - Bioclimatic Map of Europe, Thermoclimatic Belts. Cartographic Service. University of León, Spain. (www.globalbioclimatics.org)
Scartazza A, Mata C, Matteucci G, Yakir D, Moscatello S, Brugnoli E., 2004. Comparisons of δ13C of photosynthetic products and ecosystem respiratory CO2 and their responses to seasonal climate variability. Oecologia, 140: 340–351. Schicchi R., Marino P., Raimondo F.M., 2009. Esperienze finalizzate alla gestione
conservativa dei boschi di faggio in Sicilia. Atti del Terzo Congresso Nazionale di Selvicoltura. Taormina (ME), 16-19 ottobre 2008. Accademia Italiana di Scienze Forestali, Firenze, pp. 909-914.
Sidoti A., Granata G., 2003. Biscogniauxia nummularia primary pathogen on beech. Journal of Plant Pathology, 85 (4, Special issue): 317.
Stergulc F., 2000. Piano di assestamento della foresta regionale del Cansiglio orientale, 2000-2011. Udine, I: Tecnoforest associate.
28
4 – Chapter 1: analysis of biodiversity of European beech endophytes community assemblages detected along climatic gradients: culture-dependent method
4.1 – Materials and methods
4.1.1 – Endophytes isolation from beech leaves and twigs
After surface-sterilization (see paragraph 3.2), from each half-leaf, 2 fragments of tissue (ca.10 mm2) were cut from the upper and lower part of the leaf blade (avoiding edges) and placed on Potato Dextrose Agar added with streptomycin 0.06% (PDS). Similarly, after sterilization, each half-twig was divided in 5 segments (about 6 mm long) and placed on PDS. According to this procedure from each leaves-sample (5 half-leaves) ten fragments were obtained and plated on 2 Petri dishes (5 each). Twigs segments (5) were plated in one Petri dish. Petri dishes were incubated at 25°C in the dark for 3-4 weeks. Growing of fungal colonies on PDS was checked every 2-3 days and new colonies isolated progressively. Finally isolates were sorted in morphotypes according to their microscopic and/or macroscopic features (colony shape, height and colour of aerial hyphae, base colour, growth rate, surface texture, depth of growth into medium).
4.1.2 – DNA extraction, amplification and sequencing
Mycelium was harvested from one randomly chosen culture of each morphotype. Mycelium was frozen at -20°C, freeze-dried (Lyovac GT2, Leybold Heraeus, Hiirth, Germany) and pestled in a mortar with liquid nitrogen. DNA was purified from 20 mg of powdered mycelium (DNeasy® Plant Mini Kit, Qiagen, Valencia, CA, USA). DNA quality was then evaluated by electrophoresis through 1.5% agarose gels containing 1xTBE buffer and 0.005% ethidium bromide.
Polymerase Chain Reactions (PCR) was performed in MultiGeneTM Thermal Cycler TC9600 (Labnet International Inc., Edison, NJ, USA.) using MyTaq TM HS Mix (Bioline, USA Inc.) and Internal Transcribed Spacer region primers ITS1 (5’- TCC GTA GGT GAA CCT GCG G-3’) and ITS4 (5’-TCC TCC GCT TAT TGA TAT
29
GC-3’, White et al, 1990). The PCR reactions were carried out according to MyTaq TM
HS Mix manufacturer’s protocol recommending for 50 µl reaction the following reaction set-up: 25 µl MyTaq TM HS Mix (2x), 1 µl primers (20 µM each), 200 ng template and water (ddH2O) up to 50 µl and the following cycling conditions: initial denaturation 95°C for 1 min (1 cycle), denaturation 95°C for 15 s, annealing 55°C for 15 s, extension 72°C for 10 s (25-35 cycles). PCR reactions were carried out in 25µl volume and 35 reaction cycles. PCR products were afterwards checked by electrophoresis and purified by PEG precipitation (Applied Biosystems, 1994). Then amplicons were sent to Macrogen for sequencing. Consensus sequences were obtained by forward and reverse sequences alignment (BioEdit Sequence Alignment Editor, version 7.0.5.3. Hall, 1999).
4.1.3 – OTUs clustering
Morphotypes sequences were clustered in Operational Taxonomic Unit (OTU) after the elimination of the conserved nSSu (18S) and nLSU (28S) residual portions and the intercalary 5.8S gene, this was necessary as the residual portions of the genes left in the ITS sequences may skew sequence similarity searches involving BLAST (Altschul et al. 1997, Nilsson et al., 2010; Unterseher & Schnittler, 2010). Sequences were firstly aligned with Geneious Pro 5.5.6 (Biomatters Ltd., Auckland, New Zealand) then the ITS1 and ITS2 sequences of each morphotype were manually identified, extracted and concatenated together. As a result for any morphotype a sequence containing only highly variable ITS regions was obtained.
OTUs were roughly assessed using a 98.5% similarity percent identity and requiring 75% overlap in sequence length in the pairwise alignment (BlastClust, available online at http://toolkit.tuebingen.mpg.de/blastclust). These cut-off thresholds resulted the most appropriate as they included in the same OTU sequences of morphotypes having similar cultural characteristics exclusively. Taxonomic classification of the longest sequence (seed) of any OTU was assessed by comparing sequences with those deposited in GenBank, with the BLASTN algorithm and with a phylogenetic analysis. BLAST matches were accepted only when they had more than 90%
30
similarity in respect of the queried sequence over at least 90% of the query length. In some cases OTU sequences were below this threshold or did not match any annotated GenBank accession. A phylogenetic analysis was therefore carried out to assign these unmatched sequences at least to order level. Phylogenetic analysis was also necessary to assign those sequences led to ambiguous taxonomic assignment by the multiple matching with differently-annotated accessions. Bootstrap consensus trees inferred from 1000 replicates were elaborated using MEGA 5 (Pennsylvania State University, University Park, PA, USA) with the Neighbor-Joining method. A preliminary phylogenetic analysis was conducted with entire OTUs sequences to check the accuracy of BLAST matches and to place unmatched OTUs at least in a taxonomic phylum and class. Therefore analysis was carried on within each class using OTUs ITS1+ITS2 sequences that are appropriate for measuring close genealogical relationships only. Annotated sequences (generally the closest teleomorph matches of OTUs ITS1+ITS2 sequences) were downloaded from GenBank nucleotide collection and included in the trees as annotated references.
Index Fungorum of the CABI BioScience databases (www.indexfungorum.org) was used to resolve any discrepancies in the OTUs nomenclature and taxonomy.
4.1.4 – Climatic data elaboration
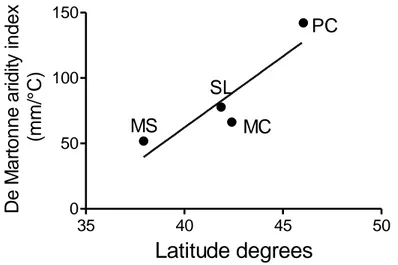
Temperatures data for each latitudinal level were adjusted in relation to level altitude assuming a 0.5°C/100 m lapse rate (Pezzi et al., 2008). Average annual temperature and precipitation of the year before samplings (ending the day before each sampling date) were inferred from available data and used in De Martonne aridity index computation Im was computed using the formula Im= P/(T+10) for each study site (where P = annual average rainfall in mm, T = annual average temperature in degrees centigrade).
4.1.5 – Statistic analysis
Data elaboration was performed with Microsoft Excel 2007 (Microsoft Corp., Redmond, USA), SYSTAT 12 (Systat Software, Inc., Chicago, IL, USA), GraphPad
31
Prism 4 (GraphPad, San Diego, CA, USA). PAST 2.06 (http://folk.uio.no/ohammer/past/index.html) was used for species accumulation curve construction (Krebs algorithm; Krebs, 1989) and diversity (Shannon_H), dominance (Berger-Parker), evenness (Simpson_1-D) and richness (Menhinick) indexes calculation.
4.2 – Results
4.2.1 – General results
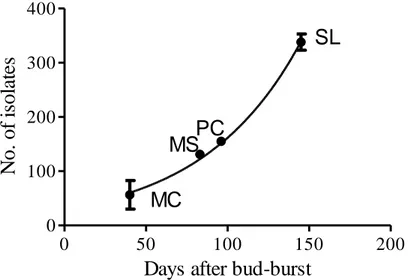
De Martonne index (Fig. 4.2.1.1) inferred from climatic data of the four study sites, resulted to increase with latitude. Isolation frequency from leaves collected in different samplings increased exponentially (Fig. 4.2.1.2) from the end of May to September. Differently twig isolation frequency resulted irrespective of the sampling date. 35 40 45 50 0 50 100 150 MS SL MC PC Latitude degrees D e M a rt o n n e a ri d ity in d e x ( m m /° C)
32 0 50 100 150 200 0 100 200 300 400 MC SL MSPC
Days after bud-burst
N o . o f i so la te s
Fig. 4.2.1.2: Leaves isolation frequency resulted highly correlated with the time elapsed from bud-burst (assumed on 15 April) and sampling date on the 4 study sites..
Healthy forest
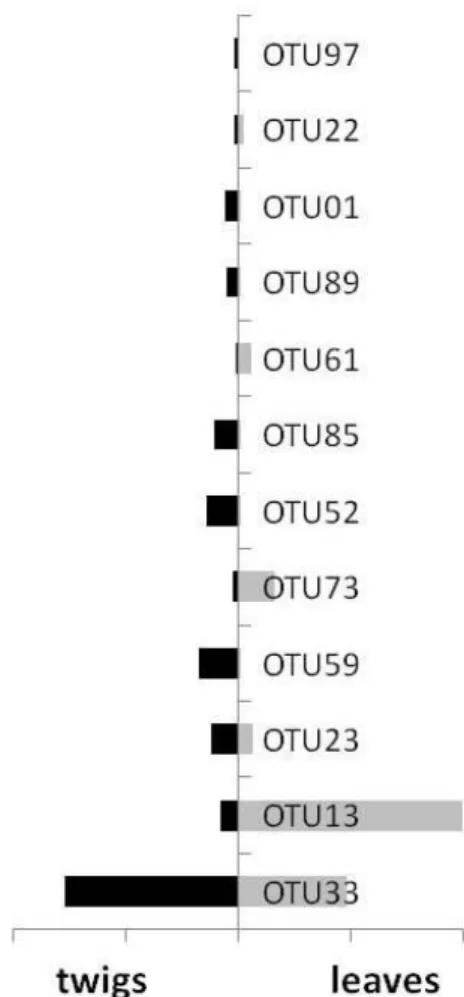
Overall 150 healthy beech trees were investigated for the endophytes community analysis with culture–dependent method. In all 3638 colonies were isolated from 450 twigs (2250 twig-segments analyzed) and 450 5-leaves-groups (4500 leaf-fragments). Colonies were recovered almost evenly from leaves (51.2% total colonies) and twigs (48.8%) Isolates were grouped in 131 morphotypes according to their macroscopic and microscopic morphology. One ITS consensus sequences per morphotypes with a length ranging from 450 to 700 bp was obtained, then all sequences were grouped in 91 OTUs using the 98.5% similarity proxy. Taxonomic classification of the longest sequence (seed) of each OTU was assigned for all OTUs at order level, for 83 OTUs to family level (6 OTUs in incertae sedis families) and for 80 OTUs to genus level (Tab. SM1). Five OTUs remained unmatched after their BLAST against GenBank nucleotide collection, their taxonomic position (order level) was therefore inferred from phylogenetic analysis. OTUs frequency had a J-shaped distribution with a few dominant OTUs and a long tail of low-frequent OTUs (e.g. the 12 OTUs shown in Fig. 4.2.1.3 represent 93% of total isolates). Endophytes assemblage richness resulted
33
higher in twigs, where 72 OTUs were isolated than in leaves (47 OTUs). Only the 31% of the OTUs was shared by both the tissues (Fig. 4.2.1.3). Isolates from leaves belonged exclusively to Ascomycota phylum whereas rare isolates belonging to
Basidiomycota and Zygomycota were isolated from twigs also. Sordariomycetes and Dothideomycetes were the most represented classes in both the tissues (79% and 19%
of total isolates respectively) including 49 OTUs (belonging to 7 orders and 16 families) and 27 OTUs (belonging to 9 families of Pleosporales) respectively (Fig. 4.2.1.4a).
Fig. 4.2.1.3: distribution of the most common OTUs in beech twigs (black) and leaves (grey). Most of the total OTUs (48%) were found to colonize exclusively the woody tissues whereas only the 21% resulted foliar-specific
34
Fig. 4.2.1.4a: Endophytes taxonomic classes abundance in leaves and twigs. So=
Sordariomycetes, Do= Dothideomycetes, Pe= Pezizomycetes, Le= Leotiomycetes, Ag=
Agaricomycetes (Basidiomycota), Eu= Eurotiomycetes, I.s.= Incertae sedis
Fig. 4.2.1.4b: Endophytes taxonomic orders abundance in leaves and twigs. Xy=Xylariales, Pl=Pleosporales, Di=Diaporthales, Co=Coniochaetales, Hy=Hypocreales, So=Sordariales, Ca=Capnodiales, He=Helotiales.
Fig. 4.2.1.4c: Endophytes taxonomic families abundance in leaves and twigs. Xy=Xylariaceae, Di=Diaporthaceae, Pl (an.)=anamorphic Pleosporaceae, Pl=Pleosporaceae,