Development/Plasticity/Repair
Appraisal of Brain Connectivity in Radiologically Isolated
Syndrome by Modeling Imaging Measures
Antonio Giorgio,
1Maria Laura Stromillo,
1X
Alessandro De Leucio,
1Francesca Rossi,
1Imke Brandes,
1,2Bahia Hakiki,
3Emilio Portaccio,
3Maria Pia Amato,
3and Nicola De Stefano
11Departments of Medicine, Surgery, and Neuroscience, University of Siena, 53100 Siena, Italy,2University of Osnabru¨ck, 49076 Osnabru¨ck, Germany, and 3Department of Neurology, University of Florence, 50121 Florence, Italy
We hypothesized that appraisal of brain connectivity may shed light on the substrate of the radiologically isolated syndrome (RIS), a term
applied to asymptomatic subjects with brain MRI abnormalities highly suggestive of multiple sclerosis. We thus used a multimodal MRI
approach on the human brain by modeling measures of microstructural integrity of white matter (WM) tracts with those of functional
connectivity (FC) at the level of resting state networks in RIS subjects, demographically matched normal controls (NC), and
relapsing-remitting (RR) MS patients, also matched with RIS for brain macrostructural damage (i.e., lesions and atrophy). Compared with NC, in
both RIS subjects and MS patients altered integrity of WM tracts was present. However, RIS subjects showed, at a less conservative
threshold, lower diffusivities than RRMS patients in distinct cerebral associative, commissural, projection, and cerebellar WM tracts,
suggesting a relatively better anatomical connectivity. FC was similar in NC and RIS subjects, even in the presence of important risk
factors for MS (spinal cord lesions, oligoclonal bands, and dissemination in time on MRI) and increased in RRMS patients in two clinically
relevant networks subserving “processing” (sensorimotor) and “control” (working memory) functions. In RIS, the lack of functional
reorganization in key brain networks may represent a model of “functional reserve,” which may become upregulated, with an adaptive or
maladaptive role, only at a later stage in case of occurrence of clinical deficit.
Key words: multiple sclerosis; connectivity; neuroplasticity; radiologically isolated syndrome; resting state networks
Introduction
The term radiologically isolated syndrome (RIS) is applied to
asymptomatic subjects with brain MRI abnormalities highly
sug-gestive of MS (
Okuda, 2009
). A number of MRI studies have
shown that brain tissue damage in RIS shares similarities with
that of MS in terms of white matter (WM) lesions (load and
mapping), atrophy (
De Stefano et al., 2011
;
Amato et al., 2012
),
spinal cord lesions (
Okuda et al., 2011
), cortical lesions (
Giorgio
et al., 2011
), and metabolic changes suggestive of axonal damage
(
Stromillo et al., 2013
).
It is well known that both anatomical and functional
con-nectivity are altered in MS brains (
Filippi et al., 2013
).
Ana-tomical connectivity is defined by the whole set of WM tracts
connecting different gray matter (GM) regions of the brain
and is estimated in vivo from diffusion tensor imaging (DTI;
Johansen-Berg and Rushworth, 2009
). Functional
connectiv-ity is studied by means of resting fMRI and reflects the strength
of correlated neurophysiological activity in different GM
re-gions of the brain, the so-called resting state networks (RSNs;
van den Heuvel and Hulshoff Pol, 2010
). In case of disease,
resting fMRI provides a powerful approach for the study of
neuroplasticity, i.e., the ability of the brain to adapt to injury
through functional changes, without the confounding effect of
task-related performance (
Tomassini et al., 2012
). The need of
mapping neural connections, which convey information across
brain, is prompted by the notion that brain function does not
rely only on individual regions but rather depends on
interac-tion patterns across distributed large-scale networks (
Catani
et al., 2012a
).
MS patients show a distributed pattern of abnormalities in
brain functional connectivity, which are related to the extent
of focal pathology (
Rocca et al., 2012
;
Janssen et al., 2013
;
Cruz-Go´mez et al., 2014
) and to altered anatomical
connec-tivity (
Rocca et al., 2007
;
Roosendaal et al., 2010
;
Hawellek et
al., 2011
). Importantly, such abnormalities turn out to be
clin-ically meaningful, as demonstrated by their association with
physical disability and cognitive impairment (
Rocca et al.,
2010
;
Bonavita et al., 2011
;
Hawellek et al., 2011
;
Faivre et al.,
2012
;
Loitfelder et al., 2012
;
Schoonheim et al., 2012
;
Basile et
al., 2013
;
Janssen et al., 2013
;
Cruz-Go´mez et al., 2014
;
Gam-boa et al., 2014
).
Received June 23, 2014; revised Aug. 20, 2014; accepted Sept. 26, 2014.
Author contributions: M.P.A. and N.D.S. designed research; A.G., M.L.S., A.D.L., F.R., B.H., and E.P. performed research; A.G. and I.B. analyzed data; A.G. and N.D.S. wrote the paper.
E.P. serves on scientific advisory boards for Biogen Idec, Merck Serono, and Bayer Schering and receives research support and honoraria for speaking from Biogen Idec, Merck Serono, Bayer Schering Pharma, Teva Pharmaceutical Industries, Novartis, and Sanofi Aventis. N.D.S. has served on scientific advisory boards, received speaker honoraria, servedasaconsultant,orreceivedresearchsupportfromBioMSMedical,BiogenIdec,BayerScheringPharma,Merck Serono, NeuroRx Research, Novartis, Teva Pharmaceutical Industries, and the Italian Multiple Sclerosis Society. M.P.A. serves on scientific advisory boards for Biogen Idec, Merck Serono, Bayer Schering Pharma, Teva Pharmaceu-tical Industries, and Sanofi Aventis and receives research support and honoraria for speaking from Biogen Idec, Merck Serono, Bayer Schering Pharma, Teva Pharmaceutical Industries , Novartis, and Sanofi Aventis.
Correspondence should be addressed to Dr. Nicola De Stefano, Department of Medicine, Surgery and Neurosci-ence, University of Siena, Viale Bracci 2, 53100 Siena, Italy. E-mail:[email protected].
DOI:10.1523/JNEUROSCI.2557-14.2015
Given the importance of brain connectivity in clarifying the
intimate disease process leading to disability, its appraisal might
help shed light on the processes preceding the clinical
manifesta-tions of MS. Against this background, we sought to investigate
here, through the assessment of brain connectivity at anatomical
and functional levels, the relation between tissue damage and
neuroplasticity in RIS. Specifically, we aimed to assess across the
whole brain of RIS subjects compared with MS patients with
similar macrostructural damage and to healthy people (1)
changes in the microstructural integrity of WM tracts by
tract-based spatial statistics (TBSS) of DTI measures and (2) changes in
RSNs by resting fMRI.
Materials and Methods
Study subjects
We enrolled asymptomatic subjects fulfilling the diagnostic criteria for RIS (Okuda, 2009; n ! 18, 12 females, age ! 40.6 " 10 years; Table 1) and included in previously studied co-horts (De Stefano et al., 2011;Giorgio et al., 2011;Stromillo et al., 2013) and also relapsing-remitting (RR) MS patients matched with RIS subjects for demographics (n ! 20, 12 females, age ! 39.7 " 8 years) and for macrostructural brain damage [T2-weighted lesion volume (LV): 5.4 " 6.6 cm3in RIS, 6.2 " 7.1 cm3in
RRMS, p ! 0.9; T1-weighted LV: 2.3 " 2.5 cm3
in RIS, 2.6 " 2.8 cm3in RRMS, p ! 0.9;
nor-malized brain volume (NBV): 1505 " 13 cm3
in RIS, 1470 " 12 cm3in RRMS; normalized
GM volume (NGMV): 764 " 43 cm3in RIS,
746 " 40 cm3in RRMS, p ! 0.15 for both].
RRMS patients had disease duration ! 5.1 " 2.7 years, Expanded Disability Status Scale ! 1.7 " 1.4, and 18 of 20 were on disease-modifying treatments (DMTs) at study entry. As a third study group, we selected a group of demographically matched normal controls (NC; n ! 20, 12 females, age ! 39.4 " 9 years), made up of laboratory and hospital workers with normal neurological examination, no his-tory of neurological disorder, and no focal WM lesions on brain MRI.
The study received approval from the local ethics committee. Informed written consent was obtained from all subjects.
MRI acquisition
Brain MRI was acquired in all subjects at the NMR Center of the Univer-sity of Siena using a 1.5 T Philips Gyroscan (Philips Medical Systems). A sagittal survey image was used to identify the anterior and posterior commissure (AC and PC). Sequences were oriented in the axial plane parallel to the AC–PC line. A dual-echo, turbo spin-echo sequence (TR/ echo time TE1/TE2 ! 2075/30/90 ms, voxel size ! 1 # 1 # 3 mm) yielded proton density and T2-weighted images. DTI data consisted of EPI (TR ! 8500 ms; TE ! 100 ms; voxel size ! 2.5 mm3), with diffusion
weighting distributed in 32 directions and b-value ! 1000 s*mm$2.
Resting fMRI data were 190 volumes of EPI sequence with TR ! 1000 ms, TE ! 50 ms, voxel size ! 3.75 # 3.75 # 6 mm. A high-resolution
Figure 1. Similar distribution across brain of T2-weighted LPMs in RIS (top) and RRMS (bottom). The color overlay created on
top of the MNI standard brain represents the probability of lesion occurrence (lesion frequency) in a particular spatial location. Images are shown in radiological convention.
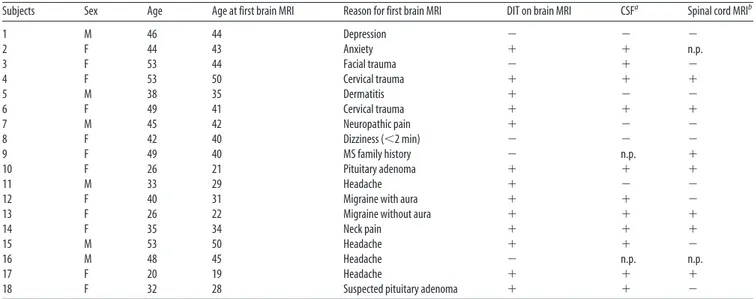
Table 1. Demographic and clinical characteristics of RIS subjects
Subjects Sex Age Age at first brain MRI Reason for first brain MRI DIT on brain MRI CSFa Spinal cord MRIb
1 M 46 44 Depression $ $ $ 2 F 44 43 Anxiety % % n.p. 3 F 53 44 Facial trauma $ % $ 4 F 53 50 Cervical trauma % % % 5 M 38 35 Dermatitis % $ $ 6 F 49 41 Cervical trauma % % % 7 M 45 42 Neuropathic pain % $ $
8 F 42 40 Dizziness (&2 min) $ $ $
9 F 49 40 MS family history $ n.p. %
10 F 26 21 Pituitary adenoma % % %
11 M 33 29 Headache % $ $
12 F 40 31 Migraine with aura % % $
13 F 26 22 Migraine without aura % % %
14 F 35 34 Neck pain % % %
15 M 53 50 Headache % % $
16 M 48 45 Headache $ n.p. n.p.
17 F 20 19 Headache % % %
18 F 32 28 Suspected pituitary adenoma % % $
T1-weighted image (TR ! 25 ms, TE ! 4.6 ms, voxel size ! 1 mm3) was acquired for brain
volume measurement, image registration, and anatomical mapping. Periodical quality assur-ance sessions were performed and no major hardware upgrade was performed on the scan-ner during the time of the study.
MRI data analysis
Brain lesions and atrophy. A single observer vi-sually assessed MRI scans. Labeling of new T2-lesions, for the assessment of dissemination in time from a previous MRI, was performed in RIS subjects with a semi-automated segmenta-tion technique based on user-supervised local thresholding (Jim 5.0; Xinapse System;www.
xinapse.com/Manual/). T2-weighted lesion
probability maps (LPMs) were created in RIS subjects and RRMS patients using a previously described procedure (Rossi et al., 2012;Giorgio et al., 2013).
Global and GM brain atrophy, expressed, respectively, as NBV and NGMV, were quanti-fied in RIS and RRMS on high-resolution T1-weighted image using the SIENAx method, part of the FMRIB Software Library (w w w . f m r i b . o x . a c . u k / f s l /;Smith et al., 2004;
Jenkinson et al., 2012). To avoid GM
misclas-sification due to WM lesions, the latter were masked out and refilled with intensities match-ing the surroundmatch-ing normal-appearmatch-ing WM before segmentation analysis (Battaglini et al., 2012).
Analysis of the microstructural integrity of WM tracts. Voxelwise analysis of DTI data from the three study groups was performed across the whole brain using TBSS (Smith et al., 2006) version 1.2, part of FSL. First, DTI data were corrected for MRI eddy currents and head motion using affine registration to a reference volume, i.e., the one without diffusion weight-ing (b ! 0). Second, images of fractional an-isotropy (FA), axial diffusivity (AD), and radial diffusivity (RD) were created by fitting a tensor model to the raw DTI data using FMRIB Dif-fusion Toolbox (Behrens et al., 2003) version 3.0, and then brain extracted using Brain Ex-traction Tool (BET;Smith, 2002). All subjects’ FA data were then aligned into a common stan-dard space (FMRIB58_FA) using the nonlinear registration tool FMRIB Nonlinear Image Reg-istration Tool (FNIRT; Andersson et al., 2007a,b), which uses a b-spline representation of the registration warp field (Rueckert et al., 1999). Next, the mean FA image was created and thinned to create a mean FA “skeleton” (thresholded at FA ' 0.2), which represents the
centers of all WM tracts common to the study groups. Aligned FA data from all study subjects was then projected onto this WM skeleton.
TBSS was also applied to the other DTI-derived data (i.e., AD and RD). To achieve this, FA images were used for nonlinear registration, skeleton-ization, and projection stages.
The resulting projected (onto the mean WM skeleton) data of FA, AD, and RD images were finally fed into voxelwise group statistics (see below, Statistics).
Analysis of the brain functional connectivity. It was performed across the whole brain using probabilistic independent component analysis (PICA;
Beckmann and Smith, 2004) as implemented in MELODIC version 3.12,
also part of FSL.
The following data preprocessing was applied to the input data: mo-tion correcmo-tion using MCFLIRT (Jenkinson et al., 2002), nonbrain re-moval using BET (Smith, 2002), spatial smoothing using a Gaussian kernel of 8 mm full-width at half-maximum, normalization of the whole dataset by a single scaling factor (“grand-mean scaling”) to ensure dataset comparability at group level, and high-pass temporal filtering (Gaussian-weighted, least-squares straight line fitting, using a cutoff of 100 s).
In each subject, registration of resting fMRI data to high-resolution T1-weighted image and standard space (MNI152) was performed using FLIRT (Jenkinson et al., 2002) with boundary-based registration cost function and FNIRT (warp resolution: 10 mm; Andersson et al.,
2007a,b). Preprocessed data were then temporally concatenated across
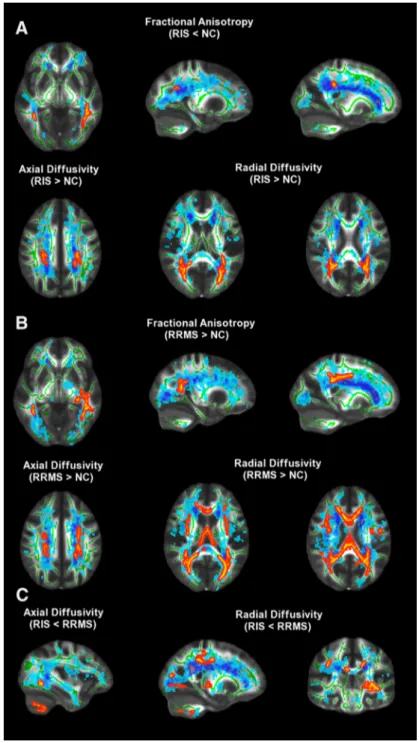
Figure 2. TBSS analysis of DTI measures across the whole brain. Red-yellow shows clusters where RIS subjects (A) and RRMS
patients (B) had DTI abnormalities (lower FA or higher AD and RD; p & 0.01, corrected) with respect to NC. C, Regions of WM tracts where RIS subjects had lower AD and RD than RRMS patients are shown ( p & 0.05, corrected). Green is the mean WM skeleton. Background image, shown in radiological convention, is the FMRIB58 FA standard space. See Results andTable 2for details. See text for abbreviations.
subjects to create a single 4D dataset. Such a dataset was variance nor-malized and then decomposed into a set of 30 independent components (ICs) using PICA, where the number of dimensions was automatically estimated using the Laplace approximation to the Bayesian evidence of the model order (Beckmann and Smith, 2004). Next, voxelwise analysis of resting fMRI data was performed using the “dual-regression” ap-proach (Beckmann et al., 2009). In stage 1, for each subject the group-average set of spatial maps was regressed (as spatial regressors in a multiple regression) into the subject’s 4D space-time dataset. This re-sulted in a set of subject-specific time courses, one per group-level spatial map. In stage 2, those time courses were regressed (as temporal regres-sors, again in a multiple regression) into the same 4D dataset, resulting in a set of subject-specific spatial maps, one per group-level spatial map.
ICs of interest were selected by visual inspection and by comparison with previously defined RSNs (Beckmann et al., 2005;Damoiseaux et al., 2006;De Luca et al., 2006) and reflect “coactivation” or “synchroniza-tion” across the network. The remaining ICs represented physiological noise (cardiac, respiratory and CSF pulsations, and head motion), scanner-related artifacts, and misregistrations, and were removed before further analysis.
Statistics. Voxelwise statistical inference for LPM, TBSS, and PICA analyses was performed within the GLM framework with FSL randomize, a nonparametric permutation testing (5000 permutations). A three-group ANOVA, controlling for age and sex, followed by Bonferroni-corrected pairwise comparisons ( p & 0.01), was used to assess voxelwise differences among the three groups. Thresholding was performed using Threshold-Free Cluster Enhancement (TFCE), fully corrected for multi-ple comparisons across space. We repeated the functional connectivity comparison analyses also adding GMV as a covariate to the GLM design.
Results
Lesions
Brain lesions were present in all RIS subjects and RRMS
pa-tients. Spinal cord lesions were found in 7 of 18 (i.e., 40%) RIS
subjects and in 14 of 20 (i.e., 70%) RRMS patients.
T2-weighted LPMs of RIS and RRMS showed an overall similar
distribution across brain (
Fig. 1
) and no difference in
proba-bility of lesion occurrence (lesion frequency) was found at
voxelwise analysis.
Figure 3. Functionally relevant RSNs (the most informative slices are shown) across study subjects (RIS, RRMS, and NC) identified with PICA. Images (axial, coronal, and sagittal) are z-statistics
overlaid on the average high-resolution image transformed into standard space (MNI152). Z values are red to yellow, ranging from 3 to 10. Images are shown in radiological convention. See text for abbreviations.
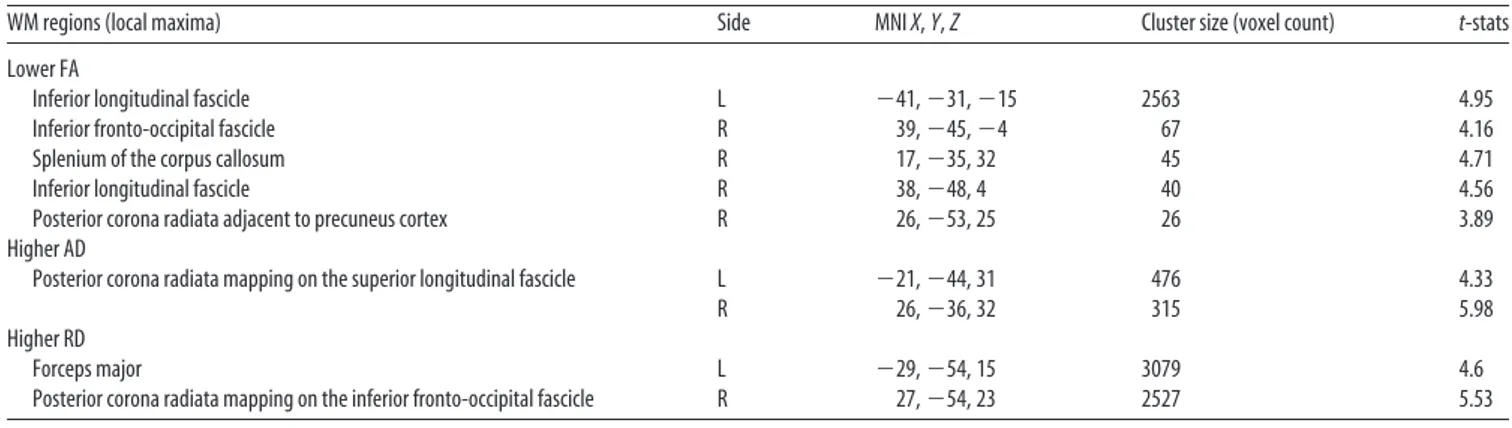
Table 2. Regions along cerebral WM tracts where RIS subjects showed DTI abnormalities with respect to NC at whole-brain TBSS analysis
WM regions (local maxima) Side MNI X, Y, Z Cluster size (voxel count) t-stats
Lower FA
Inferior longitudinal fascicle L $41, $31, $15 2563 4.95
Inferior fronto-occipital fascicle R 39, $45, $4 67 4.16
Splenium of the corpus callosum R 17, $35, 32 45 4.71
Inferior longitudinal fascicle R 38, $48, 4 40 4.56
Posterior corona radiata adjacent to precuneus cortex R 26, $53, 25 26 3.89
Higher AD
Posterior corona radiata mapping on the superior longitudinal fascicle L $21, $44, 31 476 4.33
R 26, $36, 32 315 5.98
Higher RD
Forceps major L $29, $54, 15 3079 4.6
Posterior corona radiata mapping on the inferior fronto-occipital fascicle R 27, $54, 23 2527 5.53
Microstructural integrity of white
matter tracts
Compared with NC, both RIS subjects
and RRMS patients showed altered DTI
metrics at TBSS analysis across the whole
brain (p & 0.01, corrected). In particular
(
Fig. 2
A,
Table 2
), RIS subjects showed
lower FA (0.49 " 0.04 vs 0.55 " 0.02) in
clusters overlapping lesional areas, with
local maxima in the inferior longitudinal
fascicle (ILF) bilaterally and in the inferior
fronto-occipital fascicle (IFOF), splenium
of the corpus callosum (sCC), and
poste-rior corona radiata (CR) adjacent to
pre-cuneus cortex on the right. In addition,
RIS subjects also showed clusters of
al-tered diffusivities in lesional areas when
compared with NC (
Fig. 2
A,
Table 2
):
higher AD (1.27 " 0.11 vs 1.14 " 0.03 #
10
$3mm
2/s) in the posterior CR
map-ping on the superior longitudinal fascicle
(SLF) bilaterally and higher RD (0.60 "
0.07 vs 0.51 " 0.03 # 10
$3mm
2/s) in the
forceps major on the left and in the
poste-rior CR mapping on the IFOF on the right.
RRMS patients showed, similarly to RIS subjects, changes in
DTI metrics with respect to NC. These abnormalities mapped on
several WM tracts across brain both within lesions and regions of
the normal-appearing WM (
Fig. 2
B): lower FA (0.47 " 0.03 vs
0.54 " 0.02) in the ILF, fornix, and body of the CC on the left, in
the IFOF, sCC, and genu of the CC on the right; higher AD
(1.50 " 0.14 vs 1.30 " 0.04 # 10
$3mm
2/s) in the CR bilaterally,
in the IFOF/ILF on the left, in the posterior limb of the internal
capsule on the right; and higher RD (0.65 " 0.07 vs 0.54 " 0.02 #
10
$3mm
2/s) in the posterior CR on the right, in the anterior
thalamic radiation and SLF on the left.
No significant clusters of DTI metrics across brain survived in
the comparison analysis between RIS subjects and RRMS
pa-tients. However, by using a less conservative threshold (i.e., p &
0.05, corrected;
Fig. 2
C) WM of RIS subjects showed, with respect
to that (both lesions and normal-appearing WM) of RRMS
pa-tients, lower AD (0.98 " 0.06 vs 1.14 " 0.13 # 10
$3mm
2/s) in
the IFOF and cerebellum on the left; lower RD (0.57 " 0.03 vs
0.66 " 0.05 # 10
$3mm
2/s) in the IFOF, ILF, cerebellum,
supe-rior CR mapping on the corticospinal tract on the left; in the body
of the CC on the right; and in the SLF bilaterally, while there was
no difference in FA. In RIS subjects, no WM regions with higher
AD and RD than in RRMS patients were found.
Functional connectivity
No difference was found among RIS subjects, RRMS patients,
and NC in the head movement parameters during resting fMRI
acquisition (relative displacement: 0.06 " 0.05 mm in RIS,
0.06 " 0.04 mm in RRMS, 0.06 " 0.03 mm in NC, p ! 0.90;
absolute displacement: 0.26 " 0.16 mm in RIS, 0.32 " 0.13 mm
in RRMS, 0.29 " 0.20 in NC, p ! 0.52).
PICA across the whole brain of the study population defined
12 functionally relevant RSNs (
Fig. 3
), including (anterior and
posterior) default mode network, executive network, (right and
left) working memory network, dorsal attention network,
ante-rior temporal lobe network, ventral frontoparietal network,
sen-sorimotor network, auditory/language network, and (primary
and secondary) visual network.
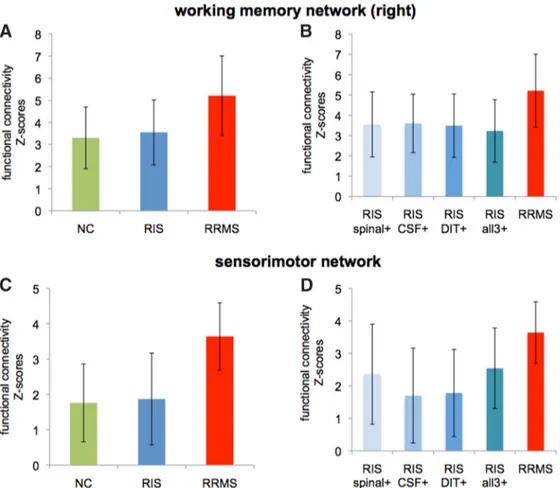
Two of these RSNs showed group heterogeneity. In particular,
RIS subjects had lower functional connectivity than RRMS
pa-tients in the sensorimotor network (postcentral gyrus bilaterally)
and in the right working memory network (middle frontal gyrus;
p & 0.01, corrected;
Fig. 4
,
Table 3
). Similarly to RIS subjects, NC
showed lower functional connectivity than RRMS patients in the
aforementioned RSNs mapping, respectively, on the postcentral
gyrus and right frontal pole (p & 0.01, corrected). No voxelwise
difference in brain functional connectivity was found between
RIS subjects and NC, even at a less conservative threshold (p &
0.05, corrected). Moreover, we explored functional connectivity
in RIS subjects with respect to the other two study groups in the
presence of important risk factors for MS (spinal cord lesions
[n ! 7], oligoclonal bands [n ! 11], dissemination in time on
MRI [n ! 13] or the combination of them [n ! 6]). In all RIS
subgroups, functional connectivity values, extracted from
clus-ters of the two aforementioned networks, were lower than in
RRMS patients (p & 0.02 for all;
Fig. 5
) and similar to NC.
Differences in the above RSNs were retained when also adding
GMV as a covariate.
Discussion
The term RIS refers to a relatively new entity and is applied to
asymptomatic subjects who nonetheless present brain MRI
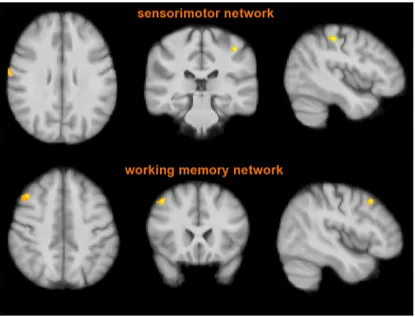
ab-Figure 4. FC analysis of the two RSNs (sensorimotor and right working memory networks) where RIS subjects, similarly to NC,
showed lower values than RRMS patients ( p & 0.01, corrected). Red-yellow shows significant clusters of the comparison between RIS subjects and RRMS patients mapping on the postcentral gyrus bilaterally (top) and middle frontal gyrus (bottom). Images (in standard MNI152 space) are shown in radiological convention. See Results andTable 3for details. See text for abbreviations.
Table 3. The two RSNs (sensorimotor and right working memory) where RIS subjects showed, similarly to NC, lower FC than RMS patients at PICA across the whole brain
Side MNI X, Y, Z (mm) Cluster size(voxel count) t-stats Sensorimotor network
(local maxima)
Postcentral gyrus R 68, $10, 28 37 4.71
L $42, $32, 50 32 5.17
Working memory network (local maxima)
Middle frontal gyrus R 44, 20, 46 38 5.28
normalities highly suggestive of MS. The reason this happens has
not been fully elucidated yet, but might be related with an
excep-tional ability to repair and/or to withstand the insult leading to
demyelination (
Poser, 2004
;
De Stefano et al., 2011
). A number of
previous studies (
Lebrun et al., 2009
;
2010
;
Okuda et al., 2009
;
2011
;
Siva et al., 2009
) have evaluated RIS with conventional
MRI, particularly highlighting the similarity with MS in terms of
both visible focal and diffuse brain damage (
De Stefano et al.,
2011
;
Amato et al., 2012
). On the other hand, studies on brain
anatomical and functional connectivity in MS have pointed out
their relevance in terms of both physical disability and cognitive
impairment (
Roosendaal et al., 2009
;
Rocca et al., 2010
;
2012
;
Bonavita et al., 2011
;
Hawellek et al., 2011
;
Faivre et al., 2012
;
Loitfelder et al., 2012
;
Mesaros et al., 2012
;
Schoonheim et al.,
2012
;
Basile et al., 2013
;
Bozzali et al., 2013
;
Janssen et al., 2013
;
Li
et al., 2013
;
Cruz-Go´mez et al., 2014
;
Gamboa et al., 2014
). To test
the hypothesis that brain connectivity would help interpret the
absence of clinical deficits in RIS, we assessed it in our RIS
sub-jects in relation to normal controls and to patients with RRMS
having similar macrostructural brain damage (i.e., lesions and
atrophy).
Microstructural integrity of white matter tracts
In this study, RIS subjects showed altered integrity of WM tracts
with respect to NC only in correspondence of lesions. As
ex-pected, in RRMS such abnormalities mapped on both lesions and
normal-appearing WM. No voxelwise differences between RIS
subjects and RRMS patients were found. However, by using a less
conservative statistical thresholding RIS showed lower axial and
radial diffusivity and thus a relatively better anatomical
connec-tivity than RRMS along distinct cerebral WM tracts overlapping
both lesions and normal-appearing WM and belonging to
asso-ciation (inferior fronto-occipital fascicle and inferior and
supe-rior longitudinal fascicles), commissural (corpus callosum), and
projection (corticospinal tract) fiber systems and also in the
in-fratentorial region (cerebellum). In general, DTI measures are
obtained by fitting a diffusion tensor model to all voxels within
the brain. In this context, fractional anisotropy is a sensitive and
general measure of microstructural integrity of WM tracts
whereas axial and radial diffusivities have been, respectively,
pro-posed as markers of axon and myelin damage in MS animal
mod-els and histopathology studies (
Song et al., 2005
;
Sun et al., 2007
;
Wu et al., 2007
;
Budde et al., 2008
;
Schmierer et al., 2008
;
Wheeler-Kingshott and Cercignani, 2009
). The findings reported
here are in line with a previous study assessing microstructural
integrity of the WM in RIS and MS by using magnetization
trans-fer ratio (
De Stefano et al., 2011
). Indeed, the presence in RIS of
microstructural damage confined to lesions, with a milder
sever-ity than in MS, and the lack of involvement of the
normal-appearing WM, as it occurs in MS, may be among the factors
explaining the lack of clinical deficits in these subjects. Overall, it
is conceivable the presence of a different degree of myelin and/or
axon damage in the two entities is perhaps due to a more
benefi-cial response to it in RIS.
Functional connectivity
Results of the resting fMRI analysis showed group heterogeneity
among NC, RIS subjects, and RRMS patients within two brain
Figure 5. Columns and error bars represent mean and SD of FC values (z scores) averaged across the significant clusters in the right working memory network (A) and sensorimotor network (C)
networks subserving sensorimotor and working memory
func-tions. In particular, functional connectivity in such brain
net-works was similar between RIS and NC but significantly
increased in RRMS. Importantly, the difference in FC between
RIS and RRMS was independent from the volume of GM, which
was similar in the two groups and also controlled for in the
vox-elwise analysis.
We found that both RIS subjects and NC had a similar
func-tional connectivity, which was otherwise enhanced in RRMS
pa-tients, at the level of the sensorimotor network, a part of the
“processing system” of the human brain (
Power et al., 2011
). This
functional change mapped on the postcentral gyrus, an
impor-tant structure of the parietal lobe and home to the primary
so-matosensory cortex, which is the main sensory receptive area of
the brain. Interestingly, such a region is connected with
precen-tral motor cortex through short frontoparietal U-tracts (cenprecen-tral
sulcus connections), which play a role in sensorimotor
integra-tion and motor learning (
Catani et al., 2012b
).
Working memory, which is instead part of the “control
sys-tem” of the human brain (
Power et al., 2011
), was the other brain
network where functional connectivity was decreased in both RIS
subjects and NC with respect to RRMS patients. In particular,
change in functional connectivity mapped on the right middle
frontal gyrus and frontal pole, both parts of the right prefrontal
cortex, which monitors the episodic memory retrieval to respond
appropriately or, in other words, to make decisions by weighing
the risk-to-benefit ratio (
Konishi et al., 2002
;
Floel et al., 2004
;
Ranganath, 2004
).
Interpretation of the preserved functional connectivity
pat-terns in RIS is inevitably linked to the changes of it, and thus to
the neuroplasticity occurring in MS brains (
Tomassini et al.,
2012
). Enhanced functional connectivity in MS has been deemed
not only as a compensatory process, i.e., leading to a better
clin-ical status through adaptive plasticity mechanisms (
Bonavita et
al., 2011
;
Faivre et al., 2012
;
Loitfelder et al., 2012
;
Rocca et al.,
2012
;
Basile et al., 2013
;
Cruz-Go´mez et al., 2014
), but also as an
undesirable maladaptive plasticity triggered and sustained by
dis-ability, as demonstrated by studies of fMRI (
Reddy et al., 2002
;
Hawellek et al., 2011
) and magnetoencephalography (
Hardmeier
et al., 2012
). In our asymptomatic RIS subjects, the lack of
en-hanced functional connectivity may have explanations similar to
those of MS patients, although in the opposite direction. First, it
can be due to the fact that compensatory adaptive functional
reorganization might not yet be needed in absence of a clinical
status. In this view, such a process might be only temporarily
downregulated, thus representing a model of “functional
re-serve” called into action just at a later stage, in case of occurrence
of a clinical deficit. Second, it may be interpreted as a lack of
maladaptive plasticity, which instead would contribute to
dis-ability. In general, this process involves multiple functional
do-mains (
Nudo, 2006
;
Bruce et al., 2007
) and turns out to be a
further challenge to recovery in a chronic condition such as MS.
Research in both humans and animal models has begun to
iden-tify morphological correlates of maladaptive plasticity at the
cel-lular level, including dendritic and synaptic reorganization, glial
remodeling, and altered cell life (
Sousa and Almeida, 2012
).
Fi-nally, we cannot rule out the possibility that preserved functional
connectivity in RIS is influenced by the relatively milder
micro-structural WM damage with respect to the RRMS patients.
Indeed, both regions of preserved functional connectivity in
RIS (postcentral gyrus and middle frontal gyrus) are adjacent to
the SLF, an important long association pathway connecting
fron-tal and pariefron-tal cortices of the same hemisphere and whose
diffu-sivity was found to be less altered than in MS patients, thus
suggesting a possible link between anatomical and functional
connectivity in RIS.
Study strengths and limitations
There are strengths and limitations in the study. The two
whole-brain MRI approaches used for the assessment of structural and
functional connectivity feature important methodological
as-pects: nonlinear registration, which reduces the potential bias
coming from registration errors; nonparametric permutation
testing with a conservative statistical threshold corrected for
mul-tiple comparisons across space, thus protecting against false
pos-itive results; and TFCE, which uses the spatial information
inherent to the data for computing statistical maps, thus not
requiring arbitrary image presmoothing and not depending on
an arbitrary initial cluster-forming threshold. Limitations lie in
the relatively small sample size of the study groups, in the use by
MS patients of DMTs potentially affecting the different sources of
the fMRI signal and thus its interpretation (
Iannetti and Wise,
2007
;
Tomassini et al., 2012
), in the relatively low resolution of
the resting fMRI data, and in the cross-sectional design of the
study, which can be generally considered a snapshot of a
condi-tion at a given point in time.
Conclusions
RIS represents a unique model for gauging the relation between
brain tissue damage, neurologic condition, and neuroplasticity in
the human brain. Our findings suggest that in these
asymptom-atic subjects there is, compared with MS, a relatively milder
mi-crostructural damage of different WM tracts, which to some
extent, may contribute to explain the lack of functional
reorgani-zation in key brain networks. The latter could represent a model
of functional reserve,” which may become upregulated, with an
adaptive or maladaptive role, only at a later stage in case of
oc-currence of clinical deficit. Capturing temporal dynamics of
brain connectivity changes in RIS subjects who will or will not
convert to MS over time with longitudinal studies will certainly
help disentangle the aforementioned relation.
References
Amato MP, Hakiki B, Goretti B, Rossi F, Stromillo ML, Giorgio A, Roscio M, Ghezzi A, Guidi L, Bartolozzi ML, Portaccio E, De Stefano N (2012) Association of MRI metrics and cognitive impairment in radiologically isolated syndromes. Neurology 78:309 –314.CrossRef Medline Andersson JLR, Jenkinson M, Smith S (2007a) Non-linear optimisation. FMRIB
technical report TR07JA1 fromwww.fmrib.ox.ac.uk/analysis/techrep. Andersson JLR, Jenkinson M, Smith S (2007b) Non-linear registration, aka
Spatial normalisation. FMRIB technical report TR07JA2 from www.
fmrib.ox.ac.uk/analysis/techrep.
Basile B, Castelli M, Monteleone F, Nocentini U, Caltagirone C, Centonze D, Cercignani M, Bozzali M (2013) Functional connectivity changes within specific networks parallel the clinical evolution of multiple sclerosis. Mult Scler 20:1050 –1057.CrossRef Medline
Battaglini M, Jenkinson M, De Stefano N (2012) Evaluating and reducing the impact of white matter lesions on brain volume measurements. Hum Brain Mapp 33:2062–2071.CrossRef Medline
Beckmann CF, Smith SM (2004) Probabilistic independent component analysis for functional magnetic resonance imaging. IEEE Trans Med Imaging 23:137–152.CrossRef Medline
Beckmann CF, DeLuca M, Devlin JT, Smith SM (2005) Investigations into resting-state connectivity using independent component analysis. Philos Trans R Soc Lond B Biol Sci 360:1001–1013.CrossRef Medline Beckmann CF, Mackay CE, Filippini N, Smith SM (2009) Group
compari-son of resting-state FMRI data using multi-subject ICA and dual regres-sion. Neuroimage 47:S148.CrossRef
S, Matthews PM, Brady JM, Smith SM (2003) Characterization and propagation of uncertainty in diffusion-weighted MR imaging. Magn Reson Med 50:1077–1088.CrossRef Medline
Bonavita S, Gallo A, Sacco R, Corte MD, Bisecco A, Docimo R, Lavorgna L, Corbo D, Costanzo AD, Tortora F, Cirillo M, Esposito F, Tedeschi G (2011) Distributed changes in default-mode resting-state connectivity in multiple sclerosis. Mult Scler 17:411– 422.CrossRef Medline
Bozzali M, Spano` B, Parker GJ, Giulietti G, Castelli M, Basile B, Rossi S, Serra L, Magnani G, Nocentini U, Caltagirone C, Centonze D, Cercignani M (2013) Anatomical brain connectivity can assess cognitive dysfunction in multiple sclerosis. Mult Scler 19:1161–1168.CrossRef Medline Bruce JM, Bruce AS, Arnett PA (2007) Mild visual acuity disturbances are
associated with performance on tests of complex visual attention in MS. J Int Neuropsychol Soc 13:544 –548.CrossRef Medline
Budde MD, Kim JH, Liang HF, Russell JH, Cross AH, Song SK (2008) Ax-onal injury detected by in vivo diffusion tensor imaging correlates with neurological disability in a mouse model of multiple sclerosis. NMR Biomed 21:589 –597.CrossRef Medline
Catani M, Dell’acqua F, Bizzi A, Forkel SJ, Williams SC, Simmons A, Murphy DG, Thiebaut de Schotten M (2012a) Beyond cortical localization in clinico-anatomical correlation. Cortex 48:1262–1287.CrossRef Medline Catani M, Dell’acqua F, Vergani F, Malik F, Hodge H, Roy P, Valabregue R, Thiebaut de Schotten M (2012b) Short frontal lobe connections of the human brain. Cortex 48:273–291.CrossRef Medline
Cruz-Go´mez A´J, Ventura-Campos N, Belenguer A, A´vila C, Forn C (2014) The link between resting-state functional connectivity and cognition in MS patients. Mult Scler 20:338 –348.CrossRef Medline
Damoiseaux JS, Rombouts SA, Barkhof F, Scheltens P, Stam CJ, Smith SM, Beckmann CF (2006) Consistent resting-state networks across healthy subjects. Proc Natl Acad Sci U S A 103:13848 –13853.CrossRef Medline De Luca M, Beckmann CF, De Stefano N, Matthews PM, Smith SM (2006)
fMRI resting state networks define distinct modes of long-distance inter-actions in the human brain. Neuroimage 29:1359 –1367. CrossRef Medline
De Stefano N, Stromillo ML, Rossi F, Battaglini M, Giorgio A, Portaccio E, Hakiki B, Malentacchi G, Gasperini C, Santangelo M, Bartolozzi ML, Sormani MP, Federico A, Amato MP (2011) Improving the character-ization of radiologically isolated syndrome suggestive of multiple sclero-sis. PLoS One 6:e19452.CrossRef Medline
Faivre A, Rico A, Zaaraoui W, Crespy L, Reuter F, Wybrecht D, Soulier E, Malikova I, Confort-Gouny S, Cozzone PJ, Pelletier J, Ranjeva JP, Audoin B (2012) Assessing brain connectivity at rest is clinically relevant in early multiple sclerosis. Mult Scler 18:1251–1258.CrossRef Medline Filippi M, van den Heuvel MP, Fornito A, He Y, Hulshoff Pol HE, Agosta F,
Comi G, Rocca MA (2013) Assessment of system dysfunction in the brain through MRI-based connectomics. Lancet Neurol 12:1189 –1199. CrossRef Medline
Floel A, Poeppel D, Buffalo EA, Braun A, Wu CW, Seo HJ, Stefan K, Knecht S, Cohen LG (2004) Prefrontal cortex asymmetry for memory encoding of words and abstract shapes. Cereb Cortex 14:404 – 409.CrossRef Medline Gamboa OL, Tagliazucchi E, von Wegner F, Jurcoane A, Wahl M, Laufs H, Ziemann U (2014) Working memory performance of early MS patients correlates inversely with modularity increases in resting state functional connectivity networks. Neuroimage 94:385–395.CrossRef Medline Giorgio A, Stromillo ML, Rossi F, Battaglini M, Hakiki B, Portaccio E,
Fed-erico A, Amato MP, De Stefano N (2011) Cortical lesions in radiologi-cally isolated syndrome. Neurology 77:1896 –1899.CrossRef Medline Giorgio A, Battaglini M, Rocca MA, De Leucio A, Absinta M, van Schijndel R,
Rovira A, Tintore´ M, Chard D, Ciccarelli O, Enzinger C, Gasperini C, Frederiksen J, Filippi M, Barkhof F, De Stefano N (2013) Location of brain lesions predicts conversion of clinically isolated syndromes to mul-tiple sclerosis. Neurology 80:234 –241.CrossRef Medline
Hardmeier M, Schoonheim MM, Geurts JJ, Hillebrand A, Polman CH, Bark-hof F, Stam CJ (2012) Cognitive dysfunction in early multiple sclerosis: altered centrality derived from resting-state functional connectivity using magneto-encephalography. PLoS One 7:e42087.CrossRef Medline Hawellek DJ, Hipp JF, Lewis CM, Corbetta M, Engel AK (2011) Increased
functional connectivity indicates the severity of cognitive impairment in multiple sclerosis. Proc Natl Acad Sci U S A 108:19066 –19071.CrossRef Medline
Iannetti GD, Wise RG (2007) BOLD functional MRI in disease and
phar-macological studies: room for improvement? Magn Reson Imaging 25: 978 –988.CrossRef Medline
Janssen AL, Boster A, Patterson BA, Abduljalil A, Prakash RS (2013) Resting-state functional connectivity in multiple sclerosis: an examina-tion of group differences and individual differences. Neuropsychologia 51:2918 –2929.CrossRef Medline
Jenkinson M, Bannister P, Brady M, Smith S (2002) Improved optimization for the robust and accurate linear registration and motion correction of brain images. Neuroimage 17:825– 841.CrossRef Medline
Jenkinson M, Beckmann CF, Behrens TE, Woolrich MW, Smith SM (2012) Fsl. Neuroimage 62:782–790.CrossRef Medline
Johansen-Berg H, Rushworth MF (2009) Using diffusion imaging to study human connectional anatomy. Annu Rev Neurosci 32:75–94.CrossRef Medline
Konishi S, Hayashi T, Uchida I, Kikyo H, Takahashi E, Miyashita Y (2002) Hemispheric asymmetry in human lateral prefrontal cortex during cog-nitive set shifting. Proc Natl Acad Sci U S A 99:7803–7808. CrossRef Medline
Lebrun C, Bensa C, Debouverie M, Wiertlevski S, Brassat D, de Seze J, Rumbach L, Pelletier J, Labauge P, Brochet B, Tourbah A, Clavelou P (2009) Association between clinical conversion to multiple sclerosis in radiologically isolated syndrome and magnetic resonance imaging, cere-brospinal fluid, and visual evoked potential: follow-up of 70 patients. Arch Neurol 66:841– 846.CrossRef Medline
Lebrun C, Blanc F, Brassat D, Zephir H, de Seze J (2010) Cognitive function in radiologically isolated syndrome. Mult Scler 16:919 –925.CrossRef Medline
Li Y, Jewells V, Kim M, Chen Y, Moon A, Armao D, Troiani L, Markovic-Plese S, Lin W, Shen D (2013) Diffusion tensor imaging based network anal-ysis detects alterations of neuroconnectivity in patients with clinically early relapsing-remitting multiple sclerosis. Hum Brain Mapp 34:3376 – 3391.CrossRef Medline
Loitfelder M, Filippi M, Rocca M, Valsasina P, Ropele S, Jehna M, Fuchs S, Schmidt R, Neuper C, Fazekas F, Enzinger C (2012) Abnormalities of resting state functional connectivity are related to sustained attention deficits in MS. PLoS One 7:e42862.CrossRef Medline
Mesaros S, Rocca MA, Kacar K, Kostic J, Copetti M, Stosic-Opincal T, Prezi-osa P, Sala S, Riccitelli G, Horsfield MA, Drulovic J, Comi G, Filippi M (2012) Diffusion tensor MRI tractography and cognitive impairment in multiple sclerosis. Neurology 78:969 –975.CrossRef Medline
Nudo RJ (2006) Plasticity. NeuroRx 3:420 – 427.CrossRef Medline Okuda DT (2009) Unanticipated demyelinating pathology of the CNS. Nat
Rev Neurol 5:591–597.CrossRef Medline
Okuda DT, Mowry EM, Beheshtian A, Waubant E, Baranzini SE, Goodin DS, Hauser SL, Pelletier D (2009) Incidental MRI anomalies suggestive of multiple sclerosis: the radiologically isolated syndrome. Neurology 72: 800 – 805.CrossRef Medline
Okuda DT, Mowry EM, Cree BA, Crabtree EC, Goodin DS, Waubant E, Pelletier D (2011) Asymptomatic spinal cord lesions predict disease progression in radiologically isolated syndrome. Neurology 76:686 – 692. CrossRef Medline
Poser CM (2004) Multiple sclerosis trait: the premorbid stage of multiple sclerosis. A hypothesis. Acta Neurol Scand 109:239 –243. CrossRef Medline
Power JD, Cohen AL, Nelson SM, Wig GS, Barnes KA, Church JA, Vogel AC, Laumann TO, Miezin FM, Schlaggar BL, Petersen SE (2011) Functional network organization of the human brain. Neuron 72:665– 678.CrossRef Medline
Ranganath C (2004) The 3-D prefrontal cortex: hemispheric asymmetries in prefrontal activity and their relation to memory retrieval processes. J Cogn Neurosci 16:903–907.CrossRef Medline
Reddy H, Narayanan S, Woolrich M, Mitsumori T, Lapierre Y, Arnold DL, Matthews PM (2002) Functional brain reorganization for hand move-ment in patients with multiple sclerosis: defining distinct effects of injury and disability. Brain 125:2646 –2657.CrossRef Medline
Rocca MA, Pagani E, Absinta M, Valsasina P, Falini A, Scotti G, Comi G, Filippi M (2007) Altered functional and structural connectivities in pa-tients with MS: a 3-T study. Neurology 69:2136 –2145.CrossRef Medline Rocca MA, Valsasina P, Absinta M, Riccitelli G, Rodegher ME, Misci P, Rossi P, Falini A, Comi G, Filippi M (2010) Default-mode network dysfunc-tion and cognitive impairment in progressive MS. Neurology 74:1252– 1259.CrossRef Medline
Rocca MA, Valsasina P, Martinelli V, Misci P, Falini A, Comi G, Filippi M (2012) Large-scale neuronal network dysfunction in relapsing-remitting multiple sclerosis. Neurology 79:1449 –1457.CrossRef Medline Roosendaal SD, Geurts JJ, Vrenken H, Hulst HE, Cover KS, Castelijns JA,
Pouwels PJ, Barkhof F (2009) Regional DTI differences in multiple scle-rosis patients. Neuroimage 44:1397–1403.CrossRef Medline
Roosendaal SD, Schoonheim MM, Hulst HE, Sanz-Arigita EJ, Smith SM, Geurts JJ, Barkhof F (2010) Resting state networks change in clinically isolated syndrome. Brain 133:1612–1621.CrossRef Medline
Rossi F, Giorgio A, Battaglini M, Stromillo ML, Portaccio E, Goretti B, Fed-erico A, Hakiki B, Amato MP, De Stefano N (2012) Relevance of brain lesion location to cognition in relapsing multiple sclerosis. PLoS One 7:e44826.CrossRef Medline
Rueckert D, Sonoda LI, Hayes C, Hill DL, Leach MO, Hawkes DJ (1999) Nonrigid registration using free-form deformations: application to breast MR images. IEEE Trans Med Imaging 18:712–721.CrossRef Medline Schmierer K, Wheeler-Kingshott CA, Tozer DJ, Boulby PA, Parkes HG,
Yousry TA, Scaravilli F, Barker GJ, Tofts PS, Miller DH (2008) Quanti-tative magnetic resonance of postmortem multiple sclerosis brain before and after fixation. Magn Reson Med 59:268 –277.CrossRef Medline Schoonheim MM, Hulst HE, Landi D, Ciccarelli O, Roosendaal SD,
Sanz-Arigita EJ, Vrenken H, Polman CH, Stam CJ, Barkhof F, Geurts JJ (2012) Gender-related differences in functional connectivity in multiple sclero-sis. Mult Scler 18:164 –173.CrossRef Medline
Siva A, Saip S, Altintas A, Jacob A, Keegan BM, Kantarci OH (2009) Multi-ple sclerosis risk in radiologically uncovered asymptomatic possible inflammatory-demyelinating disease. Mult Scler 15:918 –927.CrossRef Medline
Smith SM (2002) Fast robust automated brain extraction. Hum Brain Mapp 17:143–155.CrossRef Medline
Smith SM, Jenkinson M, Woolrich MW, Beckmann CF, Behrens TE, Johansen-Berg H, Bannister PR, De Luca M, Drobnjak I, Flitney DE, Niazy RK, Saunders J, Vickers J, Zhang Y, De Stefano N, Brady JM, Mat-thews PM (2004) Advances in functional and structural MR image
anal-ysis and implementation as FSL. Neuroimage 23 [Suppl 1]:S208 –S219. CrossRef Medline
Smith SM, Jenkinson M, Johansen-Berg H, Rueckert D, Nichols TE, Mackay CE, Watkins KE, Ciccarelli O, Cader MZ, Matthews PM, Behrens TE (2006) Tract-based spatial statistics: voxelwise analysis of multi-subject diffusion data. Neuroimage 31:1487–1505.CrossRef Medline
Song SK, Yoshino J, Le TQ, Lin SJ, Sun SW, Cross AH, Armstrong RC (2005) Demyelination increases radial diffusivity in corpus callosum of mouse brain. Neuroimage 26:132–140.CrossRef Medline
Sousa N, Almeida OF (2012) Disconnection and reconnection: the mor-phological basis of (mal)adaptation to stress. Trends Neurosci 35:742–
751.CrossRef Medline
Stromillo ML, Giorgio A, Rossi F, Battaglini M, Hakiki B, Malentacchi G, Santangelo M, Gasperini C, Bartolozzi ML, Portaccio E, Amato MP, De Stefano N (2013) Brain metabolic changes suggestive of axonal damage in radiologically isolated syndrome. Neurology 80:2090 –2094.CrossRef Medline
Sun SW, Liang HF, Schmidt RE, Cross AH, Song SK (2007) Selective vul-nerability of cerebral white matter in a murine model of multiple sclerosis detected using diffusion tensor imaging. Neurobiol Dis 28:30 –38. CrossRef Medline
Tomassini V, Matthews PM, Thompson AJ, Fuglø D, Geurts JJ, Johansen-Berg H, Jones DK, Rocca MA, Wise RG, Barkhof F, Palace J (2012) Neu-roplasticity and functional recovery in multiple sclerosis. Nat Rev Neurol 8:635– 646.CrossRef Medline
van den Heuvel MP, Hulshoff Pol HE (2010) Exploring the brain network: a review on resting-state fMRI functional connectivity. Eur Neuropsycho-pharmacol 20:519 –534.CrossRef Medline
Wheeler-Kingshott CA, Cercignani M (2009) About “axial” and “radial” diffusivities. Magn Reson Med 61:1255–1260.CrossRef Medline Wu Q, Butzkueven H, Gresle M, Kirchhoff F, Friedhuber A, Yang Q, Wang H,
Fang K, Lei H, Egan GF, Kilpatrick TJ (2007) MR diffusion changes correlate with ultra-structurally defined axonal degeneration in murine optic nerve. Neuroimage 37:1138 –1147.CrossRef Medline