DOI 10.1007/s00280-015-2796-6 SHORT COMMUNICATION
Metastatic melanoma cells with BRAF G469A mutation:
nab‑paclitaxel better than vemurafenib?
Letizia Porcelli1 · Gabriella Guida2 · Stefania Tommasi3 · Michele Guida4 · Amalia Azzariti1
Received: 24 March 2015 / Accepted: 28 May 2015 © Springer-Verlag Berlin Heidelberg 2015
and the low expression of MITF. Nab-paclitaxel strongly reduced proliferation of MO-1 cells perhaps for the very low expression level of PMEL17, transcriptionally regu-lated by MITF and negatively involved in determining sen-sitivity to taxanes.
Conclusions Thus, the mutation BRAF G469A in MM might be related to a weak effectiveness of therapy with BRAF inhibitors and a promising therapeutic approach may be with nab-paclitaxel.
Keywords Metastatic melanoma · BRAF G469A
mutation · Vemurafenib · Nab-paclitaxel · PMEL17
Introduction
The mutational status of BRAF (B-Raf proto-oncogene serine/threonine-protein kinase) plays a key role in deter-mining the response to BRAF inhibitors in the treatment of metastatic melanoma (MM) with vemurafenib and dab-rafenib showing an high efficacy, when the patient has the BRAF V600E mutation but unfortunately with also a quick recurrence of the disease because the establishment of drug resistance phenomena. The melanoma becomes resistant to this class of drugs because of the over-acti-vation of MEK/ERK1/2 pathway or amplification of the MITF or activation of PI3K/Akt/mTOR pathway, etc. [1]. The substitution of glutamic acid for valine at position 600 (BRAF V600E) is up >90 % of the mutations in this gene within melanoma, with the remainder of mutations largely resulting from other amino acid substitutions at this posi-tion, such as V600K, V600D, or V600R and only few in the glycine-rich P loop of the N lobe and in the activa-tion segment and flanking regions [2]. BRAF G469A is a missense mutation within exon 11 of the BRAF gene, due
Abstract
Purpose BRAF G469A is a missense mutation within exon 11 of the BRAF gene resulting in a constitutively activated enzyme frequently associated with MAP kinase cascade signaling activation. No evidence currently exists about its role in determining sensitivity/resistance to BRAF inhibitors, utilized in the treatment of patients carrying BRAF V600 mutations, and to chemotherapy. The newly established metastatic melanoma (MM) cell line MO-1 was characterized for its sensitivity to vemurafenib and nab-paclitaxel, both already utilized for the treatment of MM.
Methods All analyses were carried out by comparing results with those found in MM cells wild type for BRAF or mutated in V600. In addition, cellular effectors were investigated by ELISA kits, western blotting and flow cytometry.
Results The exposure to vemurafenib inhibited MO-1 cell proliferation at concentrations similar to those obtained in vemurafenib-resistant melanoma models, and an explana-tion of this sensitivity is the strong activaexplana-tion of Erk1/2
* Amalia Azzariti
1 Clinical and Preclinical Pharmacology Lab, National Cancer
Research Centre Istituto Tumori Giovanni Paolo II, Viale O. Flacco, 65, 70124 Bari, Italy
2 Department of Basic Medical Sciences, Neurosciences
and Sense Organs, University of Bari, Pizza Giulio Cesare, 70124 Bari, Italy
3 Molecular Genetics Lab, National Cancer Research Centre
Istituto Tumori Giovanni Paolo II, Viale O. Flacco, 65, 70124 Bari, Italy
4 Medical Oncology Department, National Cancer Research
Centre Istituto Tumori Giovanni Paolo II, Viale O. Flacco, 65, 70124 Bari, Italy
to a mutation at nucleotide 1406 (G → C) leading to an amino acid change from glycine to alanine. G469 is part of the tip of a glycine-rich loop that coordinates the active site on BRAF, and its mutation in alanine leads to a con-stitutively active state of the enzyme with unregulated cell activity. The BRAF G469A mutation, frequently recovers in lung cancer, is rare in melanoma (7 %), and uncertain is its association with a more aggressive disease [3, 4].
Literature data evidenced the relationship between the presence of BRAF G469A and the MAP kinase cascade signaling activation [5], and nothing is reported about its role in conferring sensitivity to the BRAF inhibitors, vemu-rafenib or dabvemu-rafenib or the MEK inhibitor trametinib. Moreover, this mutation is responsible for the protein local-ization also to the mitochondria [6].
In our institute, a patient with MM was treated with fotemustine, but the disease quickly was in progress. After performing a biopsy, from which a cell line was established and named MO-1, the patient was treated with vemu-rafenib and than with ipilimumab but the prognosis remained poor.
In the newly established cell line MO-1, the mutation G469A in BRAF gene was confirmed and the absence of literature data on the possibility that this mutation can sen-sitize cells to treatment with BRAF inhibitors, as already happens when the mutation BRAF V600E is present, sug-gested to check the sensitivity of cells to vemurafenib. Moreover, MO-1 cells were characterized for the sensitivity to nab-paclitaxel (Abraxane), already in phase III clinical trials for the treatment of MM (www.clinicaltrials.gov).
Methods
Drugs
Stock solutions of nab-paclitaxel and vemurafenib were prepared at 20 mM in DMSO and stored in aliquots at −20 °C. Further dilutions were made in medium supple-mented with 10 % fetal bovine serum, 2 mM glutamine, 50,000 UL-1 penicillin and 80 μM streptomycin.
Cell lines
The MO-1 cell line was established following the protocol described in [7]. All other MM cell lines were kindly pro-vided by Dr. Guida [8]. LND1 cell line is wild type (wt) for BRAF, Hmel-1 showed BRAF mutation in V600K and MBA72 in V600E both in heterozygosis. All cell lines were wt for NRAS. Cells were cultured in vitro in D-MEM sup-plemented with 10 % fetal bovine serum, 50,000 UL-1 pen-icillin and 80 μM streptomycin in a humidified incubator at 37 °C with an atmosphere containing 5 % CO2.
Cell proliferation assay
Determination of cell growth inhibition was performed treating cells with at least 6 scalar concentrations of the drug, and after 3 days of continuous exposure, the cell growth was measured by the 3-[4,5-dimethylthiazol-2-yl]-2,5-diphenyltetrazoliumbromide (MTT) assay. The concen-tration responsible for 50 % inhibition of cell growth (IC50) was calculated as described in [9].
Protein analysis
Western blot analysis
Protein extracts were obtained by homogenization in RIPA buffer (0.5 M NaCl, 1 % Triton X100, 0.5 % NP40, 1 % deox-ycolic acid, 3.5 mM SDS, 8.3 mM Tris HCl pH 7.4, 1.6 mM Tris base) in the presence of 1 mM phenylmethylsulfonyl fluo-ride (PMSF). Total proteins were measured and analyzed by western blotting protocol as described in [9]. Expression levels were evaluated by densitometric analysis using Quantity One software (Biorad, Hercules, CA), and β-actin expression levels were used to normalize the sample values.
Flow cytometry
MITF and PMEL levels were measured by flow cytometry (FCM) utilizing the same protocol described by Azzariti et al. [10]. All monoclonal antibodies utilized were pro-vided by Cell Signaling-USA and Sigma-Aldrich, St. Louis, MO-USA. A mouse-HRP or fluorescein-conjugated and a rabbit-HRP (Amersham Pharmacia Biotech, Upsala Sweden) were used as secondary antibodies.
Cell cycle analysis
After two wash steps in ice-cold PBS (pH 7.4), cells were fixed in 4.5 ml of 70 % ethanol and stored at −20 °C. For the analysis, the pellet was resuspended in PBS containing 1 mg/ml RNase, 0.01 % NP40 and 50 μg/ml propidium iodide (PI) (Sigma). After an incubation time of 1 h in ice, cell cycle determinations were performed using a FAC-Scan flow cytometer (Becton Dickinson), and data were interpreted using the CellQuest software, provided by the manufacturer.
Cell apoptosis assay
The Annexin V-FITC Apoptosis Detection Kit (BD Bio-sciences) was used to detect apoptosis by flow cytom-etry. Cells were exposed to the drug, and after 24–72 h, they were harvested (including detached cells) and pro-cessed according to the manufacturer’s instructions.
Experiments were performed according to manufactur-er’s instructions.
Membrane depolarization assay
Changes in mitochondrial membrane potential were esti-mated using fluorescent probe JC-1. A total of 5 × 10⁵ cells
were stained for 20 min with 1 μg/ml JC-1 (Molecular
Probes) at 37 °C, and then, after 2 wash steps in PBS, cells were analyzed by FCM, collecting JC-1 green fluorescence (FL1) and JC-1 orange fluorescence (FL2).
Statistical analysis
All in vitro experiments were performed in triplicate, and results have been expressed as the mean ± standard Line Cell lines BRAF status IC50 (µM)
MBA72 V600E 3.2 ± 0.6 Hmel-1 V600K 5.5 ± 0.4 LND-1 wild type 32.2 ± 1.1 MO-1 G469A 15.03 ± 0.55 Count Count FL-1 isotype MITF MO-1 LND-1 FL-1 0 20 40 60 80 100 0 20 40 60 80 100 Vemurafenib (µM) Cell proliferation (% ) 0 0.5 1 1.5 2 2.5 3 3.5
LND-1 MBA72 Hmel-1 MO-1
Fold change of MI TF vs isotyp e p-Er k1 /2 expression Er k1 /2 Erk1/2 p-Erk1/2
A
B
C
* 0 1 2 3 4 5 6 7LND1 MBA72 Hmel-1 MO-1 Fig. 1 MO-1 cells and vemurafenib. a MO-1, LND-1, MBA72 and
Hmel-1 cells were exposed to vemurafenib (0.1 nM–100 μM) for 3 days, and then, cell growth and IC50 were evaluated as described in M&M section. b MITF expression in all cells was evaluated by flow cytometry. The histograms of MO-1 and LND-1 cells are showed,
and the quantification of results is reported in the plot in which the MITF levels of the BRAF wt LND-1 cells are statistically different from the others (*p < 0.01). c In all MM cells, the expression levels of p-Erk1/2 and Erk1/2 were determined by western blotting and the results from the densitometric analysis are reported in the plot
deviation (SD), unless otherwise indicated. p values lower than 0.05 were considered significant. Statistical analyses were performed using the GraphPad Prism software package version 5.0 (GraphPad Software Inc., San Diego, CA, USA).
Results
The significance of the mutation G469A in BRAF gene in inducing drug response in MM models was determined
by comparing the results obtained in MO-1 cells to those obtained in the other MM cells, BRAF wt or mutated. The exposure to vemurafenib for 3 days was responsible for a progressive inhibition of MO-1 cell growth as a function of drug concentration (Fig. 1a, dashed line). MO-1 (BRAF G469A) cells have the IC50 higher than those measured
in BRAF mutated cells and lower than in BRAF wt cells (Fig. 1a). Thus, the BRAF mutation G469A seems to con-fer a partial resistance to BRAF inhibitors. In support of our hypothesis, the patient, naïve for the treatment with
A
B
D
FL2-A FL2-A Co unts Co unt s JC-1 monomers JC-1 monomers JC -1 aggr eg ates JC -1 aggr eg ates Annexin VFITC PI Annexin VFITC PI MO-1 Ctrl + 6.8nM nab-paclitaxel 0 100 200 300 400 500 Nab-paclitaxel (nM) 0 20 40 60 80 100 Cell proliferatio n( %)Line Cell lines BRAF status IC50 (nM) MBA72 V600E 55.3 ± 4.4 Hmel-1 V600K 50.5 ± 6.7 LND-1 wild type 53.2 ± 4.5 MO-1 G469A 6.8 ± 0.4 MO-1 Ctrl + 6.8nM nab-paclitaxel
C
E
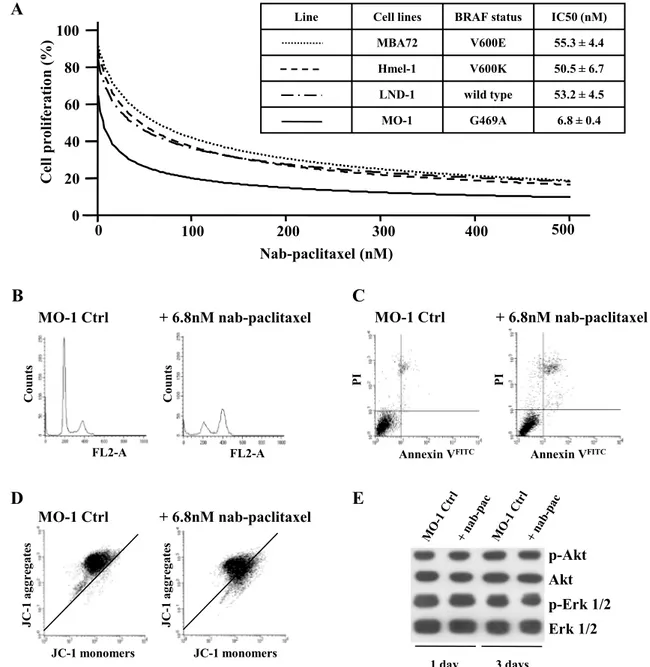
p-Akt Akt p-Erk 1/2 Erk 1/2 1 day 3 days MO-1 Ctrl + 6.8nM nab-paclitaxelFig. 2 MO-1 cells and nab-paclitaxel. a MO-1, LND-1, MBA72
and Hmel-1 cells were exposed to nab-paclitaxel (0.5–500 nM) for 3 days, and then, cell growth and IC50 were evaluated. b
Histo-grams of MO-1 cell cycle perturbation by nab-paclitaxel exposure are showed. c Apoptosis induction in MO-1 cells by exposure to
nab-paclitaxel is showed. The analysis was performed by utilizing PI/Annexin V assay. d In MO-1, the depolarization of mitochondria was evaluated by analyzing the change in fluorescence of JC-1 dye.
e Immunoblotting of p-Erk, Erk1/2, p-Akt and Akt on MO-1 cells
vemurafenib, after the relapse of the disease, was treated with this BRAF inhibitor showing a partial response to the treatment.
To investigate the cellular pathway(s) responsible for the constitutive resistance to vemurafenib related to this muta-tion, the expression levels of Erk1/2 or MITF, often altered in vemurafenib-resistant MM models, were analyzed [1]. In Fig. 1b, c, the absence of the amplification of MITF is showed together with a marked activation of Erk1/2; in fact, p-Erk1/2 level is higher than those found in all other cell lines, while MITF was similar to the BRAF mutated cells, suggesting the relevant role of the activation of the proliferation pathway in determining a low response to BRAF inhibitors [11].
The transient positive responses of the patient treated before with fotemustine and after with vemurafenib have highlighted the need to find a different and effective thera-peutic option.
The effectiveness of the nab-paclitaxel was investi-gated; this drug is a new albumin-bound form of pacli-taxel, already approved for breast cancer and in clinical trials for the treatment of MM patients [12]. MO-1 cells were treated with nab-paclitaxel for 3 days with surpris-ing results; the IC50 of nab-paclitaxel in these cells was of 6.8 nM, about tenfold lower than those obtained in all other MM cells, either BRAF wt or mutated (Fig. 2a). The capability of this taxane to perturb cell cycle pro-gression and to induce apoptosis was evaluated, and results, reported in Fig. 2, showed an accumulation of cells in G2/M phase (Fig. 2b) with a consequent induc-tion of apoptosis (Fig. 2c), probably dependent from an impairment of mitochondria functionality as suggested by measurements of mitochondrial membrane depolarization (Fig. 2d). The evaluation of the involvement of Akt and Erk1/2 in determining the response to nab-paclitaxel was done by western blotting and showed that the drug did not impact on the survival and proliferation pathways (as reported in Fig. 2e), in agreement with data in literature demonstrating that nab-paclitaxel does not modify p-Akt and p-Erk1/2 levels [13, 14].
To explain the mechanism that might be responsible for the high effectiveness of nab-paclitaxel in MO-1 cells, we explored the hypothesis recently published by Hertzman Johansson et al. who suggested that SILV/PMEL17/GP100 is transcriptionally regulated by MITF in melanocytes and melanoma, and consequently, a low expression level of MITF is responsible for the low level of SILV/PMEL17/ GP100 which in turn sensitizes cells to paclitaxel [15, 16]. In MO-1 cells, characterized by a high sensitivity to nab-paclitaxel and a low expression level of MITF, also SILV/ PMEL17/GP100 was not consistently expressed; i.e., only 1.33-fold with respect to its isotype (in FCM analysis). Conversely, this factor was twofold and threefold higher
in BRAF wild-type cells which showed high expression of MITF and low responsiveness to the drug. Thus, these results agreed with the hypothesis.
Conclusions
In conclusion, for the first time, we reported that in MM patients, the mutation G469A in BRAF gene, which in this disease has a frequency of 7 %, might be related to a high sensitivity to taxanes and a low effectiveness to BRAF inhibitors. Our study, extended to a large cell panel and validated in vivo, may lead to the optimization of therapy in MM.
Acknowledgments We thank Dr. I. Maida and Dr. S. Strippoli for
collaboration in protein analysis and in patient’s follow-up informa-tion, respectively.
Conflict of interest The authors have no conflict of interest.
References
1. Tentori L, Lacal PM, Graziani G (2013) Challenging resistance mechanisms to therapies for metastatic melanoma. Trends Phar-macol Sci 34:656–666. doi:10.1016/j.tips.2013.10.003
2. Wan PT, Garnett MJ, Roe SM, Lee S, Niculescu-Duvaz D, Good VM, Jones CM, Marshall CJ, Springer CJ, Barford D, Marais R, Cancer Genome Project (2004) Mechanism of activation of the RAF-ERK signaling pathway by oncogenic mutations of B-RAF. Cell 116:855–867
3. Kinno T, Tsuta K, Shiraishi K, Mizukami T, Suzuki M, Yoshida A, Suzuki K, Asamura H, Furuta K, Kohno T, Kushima R (2014) Clinicopathological features of nonsmall cell lung carcinomas with BRAF mutations. Ann Oncol 25:138–142. doi:10.1093/ annonc/mdt495
4. Paik PK, Arcila ME, Fara M, Sima CS, Miller VA, Kris MG, Ladanyi M, Riely GJ (2011) Clinical characteristics of patients with lung adenocarcinomas harboring BRAF mutations. J Clin Oncol 29:2046–2051. doi:10.1200/JCO.2010.33.1280
5. Flaherty KT, McArthur G (2010) BRAF, a target in mela-noma: implications for solid tumor drug development. Cancer 116:4902–4913. doi:10.1002/cncr.25261
6. Lee MH, Lee SE, Kim DW, Ryu MJ, Kim SJ, Kim SJ, Kim YK, Park JH, Kweon GR, Kim JM, Lee JU, De Falco V, Jo YS, Shong M (2011) Mitochondrial localization and regulation of BRAFV600E in thyroid cancer: a clinically used RAF inhibitor is unable to block the mitochondrial activities of BRAFV600E. J Clin Endocrinol Metab 96:E19–E30. doi:10.1210/jc.2010-1071 7. Zanna P, Maida I, Turpin Sevilla MC, Susca FC, Filotico R,
Arciuli M, Cassano N, Vena GA, Cicero R, Guida G (2011) Molecular characterization of novel melanoma cell lines. J Biol Regul Homeost Agents 25:239–247
8. Zanna P, Maida I, Grieco C, Guida S, Turpin Sevilla MC, De Summa S, Tommasi S, Vena GA, Filotico R, Guida G (2013) Three novel human sporadic melanoma cell lines: signaling pathways controlled by MC1R, BRAF and β-catenins. J Biol Regul Homeost Agents 27:131–141
9. Porcelli L, Quatrale AE, Mantuano P, Leo MG, Silvestris N, Rol-land JF, Carioggia E, Lioce M, Paradiso A, Azzariti A (2013)
Optimize radiochemotherapy in pancreatic cancer: PARP inhibi-tors a new therapeutic opportunity. Mol Oncol 7:308–322. doi:10.1016/j.molonc.2012.10.002
10. Azzariti A, Colabufo NA, Berardi F, Porcelli L, Niso M, Simone GM, Perrone R, Paradiso A (2006) Cyclohexylpiperazine deriva-tive PB28, a sigma2 agonist and sigma1 antagonist receptor, inhibits cell growth, modulates P-glycoprotein, and syner-gizes with anthracyclines in breast cancer. Mol Cancer Ther 5:1807–1816
11. Porcelli L, Guida G, Quatrale AE, Cocco T, Sidella L, Maida I, Iacobazzi RM, Ferretta A, Stolfa DA, Strippoli S, Guida S, Tommasi S, Guida M, Azzariti A (2015) Aurora kinase B inhibi-tion reduces the proliferainhibi-tion of metastatic melanoma cells and enhances the response to chemotherapy. J Transl Med 13:26. [Epub ahead of print]
12. Velho TR (2012) Metastatic melanoma—a review of current and future drugs. Drugs Context 2012:212242. doi:10.7573/ dic.212242 (eCollection 2012)
13. Rajput S, Volk-Draper LD, Ran S (2013) TLR4 is a novel deter-minant of the response to paclitaxel in breast cancer. Mol Cancer Ther 12:1676–1687. doi:10.1158/1535-7163.MCT-12-1019 14. Li S, De Souza P (2011) Ras isoprenylation and pAkt inhibition
by zoledronic acid and fluvastatin enhances paclitaxel activ-ity in T24 Bladder cancer cells. Cancers (Basel) 3:662–674. doi:10.3390/cancers3010662
15. Du J, Miller AJ, Widlund HR, Horstmann MA, Ramaswamy S, Fisher DE (2003) MLANA/MART1 and SILV/PMEL17/GP100 are transcriptionally regulated by MITF in melanocytes and mel-anoma. Am J Pathol 163:333–343
16. Hertzman Johansson C, Azimi A, Frostvik Stolt M, Shojaee S, Wiberg H, Grafström E, Hansson J, Egyházi Brage S (2013) Association of MITF and other melanosome-related proteins with chemoresistance in melanoma tumors and cell lines. Mela-noma Res 23:360–365