1
Department of Health Sciences
University of Eastern Piedmont
PhD in Molecular Medicine
Coordinator: PROF. EMANUELE ALBANO
Search for genomic micro-rearrangements through
array-CGH in patients with Intellectual Disability and
Multiple Pituitary Hormone Deficiency, with standard and
custom-design array platforms.
PhD candidate Supervisor
DOTT.ssa ILEANA FUSCO PROF. MARA GIORDANO
XXVII CYCLE
2011-2014
2
INDEX
1. INTRODUCTION
4
1.1 Copy Number Variations
5
1.1.1. CNV classification
6
1.1.2. Mechanisms of formation of Copy Number Variations
8
1.2 History of cytogenetics
10
1.3 Array-CGH
13
1.3.1 Array CGH Methodologies
13
1.3.2 Array platforms
16
1.3.3 Customized array
17
2. AIM OF THE STUDY
19
3. MATERIALS AND METHODS
21
3.1 Samples preparation: gDNA Extraction
22
3.2 gDNA Quantitation and Quality Analysis
23
3.3 Array-based CGH
24
3.4 Web-based databases
30
3.5 Customized array CGH
31
3
4. Part A: aCGH analysis in Intellectual Disability patients
33
4.1 Intellectual Disability
34
4.1.1The clinical utility of aCGH in intellectual disability
36
4.2 Recruitment of the patients
37
4.3 Results and discussion
37
4.4 Conclusion
60
5. Part B: Custom aCGH analysis in Multiple Pituitary
Hormone Deficiency patients
61
5.1 The Xq13q21 region
62
5.2 Recruitment of the patients
64
5.3 Results and discussion
64
6. REFERENCES
68
Acknowledgements
Publications
4
5
1. INTRODUCTION
1.1
Copy Number Variations
The spectrum of human genetic variation ranges from the single base pair to large chromosomal rearrangements. It has become apparent that human genomes differ more as a consequence of structural variation (SV) than of single-base-pair difference. About 10 years ago, scientists began to recognize abundant variation of an intermediate size class known as structural variation. SV was originally defined as insertions, deletions and inversions greater than 1kb in size. [1,2]
Historically, structural variation was primarily assayed cytogenetically in diseased genomes. The first report of disease caused by mega base sized genomic rearrangements was published in the early 1990s [3].
For most of twentieth century geneticists focused on large scale genomic rearrangements because these were the only variants that were visible by early cytogenetic methods. With the sequencing of human genomes now becoming routine, the operational spectrum of structural variants (SVs) and copy number variants (CNVs) has widened to include much smaller events (for example, those >50 bp in length). The challenge now is to discover the full extent of structural variation and to be able to genotype it routinely in order to understand its effects on human disease, complex traits and evolution [1,2].
The recent application of massively parallel sequencing methods has complemented microarray-based methods and has led to an exponential increase in the discovery of smaller structural-variation events. The first studies to assay CNVs primarily used microarrays with large-insert clones (known as bacterial artificial chromosomes (BACs) and oligonucleotide arrays. Subsequent microarrays have included both comparative genomic hybridization (CGH) and SNP-based arrays. With the advent of NGS technologies, new tools can detect CNVs from these data, and the use of these approaches has been particularly widespread during the past few years [1,2].
6
These alterations may have no phenotypic effect, account for adaptive traits or can underlie a disease.
Clinical geneticists need to discriminate pathogenic or high-risk variants from benign variants in patients. Database of CNVs found in apparently healthy individuals, which can include parents, siblings and population controls represents a valuable tool to the identification of polymorphic benign variants. A major challenge in the field is that there is a growing number of CNVs (known as ‘variants of unknown significance’) that are suspected to be involved in disease susceptibility but for which additional population-level data are required [2].
Recently, Zarrei M. et al. [2] have published high-quality data on healthy individuals of various ethnicities to construct an updated CNV map of the human genome. Depending on the level of stringency of the map, have been estimated that 4.8–9.5% of the genome contributes to CNV and found approximately 100 genes that can be completely deleted without producing apparent phenotypic consequences. This map will aid the interpretation of new CNV findings for both clinical and research applications [2].
1.1.1 CNV classification
A copy number variant is defined as a segment of DNA that differs in copy number compared with a representative reference genome. The term “CNV” does not imply clinical significance; therefore, a qualifier such as pathogenic or benign CNV is necessary for clear communication of clinical relevance. In addition, the term “CNV” does not imply relative dosage. Copy number loss (deletion) or copy number gain (duplication) must be specified to clarify the nature of a variation.
In many cases, the interpreting geneticist can assess the genomic content of the CNV, correlate with established clinical literature, and provide an interpretation that is unambiguous and consistent with the interpretation derived from multiple laboratories. However, given the presence of benign variants within the genome and the continual discovery of novel CNVs, assessing the clinical significance of CNVs found in a clinical setting can be challenging.
Accordingly, when a variation is extremely rare or limited clinical literature is available, interpretation and reporting practices may vary among laboratories.
7
Finding category Subcategory Definition and/or subclasses Examples
Pathogenicfor the
proband (ie, fetus)
Causative findings
Pathogenic finding explaining the phenotype or matching the indication
•22q11 microdeletion in a proband with a tetralogy of Fallot
•Trisomy 21 in a fetus referred for cytogenetic testing due to an abnormal first trimester screening (1:20 risk for Down syndrome)
• Mosaic terminal duplication 2q31.1q37.3 in a child with ASD (detected on B-Allelic frequency plot, not detected with routine karyotyping and on LogR ratio plot)22
• UPD (7) in a proband with failure to thrive22
Unexpected diagnoses
Pathogenic findings NOT explaining the phenotype or NOT matching the indication.
(a) early-onset treatable diseases (b) early-onset untreatable diseases (c) late-onset treatable diseases (d) late-onset untreatable diseases
(a) a deletion in band 10q11.21 including RET gene associated with multiple endocrine neoplasia IIA (b) DMD deletion in a male fetus referred for prenatal diagnosis because of an abnormal first trimester screening (c) a deletion in CHEK2 associated with a moderately increased risk of breast cancer and risk of other cancers in a proband with severe global developmental delay13
(d) microdeletion of 17p12 (PMP22 gene) associated with a hereditary neuropathy with liability to pressure palsies (HNPP)
Susceptibility loci
Variants associated with
neurodevelopmental disorders, but of extreme phenotypic heterogeneity and/or variable expressivity.20
16p12.1 deletion in a patient with developmental delay19
VOUS(variants of
unknown clinical significance)
—
(a) potentially pathogenic (without ‘enough’ evidence)1, 20
(b) truly VOUS (unknown significance)1 (c) likely benign (without ‘enough’ evidence for benign)1
Benign findings —
(a) benign (found in many healthy individuals)1
(b) polymorphic (found in >1% of the general population)1
Status for
recessive diseases —
Comprehensive reporting of
heterozygous recessive mutations is not recommended. However, carrier status in case of a well-characterized recessive disorder with a reasonably high
population frequency and/or with clinical features consistent with the patient’s reason for referral, may be considered for disclosure.21
Deletion of CFTR gene
Incidental
findings —
Abnormalities found by chance, unintentionally, in parents of probands
Mosaic Turner syndrome discovered on B-allelic frequency plot during quality control of the array profile of a pregnant woman referred for prenatal diagnosis due to foetal ultrasound abnormalities
8
A CNV classification is already proposed and published by several authors. The CNV is documented as clinically significant in multiple peer-reviewed publications, even if penetrance and expressivity of the CNV are known to be variable [4].
In 2014 Srebniak MI et al. proposed a generic classification of array findings, defining several subcategories (Table 1) [5].
However an international classification and terminology for array findings are indispensable in order to avoid miscommunication, to facilitate comparing cohorts studied by different researchers and to optimize pre-test counseling.
1.1.2 Mechanisms of formation of Copy Number Variations
Large-scale genomic changes, such as copy number variations (CNVs), are being increasingly discovered as a genetic source of human diversity and the pathogenic factors of diseases. Such clinical conditions resulting from human genome architecture are termed ‘genomic disorders’. Although CNVs are found throughout the genome, some regions are more prone to rearrangements than others. Recent experimental findings have explained the links between different genome architectures and CNV mutagenesis [6,7].
CNVs can be divided into two classes: recurrent CNVs, which occur in a few genomic positions with breakpoints within low copy repeats (LCRs) that are clustered together in unrelated individuals, and nonrecurrent CNVs, which are distributed throughout the genome and have unique breakpoints [6,7].
The genomic repeats (representing DNA primary structures) can be divided into LCR/or segmental duplication (SD) and high-copy repeats, which play a significant role in human evolution and have a strong association with genomic CNVs.
Stankiewicz and Lupski [8] defined region-specific low-copy repeats (LCRs) as paralogous genomic segments spanning 10–400 kb of genomic DNA and sharing ≥95%– 97% sequence identity. Compared to LCR/SD, high-copy repeats constitute a great portion of the human genome.
9
The most common type of high-copy repeats are the interspersed repeats, which cover over 44% of the human genome. One of the major classes of interspersed repeats is the retrotransposon, including short interspersed elements (SINEs), long interspersed elements (LINEs), and endogenous retroviruses (ERVs).
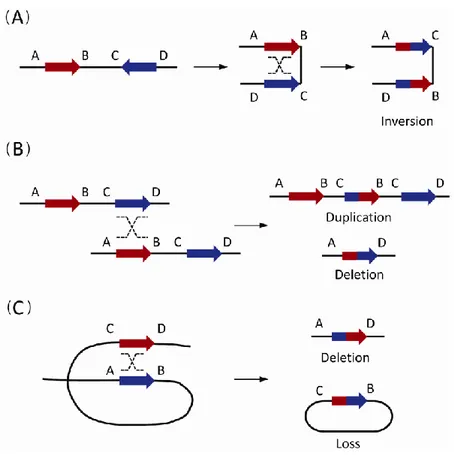
The origin of recurrent CNVs has been attributed mainly to non-allelic homologous recombination (NAHR) or defective crossing over during meiosis, when misalignment occurs due to the high degree of sequence similarity between LCRs (Fig. 1). Other studies demonstrated that also high-copy repeats, in particular Alu sequence (the most common SINEs), can induce CNV formation via classical DNA recombination based mechanisms, such as NAHR. [7,8].
Fig. 1. The non-allelic homologous recombination (NAHR) events between paired low-copy repeats (LCRs)/segmental
duplications (SDs). (A) The NAHR event between reversely oriented LCRs/SDs can cause inversion, a copy-neutral structural variation. (B) The inter-chromatid NAHR events between directly oriented LCRs/SDs result in deletions and duplications. (C) The intra-chromatid NAHR events between directly oriented LCRs/SDs can generate deletions and ring-shaped DNA segments that will be lost in subsequent cell divisions [6].
10
Nonrecurrent CNVs have scattered breakpoints and the boundaries share limited or no nucleotide homology. The origin of nonrecurrent CNVs is less clear. This categories of CNVs are of variable size and may arise via mechanisms like nonhomologous end joining (NHEJ) and replication-based mechanisms described by the fork stalling and template switching (FoSTeS) and microhomology-mediated break-induced replication (MMBIR) models.
It is becoming clear that most disease causing CNVs are nonrecurrent and generally arise via replication-based mechanisms. Patients carried nonrecurrent CNVs may share a critical region whose copy number changes results in common clinical features [6].
1.2 History of cytogenetics
In 1879 the Human cytogenetics research began with the observations of the German pathologist Arnold, who examined carcinoma and sarcoma cells because the voluminous nuclei of these cells facilitated analysis. Later, Flemming and Hansemann were the first to examine human mitotic chromosomes.
In 1888, Waldeyer coined the term “chromosome” after staining techniques had been developed to make them more discernible (chromos = Greek for colour; soma = Greek for body) [9].
In 1937 Blakeslee and Avery discovered the induction of chromosome doubling by colchicine treatment in plants [10]. After that it has been investigated the cytological mechanism causing this doubling and in the 1930s the use of colchicine for chromosome preparations has been implemented in plant cytogenetics [11].
Until Eagle developed specific culture media in 1955, the cytogenetic analysis of chromosomes depended on spontaneously dividing cells. Tjio and Levan (1956), using cultured embryonic cells, were the first researchers to report the diploid number of human chromosomes as 46 [9].
This enabled the detection of numerical chromosome aberrations like trisomy 21 in Down syndrome, 45,X in Turner syndrome, 47,XXY in Klinefelter syndrome, trisomy 13, trisomy 18, and Philadelphia chromosome in a patient with chronic myeloid leukaemia [12].
Later, many more chromosomal abnormalities, such as other trisomies, translocations, inversions, insertions, deletions, duplications and complex chromosome rearrangements, have been described.
11
Novel methods for investigating the mechanisms underlying copy number changes, characterizing gene interactions and analyzing genes within copy number variations have been developed [9].
Moorhead et al. (1960) established an in vitro culture method for the accumulation of dividing cells using colchicine to arrest cells at metaphase [13]. Subsequent technical improvements in cytogenetics included the use of phytohemagglutinin (a substance that stimulates the division of T lymphocytes in vitro) and the introduction of banding techniques at the end of the 1960s.
Banding techniques use chemical treatments to produce differentially stained regions on chromosomes. The banding pattern is highly characteristic for each chromosome and facilitates the complete identification of the human karyotype. Because the development of newer techniques has continued to increase the resolution of chromosomes, human cytogenetics has evolved from a more basic science into a valuable strategy for diagnosing prenatal, postnatal and acquired chromosomal abnormalities [1].
Conventional G-banded karyotyping remains the gold standard, but it is time-consuming (about 10-14 days is required to obtain the result), labor-intensive and the limitations to detect imbalances larger than 5–10 Mb [14]. The considerable gap between the limited resolution for observing chromosome structure through banding techniques at the light microscopy and gene levels was bridged after the introduction and application of several molecular cytogenetic approaches [9].
In 1986, Pinkel et al. [15-16] developed a method to visualize chromosomes using fluorescent-labelled probes called fluorescent in situ hybridization (FISH). FISH technology permits the detection of specific nucleic acid sequences in morphologically preserved chromosomes, cells, and tissues and the detection of specific microdeletion syndromes [12].
There are currently a number of commercially available FISH probes for the most common disorders and this method is still predominantly used when the clinical phenotype is suggestive of a particular disorder [17].
Importantly, FISH permits karyotype analysis of nuclei in non-dividing cells and has proven to be advantageous in many ways, but it is time consuming because preparations must be hybridised and then microscopically analysed. These problems led to the development of a variation of FISH called Comparative Genomic Hybridization (CGH) [12,18].
12
The CGH technique is an efficient approach to genome-wide screening for chromosomal copy number changes (gains/duplications and losses/deletions) within a single experiment. This technique was originally introduced to study chromosomal abnormalities that occur in solid tumors and other malignancies, which can be difficult to culture and is based on using tumor DNA extracted directly from either fresh or archival tissue [9].
CGH uses two genomes, a test and a control, which are differentially labeled and competitively hybridized to metaphase spreads from chromosomally normal individuals (Fig. 2). The fluorescent signal intensity of the labeled test DNA relative to that of the reference DNA can then be linearly plotted across each chromosome, allowing the identification of copy number changes [18,19]. Although chromosomal CGH has increased the potential for identifying new chromosomal abnormalities, this technique is time consuming and in addition to a poor reproducibility, does not significantly improve resolution (> 3 Mb) compared with routine G-banding chromosome analysis [9].
Later, the development of array-based CGH (array-CGH) approaches involving the substitution of metaphase chromosomes with DNA sequences adhered onto glass slides (Fig. 2), has increased the resolution for detecting copy number changes in the human genome [20,21].
It provides better quantification of copy number and more precise information on the breakpoints of segments that are lost or gained using conventional CGH [22], with a resolution that is dependent on the spacing of the probes.
For clinical testing the resolution generally involves a spacing of 50 Kb to 1 Mb between adjacent probes on the array, often with additional coverage at the subtelomeric regions. [23-24].
Because both genome-wide array CGH analysis and conventional karyotyping, based on staining chromosomes, aim to identify chromosomal aberrations by screening the genome, Vermeesch et al. proposed to call this novel technology molecular karyotyping. [25]
13
1.3
Array-CGH
Many human genetic disorders result from unbalanced chromosomal abnormalities, in which there is net gain or loss of genetic material. Traditionally, cytologists have detected such abnormalities by generating a karyotype of a person's chromosomes. In recent years, however, researchers have increasingly turned to newer cytogenetic techniques: firstly FISH, then comparative genomic hybridization and recently has been developed a newer method that combines the principles of CGH with the use of microarrays [26].
1.3.1 Array CGH Methodologies
The principle of array CGH was first described in 1997 by Solinas Toldo [20]. The first applications were published by Pinkel, Snidjers and Buckley in the following years [22].
Array-CGH is the equivalent of conducting thousands of FISH experiments at once, and it provides better quantification of copy number and more precise information on the breakpoints of segments that are lost or gained with conventional CGH [12,22].
The principle is very similar to that employed for traditional CGH, where total genomic DNA obtained from control cells and test samples are differentially labeled using green (fluorescein isothiocyanate, FITC) and red (Texas red) fluorescent dyes, denatured, co-precipitated in the presence of blocking DNA to suppress repetitive sequences and subsequently co-hybridized to normal metaphase chromosomes (Fig. 2) [9,22]. A copy number difference between test DNA and reference DNA, will alter the fluorescence ratio of the two dyes along the targets, so a chromosomal imbalances across the genome can thus be quantified and positionally defined.
In the array-CGH, instead of metaphase spreads, the hybridization targets are thousands of spots of reference DNA sequences, immobilized in a precisely gridded manner on the slide (Fig. 2).
14
Fig. 2. Comparison between CGH on chromosomes on the left and array CGH on the right. For both techniques genomic DNA of a patient (test DNA) are labeled by a fluorochrome and genomic DNA of a normal subject (reference DNA) labeled by another fluorochrome. These two DNA are cohybridized on chromosomes or genomic DNA fragments spotted on a glass. The fluorescence is captured using a camera (CGH on chromosomes), or a scanner (array CGH). The fluorescence ratio is measured by a software and presented in graphic form.[22]
Data processing plays a central role in interpretation. Various softwares have been developed allowing to process the data, facilitate the interpretation and to generate a graph of the results automatically [22]. The resolution of array CGH depends on the size of the genomic fragments as well as on their density [22,25].
The initial arrayed DNA segments could be larger (~150 kb) human DNA segments inserted into a BAC clones or bacterial/P1-derived artificial chromosomes (PAC clones). As the resolution of the array yields improved, shorter sequences have been used as targets, including smaller cDNA fragments, PCR products and oligonucleotides [9].
15
Thus, soon after the first BAC arrays were introduced, various companies developed arrays containing single-stranded oligonucleotide probes. Unlike BAC arrays, oligonucleotide arrays do not have the same underlying design concept. Variations include manufacturing method, sample throughput capacity, probe length (25–80 bases), and presence or absence of single nucleotide polymorphisms (SNPs) within the probes.
All available oligonucleotide platforms are whole-genome arrays, but they can be customized either to function as targeted arrays (similar to available targeted BAC arrays) or to substantially increase resolution in a specific genomic region of interest. This versatility will eventually prove useful as array-CGH technology becomes widespread [27].
Furthermore, array-CGH provided resolution at the nucleotide level. SNP arrays have the highest resolution (5-10 kb) of all of the available array-based platforms. The co-hybridization of the test and reference DNAs is not required because the test DNA can hybridize directly to the SNP array. In addition to CNVs, the genotype information obtained from SNP arrays enables the detection of stretches of homozygosity and thus the identification of recessive disease genes, mosaic aneuploidy or uniparental disomy (UPD) [9].
While only SNP arrays enable the detection of copy number-neutral regions in the absence of heterozygosity (AOH), these arrays have limited ability to detect single-exon copy CNVs due to the distribution of SNPs across the genome. Combining both array-CGH and SNP genotyping in a single platform optimizes the clinical diagnostic capability, offering the simultaneous detection of copy number neutral and small intragenic copy number changes [9].
The current limitations of the technology include the inability to detect balanced chromosome rearrangements and the equivocal nature of copy number alterations of unknown significance that may be identified. Nevertheless, it was used routinely in the clinical setting for example with a normal chromosome result in cases of intellectual disability and/or multiple congenital anomalies (MCA); as a result the diagnostic yield in this patient group has increased considerably [28].
16
1.3.2 Array platforms
As already discussed before, it has become apparent that copy number variants are quite common in the human genome and can have dramatic phenotypic effects as a result of altering gene dosage, disrupting coding sequences, or perturbing long-range gene regulation. These DNA anomalies are associated with many genetic diseases including congenital anomalies, developmental delay, and mental retardation. As a result, many arrays have been designed to diagnose these DNA alterations as well as to detect gains and losses. Identifying the specific segmental genomic alterations and the genes they contain will yield molecular targets for diagnostics and therapy. Recent studies characterized the reliability and accuracy of various CGH technologies to detect chromosomal aberrations.
In the 2007 Association of Biomolecular Resource Facilities Microarray Research Group project analyzed HL-60 DNA with five platforms, a test genome, and analysis software that would facilitate comparison of the resolution of each platform. At the time of the study, these platforms represented the state of the art for detecting chromosomal aberrations: Agilent CGH 44B Microarray, Illumina HumanHap 550 BeadChip, Affymetrix GeneChip Human Mapping 500K Array Set, a human BAC19K array developed by Roswell Park Cancer Institute, and the Affymetrix Human Genome U133 Plus 2.0 gene expression array.
Each platform was assessed on its repeatability between replicates and on detection of the reported gains and losses. It has been found that all five of the arrayCGH platforms detected 100% of the eight previously reported CNVs in almost all replicates. Thus, at this level of resolution, the selection of a platform may depend more on practical considerations such as price than on a substantial difference in technical performance [29].
Recently, Rodríguez-Revenga L et al. investigated the practical performance of three different oligonucleotide-based microarray platforms for their implementation in the molecular diagnosis of patients with idiopathic developmental delay/intellectual disability (DD/ID) [30]
The results obtained using a custom microarray (KaryoArray®) and two different commercial medium- and high-resolution whole-genome oligonucleotide microarrays (Agilent 4x44K and Agilent 244K) have been compared.
17
The first combines targeted and whole genome oligonucleotides based on the clinical and laboratory expertise.
An overall diagnostic yield of around 15% has been obtained. Their study indicated that all three platforms were suitable for detecting causal CNVs and the frequency of VOUS was similar (among 4–6% of cases).
As expected, whole custom genome-targeted array revealed less common CNVs than did the commercial platforms, which has a clear advantage in a clinical setting. This difference might be explained due to the fact that with custom array have been analyzed patients with clinical selection criteria as well the molecular characterization stricter than the others studied with the commercial one [30].
1.3.3 Customized array
The recent emergence of array comparative genomic hybridization has revolutionized the ability to identify micro-rearrangements associated with various diseases.
In recent years, CGH method using custom-designed high-density oligonucleotide-based arrays allowed the development of a powerful tool for detection of alterations at the scale of exons and made it possible to provide flexibility through the possibility of increasing the density of probes loaded on chips. This allowed the emergence of high-density (HD) chips arrays thereby increasing the number of genes tested.
Several study have been demonstrated that the contribution of this technique is undeniable compared with conventional techniques. It appeared reproducible, reliable and sensitive enough to detect heterozygous single-exon deletions or duplications, complex rearrangements and somatic mosaicism. The possibility of simultaneous analysis of several genes and its scalability make it a valuable tool for a new diagnostic approach of CNVs and should facilitate the molecular diagnosis of heterogeneous groups of diseases such as muscular dystrophies16 or mental retardation.
In addition, it improves reliability of variation detection and allows determination of boundaries precisely enough to direct targeted sequencing of breakpoints. Possibility of high scale sequencing of breakpoints will bring real progress in understanding molecular mechanisms of rearrangements, searching for genotype–phenotype correlations and to guide certain therapeutic strategies [31].
18
Another remarkable aspect of Customized High Resolution CGH-Array was the identification of additional cryptic submicroscopic imbalances in known pathogenic samples previously established by karyotype and Multiplex Ligation-dependent Probe Amplification (MLPA)/FISH, at least when phenotype does not match completely with genotype.
These findings may have additional implications on the interpretation of results regarding the complexity of the extra rearrangement and for genetic counseling. It also suggests that trisomies or submicroscopic deletions/duplications may co-exist with additional rearrangements, which in some way might contribute to the abnormal phenotypes.
Finally, it has been shown that a well design customized aCGH tool (such as KaryoArray v3.0; Agilent-based 8x60 K), may provide a good balance among prize/resolution, an excellent sensitivity and specificity for introducing Molecular Karyotyping in clinical practice [32].
19
20
2. AIM OF THE STUDY
The aim of the present study was the search for genomic micro-rearrangements through a standard array-CGH platform in a cohort of patients with intellectual disability and through a customized platform in a subset of short stature patients with pituitary anomalies.
The objective of the first part of my research was to analyze 53 patients for the presence of microrearrangements in the whole genome for diagnostic and research purposes and to dissect the phenotype in order to identify genotype-phenotype correlation and assign a possible pathogenic role to genes included in the rearranged region.
The second part of the research was the identification of genes on a candidate region on chromosome X, involved in short stature consequent to growth Hormone (GH) deficiency. This part of the project stems from the observation of an excess of males among the GHD patients (on average the male:female ratio is 2:1) and from the identification of genomic rearrangements on the Xq13-q21 region, identified with standard cytogenetic methods in males with severe short stature and other anomalies. These data indicate the presence of X-linked genetic factors strongly involved in GHD and that could explain a part, or even a large part, of the at present unexplained genetic component of the disease in males. We planned to investigate this region on the X chromosome for the presence of micro-rearrangements in a cohort of male patients affected by IGHD (Isolated Growth Hormone Deficiency) and CPHD (Combined Growth Hormone Deficiency), in which the presence of mutations in genes already known to be involved in GHD has been excluded. We used a customized array platform (Agilent) containing high oligomers coverage for the region Xq13.q21, strongly candidate for containing genes or cis-regulatory elements involved in GHD.
21
3. MATERIALS AND
METHODS
22
3. MATERIALS AND METHODS
3.1 Samples preparation: gDNA Extraction
Use reagents from the ReliaPrepTM Blood gDNA Miniprep System (Promega) - Equilibrate a thermomixer and heat block or water bath to 56°C.
- Thoroughly mix the blood sample for at least 10 minutes in a rotisserie shaker at room temperature. If the blood has been frozen, thaw completely before mixing for 10 minutes. - Dispense 20µl of Proteinase K (PK) Solution into a 1.5ml microcentrifuge tube.
- Add 200µl of blood to the tube containing the Proteinase K (PK) Solution, and briefly mix. - Add 200µl of Cell Lysis Buffer (CLD) to the tube. Cap and mix by vortexing for at least 10
seconds. This vortexing step is essential for obtaining good yields. - Incubate at 56°C for 10 minutes.
- While the blood sample is incubating, place a ReliaPrep™ Binding Column into an empty Collection Tube.
- Remove the tube from the heating block. Add 250µl of Binding Buffer (BBA), cap the tube, and mix by vortexing for 10 seconds with a vortex mixer.
Note: The lysate should be dark green at this point. This vortexing step is essential for obtaining good yields.
- Add the contents of the tube to the ReliaPrep™ Binding Column, cap it and place it in a microcentrifuge.
- Centrifuge for 1 minute at maximum speed. Check the binding column to make sure the lysate has completely passed through the membrane. If lysate is still visible on top of the membrane, centrifuge the column for another minute.
Note: The sample can be centrifuged at lower speed, if desired. Increase the centrifugation time accordingly to ensure the lysate has completely passed through the membrane.
- Remove the collection tube containing flowthrough, and discard the liquid as hazardous waste.
23
- Place the binding column into a fresh collection tube. Add 500µl of Column Wash Solution (CWD) to the column, and centrifuge for 3 minutes at maximum speed. Discard the flowthrough.
Note: If any of the wash solution remains on the membrane, centrifuge the column for another minute.
- Repeat the previous wash-Step twice for a total of three washes.
- Place the column in a clean 1.5ml microcentrifuge tube. 14. Add 50µl of Nuclease-Free Water to the column. Centrifuge for 1 minute at maximum speed.
Note: Eluting in 50µl significantly increases the concentration of the DNA but reduces yield by 25–30%. 15.
- Discard the ReliaPrep™ Binding Column, and save eluate. Do not reuse binding columns or collection tubes.
-
3.2 gDNA Quantitation and Quality Analysis
Use the NanoDrop ND-1000 UV-VIS Spectrophotometer (or equivalent) to assess gDNA concentration and purity.
UV-VIS Spectrophotometry
- In the Nanodrop program menu, select Nucleic Acid Measurement, and then select Sample Type to be DNA-50.
- Use 1.5 μL of Nuclease-Free Water to blank the instrument.
- Use 1.5 μL of each gDNA sample to measure DNA concentration. Record the gDNA concentration (ng/μL) for each sample.
- Record the A260/A280 and A260/A230 ratios. High-quality gDNA samples have an A260/A280 ratio of 1.8 to 2.0, which indicates the absence of contaminating proteins. Scanning the absorbance from 220-320 nm will show whether contaminants exist that affect absorbance at 260 nm. Check the absorbance scans for a peak at 260 nm and an overall smooth shape. The ideal 260/230 ratio for pure DNA is of 2 to 2.4.
24
3.3 Array-based CGH
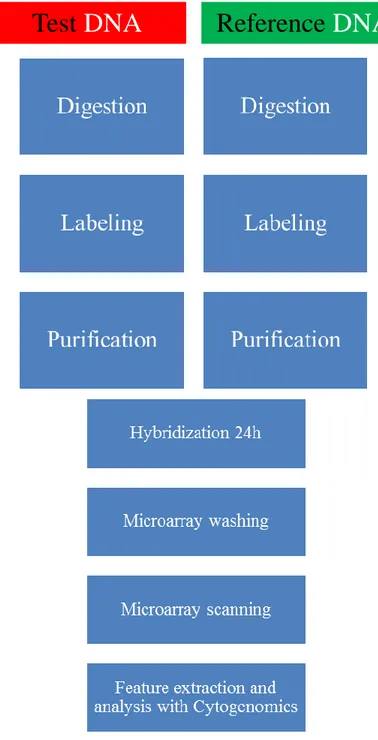
Array based CGH analysis was performed using commercially available oligonucleotide microarrays containing about 41,000 60-mer probes (SurePrint G3 Human CGH Microarray Kit 8×60K AGILENT).
Figure 3 : Direct workflow for sample preparation and microarray processing.
Reference
DNA
25
A) Samples preparation
The samples preparation was executed essentially according to the Agilent protocol (Oligonucleotide Array-Based CGH for Genomic DNA Analysis 7.3v, Fig 3).
The patient/reference DNAs (400ng) were mixed with MilliQ water to a total volume of 13 μl.
B) Digestion of gDNA
- The patient/reference DNAs were mixed with 2.5 μl Random primer solution. - Transfer sample tubes to a thermal cycler:
Step Temperature Time
Step 1 98°C 10 minutes
Step 2 4°C hold
Table 2: DNA denaturation and fragmentation using a thermal cycler.
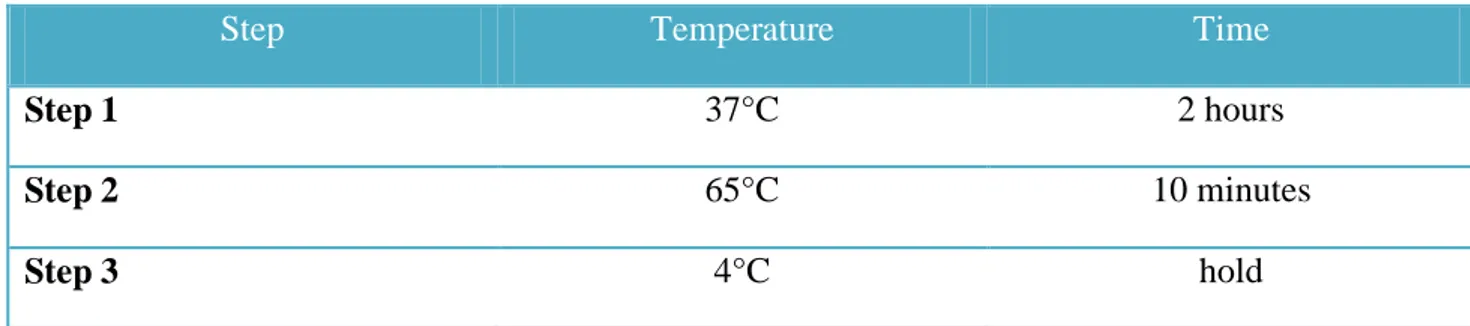
C) Fluorescent Labeling of gDNA
- Each sample was added with 5 μl of 5x Reaction Buffer, 2.5 μl of 10x dNTPs mix, 1.5 μl of Cy5-dUTP (test sample) or 1.5 μl of Cy3-dUTP (reference sample) and with 0.5 μl of Exo-Klenow.
- Transfer sample tubes to a thermal cycler:
Step Temperature Time
Step 1 37°C 2 hours
Step 2 65°C 10 minutes
Step 3 4°C hold
26
D) Purification of labeled gDNA
- Spin the labeled gDNA samples in a centrifuge for 1 minute at 6,000 × g to drive the contents off the walls and lid.
- Add 430 μL of 1×TE (pH 8.0) to each reaction tube.
- For each gDNA sample to be purified, place a column into a 2-mL collection tube and label the column appropriately. Load each labeled gDNA onto a column.
- Cover the column with a cap and spin for 10 minutes at 14,000 × g in a microcentrifuge at room temperature. Discard the flow-through and place the column back in the 2-mL collection tube.
- Add 480 μL of 1×TE (pH 8.0) to each column. Spin for 10 minutes at 14,000 × g in a microcentrifuge at room temperature. Discard the flow-through.
- Invert the column into a fresh 2-mL collection tube that has been appropriately labeled. - Spin for 1 minute at 1,000 × g in a microcentrifuge at room temperature to collect purified
sample. The volume per sample will be approximately 20 to 32 μL.
- Add 1×TE (pH 8.0), or use a concentrator to bring the sample volume to 9.5 μL. Do not excessively dry the gDNA because the pellets will become difficult to resuspend.
- Take 1.5 μL of each sample to determine yield and specific activity.
- In a fresh 200 μL Thin-Wall Tube, combine test and reference sample using the appropriate cyanine-5-labeled sample and cyanine-3-labeled sample for a total mixture volume of 16 μL.
27
E) Hybridization
- Mix the components to prepare the Hybridization Master Mix.
Component Volume (μL) per hybridization
Volume (μl) per 10 samples
Cot-1 DNA (mg/ml) 2 20
10x aCGH Blocking Agent 4.5 45
2x HI-RPM Hybridization Buffer 22.5 225
Final volume of Hybridization Master Mix 29 290
Table 4 : Hybridization Master Mix.
- Add the appropriate volume of the Hybridization Master Mix to the 200 μL Thin-Wall Tube that contains the labeled gDNA to make the total volume of 45 μL
- Mix the sample by pipetting up and down, then quickly spin in a centrifuge to drive contents to the bottom of the reaction tube.
- Transfer sample tubes to a thermal cycler.
Step Temperature Time
Step 1 98°C 3 minutes
Step 2 37°C 30 minutes
Step 3 37°C hold
28
- Remove sample tubes from the thermal cycler.
- Spin 1 minute at 6000 × g in a centrifuge to collect the sample at the bottom of the tube. - The samples are ready to be hybridized
- Load a clean gasket slide into the Agilent SureHyb chamber base with the gasket label facing up and aligned with the rectangular section of the chamber base.
- Slowly dispense hybridization sample mixture onto the gasket well
- Put a microarray slide “active side” down onto the gasket slide, so the numeric barcode side is facing up and the “Agilent”-labeled barcode is facing down. Assess that the sandwich-pair is properly aligned.
- Put the SureHyb chamber cover onto the sandwiched slides and slide the clamp assembly onto both pieces.
- Hand-tighten the clamp firmly onto the chamber.
- Vertically rotate the assembled chamber to wet the slides and assess the mobility of the bubbles. Tap the assembly on a hard surface if necessary to move stationary bubbles.
- Load each assembled chamber into the oven rotator rack. - Set your hybridization rotator to rotate at 20 rpm.
29
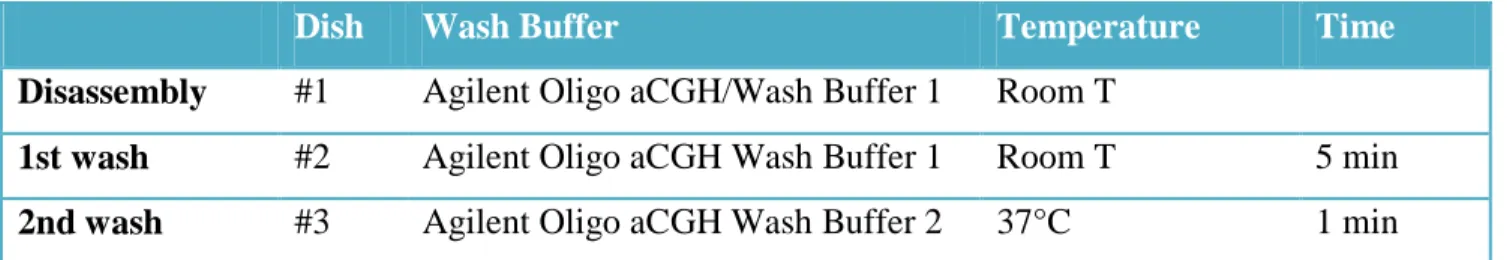
F) Microarray Wash
- Remove the hybridization chamber from the incubator.
- With gloved fingers, remove the microarray-gasket sandwich from the chamber base by lifting one end and then grasping in the middle of the long sides. Keep the microarray slide numeric barcode facing up as you quickly transfer the sandwich to slide-staining dish #1 (Table 6).
- Gently twist the forceps to separate the slides.
- Let the gasket slide drop to the bottom of the staining dish.
- Remove the microarray slide and quickly put into slide rack in the slide-staining dish #2 containing Agilent Olig aCGH/ChIP-on-Chip Wash Buffer 1 at room temperature (Table 6). Wash microarray slide for 5 minutes
- Transfer slide rack to slide-staining dish #3, which contains Agilent Oligo aCGH/ChIP-on-Chip Wash Buffer 2 at 37°C and wash microarray slide for 1 minute.
- Slowly remove the slide rack trying to minimize droplets on the slides.
- Scan slides immediately to minimize the impact of environmental oxidants on signal intensities.
Dish Wash Buffer Temperature Time
Disassembly #1 Agilent Oligo aCGH/Wash Buffer 1 Room T
1st wash #2 Agilent Oligo aCGH Wash Buffer 1 Room T 5 min
2nd wash #3 Agilent Oligo aCGH Wash Buffer 2 37°C 1 min
30
G) Microarray Scanning and Analysis
Put slides in a slide holder:
- Carefully place the end of the slide without the barcode label onto the slide ledge.
- Gently lower the microarray slide into the slide holder. Make sure that the active microarray surface faces up, toward the slide cover.
- Close the plastic slide cover, pushing on the tab end until you hear it click.
Scan the microarray slides: Agilent SureScan Microarray Scanner. - Put assembled slide holders into the scanner cassette.
- Select Protocol AgilentG3_CGH for G3 microarrays. Select Protocol AgilentHD_CGH for HD microarrays.
- Verify that the Scanner status in the main window says Scanner Ready. - Click Start Scan.
H) Microarray Analysis
- After scanning is completed, extract features and analyze.
- Feature extraction is the process by which data is extracted from the scanned microarray image (.tif) and translated into log ratios, allowing researchers to identify aberrations in their samples through Agilent CytoGenomics.
3.4 Web-based databases
Many useful databases have been developed to help in the interpretation of array-CGH results. We used UCSC Genome Browser (http://genome.ucsc.edu/cgi-bin/hgGateway), the Database of Genomic Variants (DGV, http://dgv.tcag.ca/dgv/app/home), the Database of Chromosomal Imbalance and Phenotype in Humans using Ensembl Resources (DECIPHER, https://decipher.sanger.ac.uk/ ) and the International Standards for Cytogenomic Arrays consortium (ISCA,http://clinicalgenome.org/).
31
3.5 Customized array CGH
A customized array platform (Agilent) was designed through the Agilent e-array tool (https://earray.chem.agilent.com/earray/). This platform includes a high coverage of the region Xq13q21 (at least one probe every 5 kb), a lower density coverage for all the rest of the chromosome X (at least one probe every 10 kb) and a coverage of other genomic regions already associated with GH-deficiency and pituitary development (Table 7).
X chromosome about one probe every 10 kb along entire X chromosome
Xq13q21 chrX:72,300,000-78,500,000 (about one probe every 5 kb)
GH1 cluster chr17:59,000,000-60,000,000 GHRHR chr7:30,400,000-31,600,000 GHRH chr20:35,000,000-35,800,000 FGF8 chr10:103,000,000-104,000,000 LHX4 chr1:178,000,000-179,000,000 HESX1 chr3:56,800,000-57,800,000 PROP1 chr5:177,000,000-177,700,000 LHX3 chr9:137,800,000-138,800,000 POU1F1 chr3:86,800,000-87,800,000 SOX3 chrX:139,000,000-140,000,000 SOX4 chr6:21,000,000-22,000,000 PITX1 chr5:133,800,000-134,800,000 BMP4 chr14:53,000,000-54,000,000 OTX2 chr14:55,800,000-56,800,000 15q24 chr15:72,000,000-76,000,000
Table 7: Genomic regions included in customized array platform. For each GHD gene a surrounding interval of about 1 Mb has been considered to include regulatory elements outside the coding region.
32
3.6 MLPA and PCR analysis
MLPA analysis
For each deletion/duplication a synthetic MLPA probes have been specifically designed, according to the provider’s protocol (“Designing synthetic MLPA probes”, MRC-Holland b.v. Version 14, Last update 19-12-2014) to cover the region detected by aCGH. The protocol analysis and the reference probes have been taken by the commercial SALSA MLPA probemix P200-A1 Human DNA Reference-1 (MRC-Holland, Amsterdam, Netherlands; http://www.mrc-holland.com).
PCR analysis
The deletion detected on X-chromosome through the custom aCGH was validated with a PCR experiment. Two couple of primers were designed inside and outside the deleted region.
33
4. PART A
aCGH analysis in
Intellectual Disability patients
34
Part A
4.1
Intellectual Disability
The World Health Organization defines Intellectual disability (ID) as a condition of arrested or incomplete development of the brain with the onset occurring before 18 years of age, especially characterized by impairment of skills that are manifested during the developmental period and which contribute to the overall level of intelligence (i.e. cognitive, language, motor, and social abilities).
ID is a common neurodevelopmental disorder that is characterized by an intelligence quotient (IQ) of 70 or below, and deficits in at least two behaviors related to adaptive functioning.
It is estimated that ID affects 2−3% of the paediatric population and is present in every social class and culture.
ID is a condition that involves motor function, cognitive ability, language or combinations and may become evident during infancy or early childhood as developmental delay, but it is more precisely diagnosed during school years. ID is a common problem in child health and a frequent reason for referral to a neuropsychiatrist [33,34].
ID is divided into 5 categories based on IQ: mild, moderate, severe, profound and unable to classify (DSMIV). However, epidemiological studies often use a simplified classification, dividing their subjects into mild ID (IQ50-70) and severe ID (IQ<50).
While the prevalence of severe ID is relatively stable, the prevalence of mild ID is variable and often depends heavily on external environmental factors (i.e. the level of maternal education, access to education/opportunity and access to healthcare). Study design, age of subjects, and the catchment population for the studies may also contribute to the variability seen across mild ID prevalence studies.
In addition to categorize based on severity/IQ level, ID can also be grouped into syndromic intellectual disability (SID) and non-syndromic intellectual disability (NS-ID).
35
In SID, patients present with one or multiple clinical features or co-morbidities in addition to ID. While S-ID has a clear definition, there is controversy over the classification of NS-ID. Traditionally, NS-ID has been defined by the presence of intellectual disability as the sole clinical feature. However, it has been a challenge to rule out the presence of more subtle neurological anomalies and psychiatric disorders in these patients, as they may be less apparent, or difficult to diagnose due to the cognitive impairment. Thus the distinction between S-ID and NS-ID is often unclear [35].
Causes of ID
ID can be caused by environmental and/or genetic factors. However, for up to 60% of cases, there is no identifiable cause. Environmental exposure to certain teratogens, viruses or radiation can cause ID, as can severe head trauma or injury causing lack of oxygen to the brain. While these factors explain some cases of NS-ID, it is also important to consider genetic etiology. Genetic causes of ID are thought to be present in 25–50% of cases, although this number increases proportionally with severity.
Chromosomal abnormalities have been reported in ID, with a broad range of prevalence, and many different types of aberrations have been identified. Autosomal trisomies that are compatible with human viability and aneuploidies of the X-chromosome almost always result in some degree of ID as part of a syndrome, as illustrated by trisomy 21, or Down Syndrome—the most common genetic form of ID. Additionally, pathogenic CNV have been found to be associated with ID in a large number of studies, and will likely contribute to the discovery of many ID causing genes in the future.
Over the past 15 years many single gene causes of NSID have been identified. Many of these NS-ID genes may also cause S-NS-ID, autism or other neurodevelopmental phenotypes, making it likely that other genetic modifiers or environmental factors may be involved in disease etiology. It also important the genotype/phenotype comparisons, which are often difficult to elucidate. There is also a possibility that some instances of NS-ID are multifactorial, with more than one gene contributing to disease in an individual, however this has not been well studied [35].
36
However, there is considerable discrepancy in estimates as to the percentage of cases in which an etiologic diagnosis can be established. The report of a National Institutes of Health (NIH) Consensus Conference held in 1995 concluded “that a diagnosis or cause of the mental retardation can be identified in 40–60% of all patients undergoing evaluation”, although one study reported a specific genetic or syndrome diagnosis in only 19.9% of cases [33,34].
4.1.1 The clinical utility of aCGH in Intellectual Disability
The traditional cytogenetic analysis of ID with banding techniques detects large-scale chromosomal abnormalities and has been an important diagnostic tool in the past for the identification of some causes of ID. However, conventional cytogenetic analysis cannot reliably detect rearrangements of genomic segments smaller than 3−5 million base pairs (Mb). The introduction of CGH array allowed the detection of smaller micro-deletions or duplications, thus increasing the number of ID cases in which a molecular diagnosis has been identified.
Microarray-based genomic copy-number analysis is now a commonly requested clinical genetic test for this patient population and is offered under various names, such as ‘‘chromosomal microarray’’ (CMA) and ‘‘molecular karyotyping”. A specific genetic diagnosis facilitates comprehensive medical care and accurate recurrence risk counseling for the family. A retrospective analysis of 36,325 patients with ID estimated that a pathogenic abnormality could be detected in ~19% of unselected ID patients via genome-wide array-based assays with a 30–70 kb median probe spacing [36].
Array CGH enables a 100-1000 fold higher resolution with respect to standard karyotype (that detect imbalances larger than 5–10 Mb), but still fails to reveal any clinically relevant CNV in the majority of patients tested. Thus, a delineation of clinical criteria allowing for separation of patients with high probability of significant CNV would be desirable [37].
37
4.2 Recruitment of the patients
For this study a total of 53 pediatric patients (29 males and 24 females) have been recruited among those attending the Unit of Pediatrics, Neurology and Child Neuropsychiatry of the Hospital of Novara. All of them have been evaluated by neuropsychiatrists, pediatricians and genetists and a specific clinically recognizable syndrome was excluded in all. Patients were selected among those having intellectual disability without known etiology, in association with one or more major congenital anomalies, or dysmorphisms or both. All the patients had a normal karyotype on G banding analysis.
4.3 Results and discussion
Among 53 individuals, 16 chromosomal rearrangements not reported in the DGV as common CNV, were detected in 16 individuals (30.2%) with a male:female ratio 2.2:1. In table 8 is reported a summary of the phenotypes and the imbalances detected in these patients. Among them, seven deletions (44%) and nine duplications (56%) have been found. The estimated maximum sizes of the genomic losses and gains ranged from 94 Kb to about 9 Mb.
For each deletion/duplication a probe was designed within a gene included in the region. The analysis was performed on the patient to confirm the presence of the rearrangements. In all the selected patients the MLPA confirmed the imbalances detected by aCGH. Thus, the analysis was extended to the available parents to determine if it was inherited or arose de novo. For 9 of the 16 patients, we collected the parent’s DNA. One patient (# 7851) was adopted and for the other 6 we are still waiting for the parent’s blood samples. Two unbalances arose de novo.
Among these 16 imbalances we excluded the involvement of the detected rearrangement in two patients as it was inherited from a healthy parent, smaller than 300Kb and doesn’t contain candidate genes. It is likely that these two imbalances are rare benign rearrangements (# 7280, # 7591, Table 8). Thus, 14 of 53 patients (26%) carry potentially clinically relevant chromosomal imbalances. I here report six cases among the most relevant for the research chosen on the basis of the following criteria:
1) patients with rearrangements that have not been previously described in literature; in some cases the rearranged region includes genes strongly correlated to the phenotype
2) rearrangements in deleted/duplicated regions already described but that narrow the “minimal critical region” associated to phenotype
38
Table 8: Phenotypes description and chromosomal imbalances detected in 16 patients through a-CGH. The most relevant cases are highlighted in yellow.
Case
sex M=0;
F=1
Phenotypea Array-CGH resultsb Size (bp) Principal genes included
in the rearrangement Inheritance # 7277 0
Moderate ID,psychomotor retardation,facial
dysmorphisms
Dup. 1q21.1 - q21.2 1,221,964 GJA5, GJA8 n. d.
# 7285 1 ID,facial dysmorphisms Dup. 12q13.13 -
q14.1 9,273,199 SUOX, KIF5A, CDK4, DDIT3, RDH5, AAAS, ERBB3,TAC3,MIP, CYP27B1, AMHR2, MYO1A, TSFM, ITGA7 n. d. # 7323 0 ID, congenital hypothyroidism, abnormal isoleucine metabolism
Del. 15q13.2 - q13.3 1,899,633 CHRNA7, TRPM1 Maternal
# 7283 1
facial dysmorphisms, hirsutism, mild ID, clumsiness, an epileptic
seizure
Dup. 6q27 257,123 PDE10A, C6orf118 De novo
# 7280 0 Cryptogenetic focal
epilepsy Dup. 19p13.11 - p12 273,297 - Paternal
# 7281 0 language delay, facial
dysmorphisms, ID Dup. Xq13.1 - q13.2 288,428 HDAC8, PHKA1 Maternal
# 7278 0 ID, Epilepsy Del. Xq24 94,499 SLC25A43, SLC25A5 Maternal
# 7616 1 focal epilepsy,ID Dup. 16p11.2 523,388 ALDOA De novo
# 7591 1 cranial and dysmorphisms Del. 20p12.1 98,891 - Paternal
# 7789 0 Epilepsy, ID Dup. 8p23.2 517,494 CSMD1 n. d.
# 7791 0 Epilepsy, ID, Dermatitis Dup. 13q12.3 982,261 KATNAL1, HMGB1
ALOX5AP De novo
# 7731 0 Autism, mild dysmorphisms Del. 5q21.1 1,832,254 ST8SIA4, SLCO4C1,
SLCO6A1 n. d.
# 7786 0 ID,autism spectrum
disorder Del. Xq27.2 - q27.3 519,633 SPANXN4 n. d.
# 7850 0 Hypotonia, psychomotor retardation, facial dysmorphisms, SS,GHD Del. Xq21.1 5,766,170 TBX22, BRW3, POU3F4, HMGN5, SH3BGRL Maternal # 7851 0
chronic fatigue,persistent pain, hypotension, behavioural alterations
Del. 2q11.2 1,487,431 ZAP70, CNGA3 n. d.
# 7852 1 SS,GHD,scoliosis,uterus
didelphys Dup. 15q25.2 1,598,682
CPEB1, AP3B2
LOC338963 n. d.
a
ID= Intellectual Disabilit, SS=short stature, GHD=growth hormone deficiency
b
39
Patient # 7323
aCGH results:
arr15q13.2-q13.3 (30.322.138x2, 31.014.508-32.914.140x1, 32.928.004x2)
At the time of diagnosis the patient was a 13-year-old boy, born from consanguineous healthy parents of Italian origin. He presented intellectual disability, motor delay, congenital hypothyroidism, abnormal isoleucine metabolism and an IQ of 42 (WISC-III).
The pregnancy was normal until the IV month, then the mother was treated with drugs for hypertension. At birth the weight was 3150g and Apgar scores were 7/5. The standard cytogenetic analysis revealed a normal male karyotype (46,XY). The patient was negative for fragile-X syndrome analysis.
The brother of the proband at the time of neuropsychiatric evaluation was a 16 years old. He suffered from nocturnal epilepsy and he showed an IQ of 71 (WAIS-R)
Fig. 4: Pedigree of the family; the proband is indicated by an arrow.
Array CGH revealed the presence of a deletion of 1,9 Mb located on 15q13.2-q13.3 chromosome (Fig. 6). The same deletion was present in the brother and was inherited from their unaffected mother (Fig. 4).
This region contains 12 genes: TRPM1, KLF13, OTUD7A, CHRNA7, ARHGAP11A, FAN1,
40
The 15q13.3 microdeletion syndrome (OMIM #612001) is a recently described disorder characterized by a high degree of variable expressivity. Individuals with this deletion often manifest a variety of phenotypic features including intellectual disability, seizures, autism, behavioural issues, and psychiatric conditions such as schizophrenia or bipolar disorder. This deletion is inherited in approximately 75% of cases and has also been found in apparently normal individuals, consistent with incomplete penetrance.
Most patients with 15q13.3 microdeletion carry an approximately 2 Mb deletion, including 1.5 Mb of unique sequence with the remainder consisting of segmental duplications. The proximal breakpoint of the largest deletion is contiguous with breakpoint 3 (BP3) of the Prader– Willi/Angelman Syndrome critical region extending 3.95 Mb distally to BP5 (Fig. 5).
The smaller 1.5-Mb deletion has a proximal breakpoint within the larger deletion (BP4) and shares the same distal BP5. This recurrent 1.5-Mb deletion contains six genes:MRMR15, MTMR10,
TRPM1, KLF13, OTUD7A, and CHRNA7 (Fig. 6) [38,39].
Among these, CHRNA7 have been previously reported as the strongest candidate gene responsible for the clinical findings associated with 15q13.3 microdeletion syndrome [38,39].
41
The search in the Decipher and ISCA databases for similar micro-rearrangements at 15q13.3 led to the identification of nine deletions: 5 in patients with syndromic intellectual disability and developmental delay (DECIPHER 259348, 272774, 288876, 288071, 288865 Fig. 6) and 4 in cases with no further phenotype details (DECIPHER 283651, 285668,283927 and ISCA nssv577499, Fig. 6).
Recently a limited number of smaller deletions encompassing only CHRNA7 in patients with features of 15q13.3 microdeletion syndrome have been published [40,41], pointing to CHRNA7 as the gene mainly responsible for the phenotype of these patients (Fig 6).
42
The CHRNA7 gene (cholinergic receptor, neuronal nicotinic, alpha polypeptide 7, and OMIM #118511) contains 10 exons and spans approximately 75 kb on chromosome 15q13.3. It is a member of the nicotinic acetylcholine receptor superfamily of ligand-gated ion channels that mediate signal transmission at synapses. The CHRNA7 protein forms a homopentameric synaptic ion channel that is highly expressed in the brain.
The here reported family show an extremely variable expressivity and incomplete penetrance of the 15q13.3 microdeletion syndrome. The proband is severely affected with an IQ of 42 and dismorphism. The brother is mild affected and the mother is healthy.
It is interesting that the brother of the proband manifests a phenotypic features that has never been described in the 15q13.3 microdeletion syndrome. Thus, the role of CHRNA7 and possibly of other genes in the region has to be investigated.
Patient # 7283
aCGH results:
arr6q27 (165.443.883x2, 165.562.275-165.819.397x3, 165.886.755x2)
The patient was born after an uneventful pregnancy by cesarean section. The birth weight was 3140g and Apgar scores were 9/10. She is now 7 years old and present facial dysmorphisms, hirsutism, mild intellectual disability, clumsiness and a previous epileptic seizure. The mother is affected by epilepsy and in the maternal lineage the parents reported three cases not better specified of intellectual disability (II3,III2,IV1, Fig. 7).
43
Fig.7: Pedigree of the family, the proband is indicated by an arrow.
Array CGH revealed the presence ofaduplication of 257,123 bp located on 6q27 chromosome (Fig. 8). The pedigree was suggestive of a dominant heritance with incomplete penetrance (Fig. 7). However the analysis of the parents shows that the duplication was de novo as it was absent in both the parents.
44
This region contains 2 genes: PDE10A and C6orf118 (Fig. 8). To our knowledge no clear genotype-phenotype correlation has been previously described in literature.
The PDE10A gene (phosphodiesterase 10A) contains 24 exons and spans approximately 200 kb on chromosome 6q27. The 89-kDA protein encoded by this gene belongs to the cyclic nucleotide phosphodiesterase family. It plays a role in signal transduction by regulating the intracellular concentration of cyclic nucleotides.
This protein can hydrolyze both cAMP and cGMP to the corresponding nucleoside 5' monophosphate, but has higher affinity for cAMP, and is more efficient with cAMP as substrate. There are 11 different families of PDEs that vary in their substrate specificity, kinetic properties, mode of regulation, intracellular localization, and tissue expression patterns.
The most striking characteristic of PDE10A is its restricted distribution in body: is highly expressed in the brain and has limited expression in peripheral tissues. In the brain, PDE10A is highly concentrated in the basal ganglia including MSNs of the striatum. Thus, influence of PDE10A on dopamine signaling has been extensively studied [42,43,44].
There is a growing amount of evidence to suggest that PDEs play a critical role in modulating dopamine signaling and selective inhibitors of these enzymes are currently being explored as novel therapeutics to treat schizophrenia, Huntington's disease, cognitive disorders and Parkinson's disease [44].
The C6orf118 gene (chromosome 6 open reading frame 118) contains 9 exons and spans approximately 30 kb on chromosome 6q27. The protein encoded by this gene is uncharacterized. It is highly conserved among species, but there are no information on its function.
In conclusion the family showed a typical dominant with incomplete penetrance inheritance. CGH revealed a duplication encompassing a gene highly expressed in the brain, that represents a good candidate for the disease in the family. However, this is a de novo duplication suggesting a causative role in the proband.
45
Patient # 7281
aCGH results:
arrXq13.1-q13.2 (71.523.738x1, 71.550.297-71.838.724x2, 71.872.520x1)
The patient (II1), a 10-year-old boy, was the second child of non-consanguineous healthy parents. He started walking at the age of 15 months and he manifested language delay. He presented facial dysmorphisms, and intellectual disability. Karyotype and DNA analysis for Fragile X Syndrome were normal.
The brother of the proband (II2) presents a global developmental delay, motor delay and facial dysmorphisms. The two sister (II3,4) are healthy (Fig. 9).
Fig 9: Pedigree of the family, the proband is indicated by an arrow.
Array CGH revealed the presence ofa duplication of 290 kb located on Xq13.1-q13.2 chromosome (Fig. 10).The same duplication was present in the brother and was inherited from the heterozygous mother (Fig. 9). This region contains 2 genes: HDAC8 and PHKA1.
The HDAC8 gene (Histone Deacetylase 8) contains 8 exons and spans approximately 238,5 kb on chromosome Xq13.1-q13.2.
The protein encoded by this gene belongs to class I of the histone deacetylase family. It catalyzes the deacetylation of lysine residues in the histone N-terminal tails and represses transcription in large multiprotein complexes with transcriptional co-repressors.
HDACs are evolutionary conserved enzymes that remove acetyl groups from lysine residues of histones and other important cellular non-histone proteins.
46
They play a major role in epigenetic gene silencing during development, for example, X-chromosome inactivation, cell differentiation and morphogenesis. Epigenetic chromatin remodelling and DNA modifications represent the central mechanisms for regulation of gene expression during brain development.
Thus, based on the function of HDACs, increasing numbers of HDAC inhibitors are presently being developed for treatment of neuropsychiatric diseases. HDACs were already associated with disorders involving human brain development [45].
Patients with mutations in HDAC8 have features suggestive of Cornelia de Lange syndrome (CdLS). CdLS in most of the cases is a congenital autosomal dominant caused by mutations in
NIPBL, SMC3 and RAD21 genes. There are also cases of X-linked dominant form of the disease
caused by mutations in SMC1A and HDAC8 genes, characterized by facial dysmorphism, pre- and post-natal growth retardation, developmental delay, intellectual disability, and multiorgan involvement.
Mutations in HDAC8 cause a small number of CdLS cases, accounting for ~ 4% of mutations in patients. Reported mutations include missense (the most frequent type), chromosomal microdeletions or intragenic microduplications, nonsense and splice site.
A recent study reported a cohort of 38 individuals with an emerging spectrum of features caused by
HDAC8 mutations. For several individuals, the diagnosis of CdLS was not considered prior to
genomic testing. Many cases are heterozygous females, each with marked skewing of X-inactivation in peripheral blood DNA. We also identified eight hemizygous males who are more severely affected. The craniofacial appearance caused by HDAC8 mutations overlaps that of typical CdLS but often displays delayed anterior fontanelle closure, ocular hypertelorism, hooding of the eyelids, a broader nose and dental anomalies, which may be useful discriminating features [45,46,47].
![Table 1. A proposal for a generic classification of array findings [5].](https://thumb-eu.123doks.com/thumbv2/123dokorg/4809868.49802/7.893.82.817.100.1094/table-proposal-generic-classification-array-findings.webp)