Keto–enol interconversion of 2-phenacylfuran in aqueous solution
and in the presence of surfactant micelles
Paolo De Maria,*, a Antonella Fontana, a Gabriella Siani, a Antonio Arcadi, b Marco Chiarini b
a Dipartimento di Scienze del Farmaco, Università 'G. d'Annunzio', Via dei Vestini 31, I Nucleo Didattico, 66013 Chieti, Italy
b Dipartimento di Chimica, Ingegneria Chimica e Materiali della Facoltà di Scienze, Università degli Studi dell’Aquila, via Vetoio - Coppito due, 67100 L'Aquila, Italy
E-mail:[email protected]@unich.it
Dedicated to Professor Domenico Spinelli on the occasion of his 70th birthday Abstract
The equilibrium constants for the keto–enol tautomerism of 2-phenacylfuran (2PF), KT =
[enol]/[ketone], have been determined in water and in aqueous solutions of CTAB
(cetyltrimethylammonium bromide) by combining the pKaKH for ionization of the ketone,
directly measured in aqueous NaOH solutions, and the pKaEH for ionization of the enol, obtained from the corresponding rate profile of ketonization. Comparison of these equilibrium constants with those reported for some previously studied phenylacetyl- and phenacyl- heterocycles highlights the effect of an adjacent furyl group on keto–enol tautomerism. Moreover, it has been shown that micelles from cationic (CTAB) and zwitterionic [3-N,N-(dimethyl-N-myristylammonium)propanesulfonate] surfactants decrease the rate of ketonization of the enolate of 2PF and/or increase the apparent acidity of the keto form. These effects have been related to the affinity of the surfactant micelles for the enolate of 2PF. To the contrary, anionic surfactants (SDS: sodium dodecyl sulfate) do not display appreciable effects on the acidity of the keto form or on the kinetics of ketonization of the enol form of 2PF.
Keywords: Keto–enol tautomerism, acid–base catalysis, micellar catalysis, 2-phenacylfuran.
Introduction
The keto–enol interconversions of 2-phenylacetylfuran,1 2PAF, and 2-phenylacetylthiophene,2
2PAT, have been studied kinetically in aqueous solutions by combining their rates of enolisation
(kKH) with the reverse rates of ketonization of the enol, kEH, or the enolate, kE. For the latter compound it turned out that the presence of micelles from a cationic surfactant (CTAB:
cetyltrimethylammonium bromide) produces a number of interesting effects on rates and/or equilibria of the investigated processes. In particular, a significant increase (of about 2.2 pKa units) in the acidity of the keto form of 2PAT, as a carbon acid, was observed on passing from water to an aqueous solution of CTAB, owing to the interaction of the hydrophobic enolate of
2PAT with the cationic micelles of the surfactant. This increase of acidity has recently allowed
us to perform3 alkylation reactions of some hydrophobic ketones with alkyl halides in aqueous micellar solutions of a number of cationic-, zwitterionic-, and anionic surfactants. The advantage of carrying out the alkylation reactions in aqueous micellar solutions rather than in organic solvents by conventional methods4 has been outlined.3
In this paper we report our investigation of the keto–enol interconversion (Scheme 1) of 2-phenacylfuran (2PF) at 25°C in aqueous solution at different pHs in order to compare the results with those obtained previously1 for its structural isomer 2-phenylacetylfuran (2PAF) and some other structurally related ketones.
O O OH O kKH kEH Scheme 1.
In addition we have studied the effect produced by surfactants on the rates of ketonization of the enol and/or enolate of 2PF at 0.5 mol dm-3 ionic strength (NaCl), as well as the effect on the apparent acid dissociation constants of the two tautomeric forms of 2PF. Finally, we have compared the results with those obtained previously2 for 2PAT.
Results and Discussion
Ketonization reactions in buffer solutions
Reaction rates were measured in glycolate-, acetate-, phosphate-, and borate buffers in the absence of surfactant, and in cyanoacetate-, glycolate-, acetate-, cacodylate-, and propionate buffers in the presence of CTAB.
The meaning of pH, and the role of buffers in aqueous surfactants are not fully understood. However, little change in pH, even with a relatively low buffer concentration
(acetate), was observed5 in aqueous CTAB if the ionic strength was maintained high with NaCl
as in the present work. In addition it is known6 that changes in the ionic equilibria of buffers, owing to the presence of cationic surfactants, can be minimized by using hydrophilic buffers such as those used in this work.
The observed pseudo-first-order rate-constant, ke, was of the form shown in Eq. (1), in which B represents the basic component of the buffer acid BH.
ke = koEH+ k
BEHx[B] (1)
Experiments7 at constant buffer ratio, r = [B]/[BH], and different concentrations of B show the absence of a general-acid-catalysis contribution by the acidic component of the buffers.
Therefore kBEH represents the second order rate constant for the general-base catalyzed
ketonization reaction and koEH represents the first order rate constant independent of buffer concentration. The obtained results in water and in aqueous CTAB are reported in Table 1 and 2, respectively.
Table 1. Buffer ratios, r, calculated pH, slopes kBEH (= rate constants for general base catalysis), and intercepts koEH, from the plot of the experimental pseudo-first-order rate constants (ke/s-1) against concentration of buffer base B, in aqueous solution at 25°C, and ionic strength 0.5 mol dm-3 (NaCl). Base r pH koEH / s-1 kBEH / dm3mol-1s-1 HOCH2COO- 1 3.65 0.027 (± 0.010) 2.11 (± 0.05) 5 4.35 0.019 (± 0.018) 2.31 (± 0.06) CH3COO- 1 4.58 0.022 (± 0.016) 8.98 (± 0.09) 5 5.28 0.022 (± 0.05) 9.17 (± 0.44) HPO42- 1 7.02 0.24 (± 0.36) 66.8 (± 4.9) B(OH)4- 0.25 8.46 1.98 (± 0.52) 96.7 (± 7.5) 0.5 8.76 3.09 (± 0.26) 82.9 (± 8.5) 1 9.06 4.46 (± 0.41) 91.4 (± 8.4)
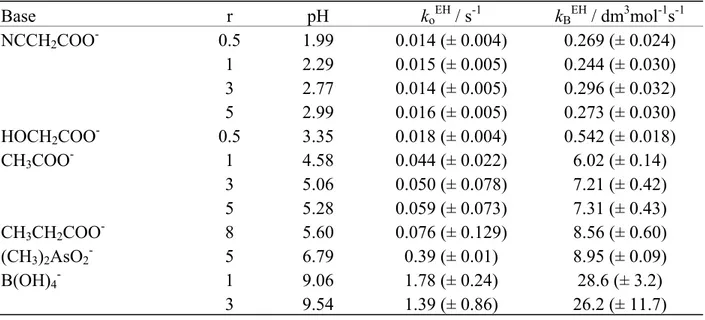
Table 2. Buffer ratios, r, calculated pH, slopes kBEH (= rate constants for general base catalysis) and intercepts koEH from the plot of the experimental pseudo-first-order rate constants (ke/s-1)
against concentration of buffer base B, in the presence of CTAB (0.01 mol dm-3) at 25°C and
ionic strength 0.5 mol dm-3 (NaCl).
Base r pH koEH / s-1 kBEH / dm3mol-1s-1 NCCH2COO- 0.5 1.99 0.014 (± 0.004) 0.269 (± 0.024) 1 2.29 0.015 (± 0.005) 0.244 (± 0.030) 3 2.77 0.014 (± 0.005) 0.296 (± 0.032) 5 2.99 0.016 (± 0.005) 0.273 (± 0.030) HOCH2COO- 0.5 3.35 0.018 (± 0.004) 0.542 (± 0.018) CH3COO- 1 4.58 0.044 (± 0.022) 6.02 (± 0.14) 3 5.06 0.050 (± 0.078) 7.21 (± 0.42) 5 5.28 0.059 (± 0.073) 7.31 (± 0.43) CH3CH2COO- 8 5.60 0.076 (± 0.129) 8.56 (± 0.60) (CH3)2AsO2- 5 6.79 0.39 (± 0.01) 8.95 (± 0.09) B(OH)4- 1 9.06 1.78 (± 0.24) 28.6 (± 3.2) 3 9.54 1.39 (± 0.86) 26.2 (± 11.7)
Ketonization reaction in dilute sodium hydroxide
Reaction rates were measured with a concentration of 2PF about 2.5 x 10⁻⁴ mol dm-3. The
following ke values were obtained at different NaOH concentrations (mol dm-3, in brackets): ke/s-1 = 14.1 (0.001); 15.4 (0.005); 14.9 (0.015).
The corresponding results in the presence of 0.01 mol dm-3 CTAB were:
ke/s-1 = 1.34 (0.001); 1.24 (0.005); 1.20 (0.01); 1.34 (0.025).
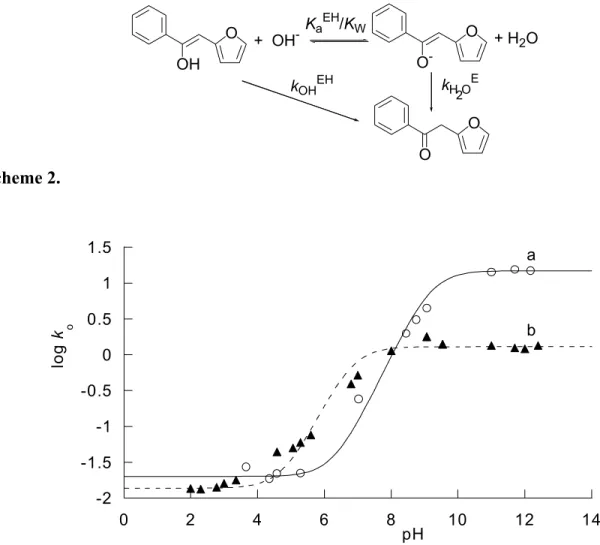
The experimental rate of ketonization is apparently independent of the concentration of OH- and this is understandable in view of the fact that there is a change in reactant from the enol at lower pH to enolate anion at high pH according to the following scheme (and the pH profiles of Figure 1). O O OH O O -O + OH- Ka EH/K W + H2O kH O2 E kOHEH Scheme 2. -2 -1.5 -1 -0.5 0 0.5 1 1.5 0 2 4 6 8 10 12 14 log k o a b pH
Figure 1. pH- Profiles for the ketonization reaction of the enol of 2PF in water (open circles, ○:
curve a) and in aqueous solutions of 0.01 mol dm-3 CTAB (full triangles, ▲: curve b). For the
significance of log ko see the ‘pH- profiles’ section in the text. pH Values are calculated values corrected for the ionic strength, 0.5 mol dm-3.
Thus, the ke values above correspond to the rate constant kH2OE for the spontaneous (water catalyzed) ketonization of the enolate anion, which is kinetically indistinguishable from the OH- catalyzed ketonization of the enol, kOHEH. The two rate constants are related by the expression: kH2OE = kOHEH KW/KaEH. The rate of ketonization of the enolate anion, kH2OE, in aqueous NaOH solutions was also studied at different concentrations of CTAB and SDS. The obtained results are presented in Figure 2.
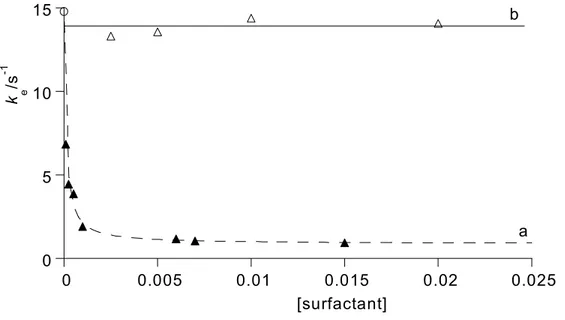
0 5 10 15 0 0.005 0.01 0.015 0.02 0.025 k e /s -1 [surfactant] a b
Figure 2. Effect of the addition of CTAB (full triangles, ▲: curve a) and SDS (open triangles, ∆:
line b) on the rate of ketonization of the enolate of 2PF (5 x 10⁻⁵ mol dm-3) in aqueous NaOH (0.01 and 0.001 mol dm-3, respectively), ionic strength 0.5 mol dm-3 (NaCl) at 25.0 ± 0.1°C. The curve (a) is the best-fit non-linear regression described by Eq. (7). The line (b) is drawn as a visual guide. The open circle, ○, is the average experimental value in water. The reported c.m.c.
values in water are 9.2 x 10⁻⁴ mol dm-3 and 8.1 x 10⁻³ mol dm-3 for CTAB8 and SDS,9
respectively.
Enolisation reactions in acetate buffers
Rates of iodination were measured with 2PF concentration about 2.5 x 10⁻⁴ mol dm-3 in acetate
buffer (r=1). All reactions were strictly zero-order with respect to the halogen concentration, with the rate-determining step being the formation of the enol.
The following pseudo-first-order rate constants, ke, were obtained at different AcO
-concentrations (mol dm-3, in brackets):
ke/s-1 = 2.49 x 10⁻⁵ (0.01); 4.01 x 10⁻⁵ (0.025); 7.18 x 10⁻⁵ (0.05); 1.00 x 10⁻⁴ (0.075);1.23 x 10⁻⁴ (0.1).
The obtained second-order rate constant, kKHAcO r=1, for the acetate-catalyzed enolisation reaction was 1.11 (± 0.04) x 10-3 mol-1dm3s-1.
Calculation of the tautomeric constant, KT
The tautomeric constant, KT = [enol]/[ketone] can be calculated1 by combining the second-order rate constants for the enolisation, kKH, and the ketonization, kEH, reactions, measured under the same conditions. Our measurements in acetate buffer (r = 1) gave KT 1.24 x 10⁻⁴ (pKT 3.91). The enolisation and ketonization rate constants were not corrected for the 0.5 mol dm-3 ionic strength and, even if ionic strength effects should not substantially affect KT values, the above-determined tautomeric constant should not correspond to the proper thermodynamic value.
pH-Profile
The profile for the ketonization reaction in aqueous solutions is reported in Figure 1 (curve a) as a plot of values of log koEH from Table 1 and of log ke (= log kH2OE for reaction in aqueous
NaOH solutions) against pH. A similar profile obtained in the presence of 0.01 mol dm-3 CTAB
for the corresponding values of log koEH from Table 2 and log ke is reported in Figure 1 (curve b). For the significance of pH in aqueous solutions of CTAB see ref. 5. Each profile shows two
regions in which the reaction is pH-independent and a region for OH- catalysis. The
pH-independent region at lower pH can be attributed to the uncatalyzed (water) reaction in which the enol initially ionizes to the enolate anion and H3O+ which then recombine to form the ketone and H2O.10 On the other hand, in the pH-independent region at higher pH, the reactant is the enolate anion which is protonated by H2O to form the ketone. The region for OH- catalysis represents the change in reactant from the enol at lower pH to the enolate anion at high pH. The points of inflections of the curves a and b of Figure 1 correspond to the pKaEH values of the enol in the
absence and in the presence of CTAB respectively. These pKaEH values may be obtained from a
best fit of experimental rate constants to Eq. (2)
ke = kH2OEH+ (kH2OExKaEH/ KW) [OH-]/(1 + (KaEH / [H+])) (2) in which kH2OEH = 0.02 s-1 and 0.01 s-1, and kH2OE = 14.8 and 1.28 s-1, are rate constants for the uncatalyzed (water) ketonizations of the enol (EH) and of the enolate (E) in the absence and in the presence of CTAB, respectively. These rate constants are the averages of the values obtained experimentally in the two pH-independent regions of the pH-profile mentioned above. The calculated pKaEH values are 9.18 (± 0.08) in aqueous solution and 6.79 (± 0.08) in the presence of CTAB.
Discussion
2-Phenacylfuran, 2PF, is acidic enough for its acid ionization constant to be directly measured in
aqueous solution (pKaKH = 13.2, see Experimental Section) and this means that the rates of
ketonization of the enol form can be determined by quenching the enolate anion in acid or buffer solutions, following a previously reported procedure.1,2 The relaxation of the enol- to its more stable keto- tautomer was monitored by stopped-flow spectrophotometry (at a wavelength near the absorption peak of the enol or enolate anion). The value of pKaEH, 9.18, obtained from the rate profile of Figure 2 (curve a), can be combined with the measured acid dissociation constant of the ketone, pKaKH, to obtain the tautomeric constant pKT = –log ([enol]/[ketone]) = pKaKH – pKaEH = 4.02 in aqueous solution at 25°C. This pKT is in quite good agreement with that (pKT = 3.91) determined as the ratio of rate constants for enolisation and ketonization (see Results Section), especially taking into account that only the former is a true thermodynamic value. In fact, the pKaKH value is extrapolated to 0 mol dm-3 NaOH concentration and the pKaEH derives from Eq. (2) in which [H+] and [OH-] allow for activity coefficients at the ionic strength, I, of 0.5 mol dm-3 (see Experimental). These results are summarized in Scheme 3.
O O OH O O -O pKT 4.02 pKaEH9.18 pKaKH 13.20 Scheme 3.
As expected, the acidity of both the enol and keto forms, as well as the enol-content of 2PF, are considerably higher than those of simple ketones such as, for example, acetone (pKaKH = 19.16, pKaEH = 10.94, pKT = 8.22)11 or acetophenone (pKaKH = 18.24, pKaEH = 10.34, pKT = 7.90)12 and are of an order expected from other aryl benzyl ketones1.
Equilibrium constants for the ionization and tautomerization of 2PF and some previously studied aryl benzyl ketones are summarized in Table 3 as their pK values.
The higher acidity (pKaKH) of 2PF than that of deoxybenzoin can be attributed to the
electron- withdrawing effect of the furyl group (σ = 1.10)16 compared with the phenyl group (σ =
0.06)17 which renders the benzyl hydrogens of 2PF more easily removable by a base. For the
same reason the enol of 2PF is more acidic (lower pKaEH) than the enol of deoxybenzoin, but the acidity difference between the two enol forms is smaller than that between the two keto forms.
Consequently, the enol content at equilibrium (pKT) is lower for deoxybenzoin, as can be
expected from the destabilization of the keto form of 2PF by the electron-withdrawing effect of the furyl group.
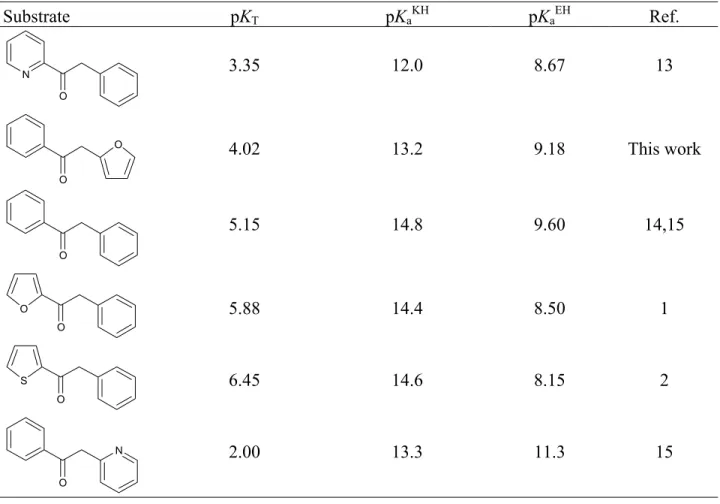
Table 3. Tautomeric constants and acid dissociation constants for the keto- and the enol- forms
of some phenylacetyl- and phenacyl- heterocycles.
Substrate pKT pKaKH pKaEH Ref. N O 3.35 12.0 8.67 13 O O 4.02 13.2 9.18 This work O 5.15 14.8 9.60 14,15 O O 5.88 14.4 8.50 1 O S 6.45 14.6 8.15 2 N O 2.00 13.3 11.3 15
On the other hand, the enol form of 2PF can be stabilized by delocalization of the furyl oxygen lone electron pair into the phenyl ring. Some stabilization of the enol by hydrogen-bonding to the furyl oxygen (see Scheme 4) is also possible, but almost certainly is less relevant than in the case of the enol of 2-phenacylpyridine11 (pKT 2.00). A destabilization of the keto form, owing to a β-oxygen substituent effect, has recently been discussed18 in detail for the isochroman-2-one with reference to α-tetralone. Noteworthy are the parallelism observed for the substitution of an oxygen atom for the β-CH2 of α-tetralone and the substitution of a furfuryl for a benzyl group in deoxybenzoin. In both cases there is a reduction in the pKT value, and an increase in the enol and the ketone acidities [(∆pKT, ∆pKaEH, ∆pKaKH)(α-tetralone−isochroman-2-one) = 2.1, 0.7, 2.7 and (∆pKT, ∆pKaEH, ∆pKaKH)(deoxybenzoin−2PF) =1.1, 0.4, 1.6]. Obviously, the interpretation of the above ∆pK values should be qualitatively the same for isochroman-2-one and 2PF although the values observed for 2PF are smaller, owing to the fact that the oxygen atom is in a γ− rather than in a β-position with respect to the enolizable carbonyl group.
O O H
Scheme 4.
Interestingly, the enol contents of 2PAF and 2PAT are considerably lower than that of 2PF: this can probably be attributed to external conjugation with the lone pair of electrons on the oxygen- and sulfur atoms which stabilizes the carbonyl groups of the keto forms of 2PAF and 2PAT, as previously suggested.1,2 Of course, an analogous stabilization of the keto form of 2PF is not possible.
Let us then discuss the major effects produced by the investigated surfactants on the keto–enol interconversion of 2PF. From the practical point of view, the most interesting effect is the reduction in pKaKH observed on passing from the aqueous- to a 10-2 mol dm-3 solution of CTAB (∆pKaKH = 2.3).
We have recently shown3 that one can take advantage of similar ∆pKaKH values, together with the hydrophobic association of the enolate anions with micelles from suitable surfactants, in performing C–C and C–O bond-formation reactions of synthetic interest in aqueous solution near room temperature. This increase in the apparent acidity of the ketone should be ascribed to the stabilization of the enolate of 2PF by the CTAB micelles, as is shown by the large difference between the binding constants, KS, of the carbon acid and its conjugate base (see Experimental Section). This stabilization is also apparent from the bathochromic shift in the UV–vis spectrum of the enolate of 2PF upon transfer from water to CTAB micelles (see below).
Besides the above-mentioned hydrophobic effect, two other factors might be responsible for the increased acidity of the ketone and the strong association of the enolate of 2PF with the cationic micelles. The first effect is the electrostatic attraction between the ammonium head groups of CTAB micelles and the OH- ions (some OH- ions might eventually substitute for Br- as the counterions in the Stern layer of the micelle of CTAB). The second effect is a similar electrostatic attraction between the enolate anion and the ammonium head groups. The importance of these electrostatic effects can be appreciated by comparing the value of pKaKH in the presence of CTAB with those obtained in the presence of a zwitterionic [3-(dimethyltetradecylammonium)propane sulfonate: SB3-14] and of an anionic (sodium dodecyl sulfate:SDS) surfactant. The apparent ∆pKaKH values are 2.3, 1.1, and zero, respectively showing that the hydrophobic association with the micelle is impossible when the enolate anion is
repelled by the negative head groups of the SDS micelles. These ∆pKaKH values are nicely
paralleled by the observed bathochromic shifts of the λmax (339 nm) of the enolate on passing
from water to 0.01 mol dm-3 CTAB (∆λ = 18 nm), 0.01 mol dm-3 SB3-14 (∆λ = 15 nm), and 0.03
mol dm-3 SDS (no shift observed).
Equally significant are some kinetic effects attributable to the presence of micelles. The rate of the “water” ketonization of the enolate of 2PF (which is kinetically equivalent to the OH
-catalyzed ketonization of the enol) is about 12 times slower in the presence of 10-2 mol dm-3 CTAB (compare the plateau values at higher pH of the profiles a and b of Figure 1). Average kH2OE values (kH2OE = ke values in aqueous sodium hydroxide) are 14.8 s-1 in the absence-, and 1.28 s-1 in the presence-, of CTAB. The progressive decrease of kH2OE with increasing amounts of CTAB can be seen in Figure 2. A similar trend with CTAB concentration was observed previously2 and discussed in detail for the rate of ketonization of the enolate of 2PAT. The main effect responsible for this rate decrease upon micellisation for the water catalyzed ketonization of the enolate anion is probably the decreased water availability within the micellar aggregates of CTAB by which the enolate is stabilized. Interestingly the same rate constant ( kH2OE) remains essentially unchanged in the presence of SDS (see Figure 2), again owing to electrostatic repulsion.
A closer insight into the pH profile in the presence of micelles of CTAB (curve b of Figure 1) highlights the consistency of kinetic rate constants obtained over a wide range of “pH” in several overlapping buffers. As suggested by Bunton6 this approach is reminiscent of that used
by Hammett in developing his Ho acidity scale and warrants to the reliability of our rate
constants in CTAB solutions. Moreover, a comparison of the pH profiles obtained in water (curve a of Figure 1) and in the presence of micelles of CTAB (curve b of Figure 1) shows that the micellar effect on the uncatalyzed (water) ketonization of the enolate, kH2OE, is much higher than that on the rate of uncatalyzed ketonization of the enol, kH2OEH. Average kH2OEH values are 0.02 s-1 in the absence-, and 0.01 s-1 in the presence of CTAB. Apparently the micelles of the cationic surfactant stabilize more effectively the negatively charged enolate anion than the neutral molecule of the corresponding enol. There is a shift to lower pHs of the profile obtained
in the presence of CTAB and this is due to the above discussed decrease of pKaEH on passing
from water (pKaEH = 9.18) to CTAB solutions (apparent pKaEH = 6.79).
Experimental Section
InstrumentsThe kinetic experiments were carried out with a Jasco V-550 UV/Vis spectrophotometer or with a Varian–Cary 1E spectrophotometer. The stopped-flow spectrophotometer was a model VI
Tri-Tech Dynamic Instruments. A 93 Radiometer pH-meter was used for the pH measurements. 1H-
and 13C- NMR spectra were recorded on a Bruker AC 200 E spectrometer.
Materials
All inorganic salts (KCl, NaCl, KI, KH2PO4, Na2HPO4), I2, cetyltrimethylammonium bromide (CTAB), 3-(N,N-dimethyl-N-myristylammonium) propanesulfonate (SB3-14), sodium dodecyl
sulfate (SDS), iodine and buffer acids [CNCH2COOH, HOCH2COOH, CH3COOH,
CH3CH2COOH, (CH3)2AsO2H, H3BO3] were commercial samples of Analar grade (Aldrich,
Merck or Carlo Erba) and were used without further purification except for CTABr, which was
recrystallized from acetone. The solvents used in extraction and purification procedures were distilled prior to use.
2-Phenacylfuran (2PF). 2-(2-Furyl)-benzoylacetate19a was prepared following a previously described procedure. Acetic acid (2.5 mL) and LiCl (2.76 g, 65.2 mmol) were added at room temperature to a solution of ethyl 2-(2-furyl)-benzoylacetate (6 g, 23.2 mmol) in NMP (N-methyl-2-pyrrolidone) (7 mL). The reaction mixture was refluxed for 1h and poured after cooling
into a biphasic system formed by a saturated aqueous solution of NaHCO3 (100 mL) and diethyl
ether (100 mL). The organic layer was then separated and the aqueous phase was extracted twice
with diethyl ether. The combined organic phases, dried over Na2SO4, were evaporated to
dryness. The crude material was purified by flash chromatography eluting with 90/10 (v/v) n-hexane/ethyl acetate mixture to give the desired 2-phenacylfuran, 2PF (4.31g, 86% yield).19b The identity of the product was confirmed by 1H- and 13C-NMR spectra.
Kinetic measurements
Rates of ketonization of the enol of 2PF, both in water and in the presence of surfactant, were measured by stopped-flow spectrophotometry upon quenching a freshly prepared solution of the
enolate anion in 0.2 mol dm-3 aqueous NaOH with 0.2 mol dm-3 HCl plus the desired
concentration of the buffer. The initial reaction that will occur on neutralization is the protonation of the enolate, resulting in a solution containing enol far in excess of its equilibrium concentration. In the case of the OH- catalyzed reaction, NaOH was only partially neutralized. The kinetics associated with the return to the equilibrium position were monitored at λmax = 339
nm in aqueous solutions and in aqueous SDS, and at λmax = 357 nm in aqueous CTAB.
The enolisation reactions were followed by halogen-trapping as previously described 20
with 2.5.10-4 mol dm-3 2PF and acetate buffer (r = 1) in the concentration range 0.01 ≤ [AcO-] ≤ 0.1 mol dm-3.
All kinetic measurements were made at 25.0 ± 0.1 °C and at an ionic strength (I) of 0.5 mol dm-3 by the addition of NaCl.
pH Values in buffer solution were calculated at 0.5 mol dm-3 ionic strength using Eq. (3) 21 in which I is the ionic strength, K
a is the ionization constant, and r is the ratio of base- to acid- concentrations of the buffer.
pH= pKa + log r +(0.512x√I)/(1 + 1.5x√I) (3) Acid ionization constants
The pKaKH values of 2PF, in water and in aqueous surfactants, were determined
spectrophotometrically in solutions of increasing concentration of sodium hydroxide. The pKaKH
values in the presence of SB3-14 and SDS surfactants were also measured for sake of comparison.
pKaKH in water. The concentration of NaOH was varied in the range 0.1–4 mol dm-3 while the
concentration of the substrate was kept constant at 5 x 10⁻⁵ mol dm-3. The absorbance
measurements were treated using Eq. (4)
KaKH = KW / KbKH = KW/ {(Amax – A)x[OH-]} / (A – Ao) (4) where A, Ao (0.009) and Amax (0.652) are absorbances at λ = 339 nm at the specified [OH-], in
water and at the highest [OH-], respectively. A thermodynamic pKaKH value of 13.2 (± 0.1) was obtained by extrapolation to zero [OH-] of a linear plot of pKaKH vs. [OH-]22 assuming that this dependence becomes linear24 below ca. 2 mol dm-3.
pKaKH in aqueous surfactants. The concentrations of the substrate, CTAB, SB3-14 and SDS
were kept constant (5 x 10⁻⁵ , 0.01, 0.01 and 0.03 mol dm-3, respectively) while the concentration
of NaOH was varied in the range 0.001 – 0.7 mol dm-3. The absorbance measurements were
treated with Eq. (4) using Ao and Amax obtained at λmax values 357, 354 and 336 nm for CTAB,
SB3-14 and SDS, respectively. The thermodynamic acid dissociation constants, pKaKH (CTAB) =
10.9 (± 0.1), pKaKH (SB3-14) = 12.1 (± 0.1) and pKaKH (SDS) = 13.4 (± 0.1), were obtained by extrapolation to zero [OH-] of the linear plots of pKaKH vs. [OH-].
Binding constants
Thanks to the bathochromic shift of λmax of the enolate due to the association of 2PF with the surfactant (S) (see Figure 2), it was possible to measure directly the binding constants (KSE) of
the enolate form of 2PF by UV–VIS spectroscopy. In the presence of CTAB the change in absorbance at λ 357 nm was measured as a function of the concentration of the surfactant in 0.2 mol dm-3 NaOH assuming that both the free and the associated enolate contribute to the observed absorbance, A. Equation (5) was derived accordingly, where [2PF]i is the initial concentration of the substrate and εE–CTAB (12504 dm3mol-1cm-1) and εE (6916 dm3mol-1cm-1) are the molar absorptivities of the associated and free enolate respectively.
A= {[2PF]ixKSEx[S] / (1 + KSEx[S])}xεE-S + {[2PF]i / (1 + KSEx[S])}xεE (5)
From a best fit of experimental A values to Eq. (5) a value is obtained of KCTABE = 7900 (±
1300) dm3mol-1.
Analogously the binding constant, KCTABKH = 690 (± 110), of the keto form with the
surfactant was determined in aqueous solution of CTAB at λmax = 246 nm.
Micellar effects upon ketonization reactions under the adopted experimental conditions can be treated2,25,26 quantitatively in terms of an equilibrium distribution of the enolate, E, between water and micelles as distinct reaction regions (Scheme 5) using Eq. (6), derived from Eq. (7), where the subscripts H2O and M refer to aqueous- and micellar pseudophases, respectively.
1/ke = {(1/kH2OE) + (KSEx [S]/kH2OE)}/{1 + (kMEx KSEx [S]/kH2OE)} (6) ke = {kH2O
E + (k
MEx KSEx [S])}/{1 + (KSEx [S])} (7)
KSE Product kH OE 2 kM E E + S E S Scheme 5.
A multiple-regression analysis of Eq. (6) by using experimental ke, kH2OE and [CTAB] values (Figure 3) affords the following results: KCTABE = 9990 (± 1480) dm3 mol-1; kME = 0.87 (± 0.04) s-1, in quite good agreement with the value of KCTABE = 7900 (± 1300) dm3 mol-1 calculated by Eq. (5) from results in aqueous solutions of CTAB in the absence of external NaCl.
0 0.2 0.4 0.6 0.8 1 0 0.005 0.01 0.015 (k e /s -1 ) -1 [CTAB] / mol dm-3
Figure 3. Plot of the experimental first-order rate constants for ketonization of the enolate of 2PF in NaOH (0.01 mol dm-3) against the stoicheiometric concentration of CTAB, fitted into Eq. (6) (solid line).
A similar spectrophotometric determination of the binding constants (KSB3-14E) of the enolate
form of 2PF with the zwitterionic surfactant SB3-14 gave a KSB3-14E = 845 (± 82) dm3 mol-1
while the absorbance of 2PF solution decreases on addition of SDS allowing no determination of the corresponding binding constant. A value of KSB3-14KH 701 (± 95) dm3 mol-1 was determined
at λmax= 247 nm for the keto form.
Acknowledgements
We thank MIUR (Rome) for financial support.
References and Notes
1. Fontana, A. and More O’Ferrall, Rory A. J. Chem. Soc., Perkin Trans. 2 1994, 2453. 2. De Maria, P.; Fontana, A. and Cerichelli, G. J. Chem. Soc. Perkin Trans. 2 1997, 2329. 3. Cerichelli, G.; Cerritelli, S.; Chiarini, M.; De Maria, P.; Fontana, A. Chem. Eur. J. in press.
4. March, J. Advanced Organic Chemistry: Reactions, Mechanisms, and Structure, Wiley,
New York, 4th ed., 1992.
5. Bunton, C. A.; Minch, M. J. J. Phys. Chem. 1974, 78, 1490. 6. Bunton, C. A.; Wolfe, B. J. Am. Chem. Soc. 1973, 95, 3742.
7. Bell, R. P. The Proton in Chemistry, Chapman and Hall, London, 2nd ed., 1973.
8. Fendler J. H. and Fendler, E. J Catalysis in Micellar and Macromolecular Systems, Academic Press, New York, 1975, p. 20.
9. Clint, J. H. Surfactant Aggregation, Blackie & Son Ltd., London, 1992, p. 105.
10. Chiang, Y.; Kresge, A. J.; Santaballa, J. A.; Wirz, J. J. Am. Chem. Soc. 1988, 110, 5506. 11. Chiang, Y.; Kresge, A. J.; Tang, Y. S.; Wirz, J. J. Am. Chem. Soc. 1984, 106, 460. 12. Chiang, Y.; Kresge, A. J.; Wirz, J. J. Am. Chem. Soc. 1984, 106, 6392.
13. McCann, G. M.; More O’Ferrall, R. A.; Walsh, S. M. J. Chem. Soc. Perkin Trans. 2 1997, 2761.
14. Kresge, A. J. Manuscript in preparation.
15. Carey, A. R. E.; Eustace, S.; More O’Ferrall, R. A.; Murray, B. A. J. Chem. Soc. Perkin Trans. 2 1993, 2285.
16. Tomasik, P.; Johnson, C. D. Adv. Heterocycl. Chem. 1976, 20, 1.
17. (a) Hansch, C.; Leo, A.; Unger, S. H.; Kim, K. H.; Nikaitani, D.; Lien, E. J. J. Med. Chem.
1973, 16, 1207; (b) Jones, R. A. Y. Physical and Mechanistic Organic Chemistry,
Cambridge University Press, Cambridge, 2nd ed., 1979.
18. Chiang, Y.; Kresge, A. J.; Meng, Q.; More O’Ferrall, R. A.; Zhu, Y. J. Am. Chem. Soc.
2001, 123, 11562.
19. (a) D'Ascoli, R.; D'Auria, M.; Piancatelli, G.; Scettri, A. Tetrahedron 1979, 35, 2905; (b) Aicart, M.; Mavoungou-Gomès, L. J. Heterocyclic Chem. 1985, 22, 921.
20. De Maria, P.; Fontana, A.; and Spinelli, D. J. Chem. Soc. Perkin Trans. 2 1991, 1067; (b) De Maria, P.; Fontana, A.; Frascari, S.; Ferroni, F.; and Spinelli, D. J. Chem. Soc. Perkin Trans. 2 1992, 825; (c) De Maria, P.; Fontana, A.; Arlotta, M.; Chimichi, S.; and Spinelli, D. J. Chem. Soc. Perkin Trans. 2 1994, 415; (d) De Maria, P.; Fontana, A.; Spinelli, D.; and Macaluso, G. Gazz. Chim. Ital. 1996, 126, 45; (e) De Maria, P.; Fontana, A.; Siani, G.; and Spinelli, D. Eur. J. Org. Chem. 1998, 1867; (f) Fontana, A.; De Maria, P.; Pierini, M.; Siani, G.;Cerritelli, S.; and Macaluso, G. J. Phys. Org. Chem. 2002, 15, 247.
21. Albert, A. and Serjeant, E. P. The Determination of Ionisation Constants, Chapman and Hall, London, 3rd ed., 1984.
ISSN 1424-6376 Page 31 ARKAT
22. The basic strength of the solutions was measured by the H- scale rather than the
stoicheiometric OH- concentration. As the basicity function H- is anchored to an infinitely
dilute standard state, the determined acidity constant is a thermodynamic value.23 23. Yagil, G. J. Phys. Chem. 1967, 71, 1034.
24. More O’Ferrall, R. A. and Ridd, J. H. J. Chem Soc. 1963, 5030.
25. Romsted, L. S. in Surfactants in Solution, eds. Mittal K. L. and Lindman, B. Plenum Press, New York, 1984, vol. 2, p. 1015.
26. (a) Bunton, C. A. and Savelli, G. Adv. Phys. Org. Chem. 1986, 22, 213; (b) Bunton, C. A.; Nome, F.; Quina, F. H.; Romsted, L. S. Acc. Chem. Res. 1991, 24, 357.