www.nature.com/scientificreports
Enhanced release of acid
sphingomyelinase-enriched
exosomes generates a lipidomics
signature in CSF of Multiple
Sclerosis patients
Damiana Pieragostino
1,2, Ilaria Cicalini
2,3, Paola Lanuti
2,4, Eva Ercolino
2,4, Maria di Ioia
5,
Mirco Zucchelli
2, Romina Zappacosta
3, Sebastiano Miscia
2,4, Marco Marchisio
2,4,
Paolo Sacchetta
1,2, Marco Onofrj
2,5& Piero Del Boccio
2,3Multiple Sclerosis (MuS) is a complex multifactorial neuropathology, resulting in heterogeneous clinical presentation. A very active MuS research field concerns the discovery of biomarkers helpful to make an early and definite diagnosis. The sphingomyelin pathway has emerged as a molecular mechanism involved in MuS, since high levels of ceramides in cerebrospinal fluid (CSF) were related to axonal damage and neuronal dysfunction. Ceramides are the hydrolysis products of sphingomyelins through a reaction catalyzed by a family of enzymes named sphingomyelinases, which were recently related to myelin repair in MuS. Here, using a lipidomic approach, we observed low levels of several sphingomyelins in CSF of MuS patients compared to other inflammatory and non-inflammatory, central or peripheral neurological diseases. Starting by this result, we investigated the sphingomyelinase activity in CSF, showing a significantly higher enzyme activity in MuS. In support of these results we found high number of total exosomes in CSF of MuS patients and a high number of acid
sphingomyelinase-enriched exosomes correlated to enzymatic activity and to disease severity. These data are of diagnostic relevance and show, for the first time, high number of acid sphingomyelinase-enriched exosomes in MuS, opening a new window for therapeutic approaches/targets in the treatment of MuS.
Multiple Sclerosis (MuS) is a highly complex CNS disease characterized by a multifactorial pathogenesis and a great heterogeneity in clinical presentation1,2. A very active MuS research field concerns the discovery of new
bio-markers helpful to understand its etiology, and to assist in early diagnosis as well as prognosis3. CSF is an excellent
source of biological information regarding the CNS, since it is in close contact and accurately reflects alterations of this system. Since the brain is the organ with one of the highest lipid concentration, lipid metabolism become of specific interest in understanding the molecular mechanism underlined to different neurological disease4,
including MuS5. Sphingolipids are integral components of biomembranes, which are involved in many cellular
functions, including cell proliferation, signaling cascades and apoptosis6. Sphingolipids include sphingomyelins
(SMs), ceramides and sphingosines, involved in the same molecular cascade, in which one component emerges from the other by sequential enzymatic reactions7. The interest in the study of the SMs pathway increased with
the use of FTY720 as an oral drug in MuS treatment. Indeed, the drug is an analogue of Sphingosine1-P, that rep-resents the last product of SMs cascade8. In addition, higher phospholipid and lower sphingolipid content were
found in white and gray matter from MuS patients compared to controls9, while sphingosine content is increased
1Department of Medical, Oral and Biotechnological Sciences, University “G. d’Annunzio” of Chieti-Pescara, Chieti, Italy. 2Centre on Aging Sciences and Translational Medicine (Ce.S.I-MeT), University “G. d’Annunzio” of Chieti-Pescara, Chieti, Italy. 3Department of Pharmacy, University “G. d’Annunzio” of Chieti-Pescara, Chieti, Italy. 4Department of Medicine and Aging Sciences, “G. d’Annunzio” University of Chieti-Pescara, Chieti, Italy. 5Department of Neuroscience, Imaging and Clinical Sciences, “G. d’Annunzio” University of Chieti-Pescara, Chieti, Italy. Correspondence and requests for materials should be addressed to P.D.B. (email: [email protected]) Received: 19 October 2017
Accepted: 1 February 2018 Published: xx xx xxxx
and CSF21 from MuS patients. In the present work, we applied a lipidomics approach for investigating CSF
phos-pholipid profile, with particular focus on SMs, in patients with MuS compared with CSF from patients suffering from Other Central and Peripheral Neurological Disease (C_OND and P_OND, respectively). Moreover, the ASMase activity in CSF of MuS patients and patients with C_OND and P_OND was measured and correlated to the number of total exosomes in CSF. Finally, CSF exosomes carrying ASMase were identified, gated and counted in the enrolled patients.
Results
Lipidomics by LC-ESI-MS/MS.
CSF lipids from 20 MuS patients and 17 OND patients were analyzed by our already reported method22 focusing on the acquisition of phosphatidylcholines (PCs) and SMs profile. 421signals of PCs and SMs species were obtained following the data processing described in method section, and their relative intensities were subjected to different explorative statistical approaches with the aim of highlighting specific altered lipid patterns in MuS. Figure 1A shows the logistic correlation with the target (diagnosis) obtained by neural network implementation on data matrix, highlighting 96 lipid signals (inputs). The final architecture of the neural network obtained with 3 hidden neurons and its internal validation were reported in supplementary materials Fig. S1 and Table S1, respectively.
Figure 1B displays the Partial Least Squares-Discriminant Analysis (PLS-DA) score scatter plot obtained by using the 421 variables and shows an unambiguous separation between the two clinical groups analyzed (black dots for OND patients and red dots for MuS subjects). The PLS-DA analysis shows R2Y = 0.98, while Q2(cum) = 0.463 with 3 components. A number of 131 lipid signals were selected as significant with Variable Important in the Projection (VIP) score >1.0.
Finally, we used a more stringent univariate statistical analysis comparing all the 421 lipid signals taken indi-vidually. Figure 1C shows the results of univariate approach performed by using the Volcano Plot on all the PCs and SMs species. Thirty-six lipid signals are resulted discriminant metabolites between MuS and OND CSF samples. By comparing the results obtained through the three explorative approaches, thirty-two discriminant variables are resulted common, as reported in Venn diagram of Fig. 1D. These lipid signals were tentatively iden-tified by Lipidmaps/Human Metabolome (HMDB) Databases search, by the retention time and by using the mass fragmentation data, obtaining 21 putative species (4 of which unidentified). The histograms in Fig. 1E show the relative intensity of putative lipid species significantly regulated in MuS. Interestingly, the most discriminating lipids appear to be less concentrated in MuS and, in particular, all the identified SMs showed this trend.
In order to evaluate the diagnostic predictive power of the selected lipids, we performed a combined Receiver Operating Characteristic (ROC) curve in a training set of patients (80%), as well as for external validation pur-pose, we predict diagnosis for new samples (testing set, 20%). In Fig. 1F was reported the plot of the 100 permuta-tions tests using the Area Under the Curve (AUC) of the model as a measure of performance. The plot shows the AUC of all permutation, highlighting the actual observed AUC (0.942) in blu, along with showing the empirical p value (0.02). In addition, Fig. 1G shows the predicted class probabilities of each sample through the 100-cross validation, underlying good predictivity of the proposed model in discriminating MuS patients from OND (as reported in the confusion matrix associated). As external validation of the model we performed a new sample prediction analysis in the testing set of patients, showing that five patients out of six were correctly classified as reported in the Table S2 in Supplementary materials. Our lipidomics data indicate that these lipids can be used and studied as potential biomarkers of disease. As example of our lipidomics data application, we selected a sub-group of more significant SMs to build a diagnostic function to patients classification. The logistic regression model and its performance details are reported in Tables S3 and S4 in Supplementary Materials.
Acid sphingomyelinase expression and activity in CSF.
ASMase is a key enzyme in sphingolipid metabolism and it is involved in the regulation of cell fate and signaling via hydrolysis of sphingomyelin to cer-amide. Recently, an involvement of this enzyme in MuS and in particular in demyelination mechanism was estab-lished6,14. These studies are in agreement with our lipidomics results where the low levels of several SMs in CSFof MuS patients means an altered sphingolipid metabolism. To elucidate the potential involvement of ASMase in MuS, we analyzed the expression and the activity of secretory isoforms16 of ASMase in CSF. Figure 2A shows
the expression of ASMase isoforms at 57 kDa and at 75 kDa (named proSMase) in three independent pooled CSF from MuS patients (five patients for each pool) vs CSF from three pooled central OND (C_OND) and three pooled peripheral OND (P_OND). A significant increase in ASMase expression in MuS patients (p < 0.001, Mann-Whitney test) was detected, but no differences in expression resulted by the proSMase isoform at 75 kDa. We used a modified published method23 for measuring ASMase activity in human CSF (of the same pooled
www.nature.com/scientificreports/
Figure 1. (A) The logistic correlation with the target (diagnosis) obtained by neural network implementation on 421 lipid signals, highlighting 96 lipid signals (inputs). The logistic correlation is reported as a numeric value between 0 and 1 that expresses the strength of the relationship between a single input and output variables. (B) Partial Last Square Discriminant Analysis (PLS-DA) scores scatter plot calculated on three components by using the 421 variables. The supervised multivariate analysis shows R2Y = 0.98, while Q2(cum) = 0.463. The PLS-DA shows unambiguous separation between the two clinical groups (black dots for OND patients and red dots for MuS). (C) Volcano Plot built on 421 Variables. The volcano plot is a combination of fold change (FC) and t-tests. The x-axis is log2 FC and the Y-axis is log10 (p-value) obtained by non-parametric test and by assuming unequal variance for both classes. The light blue dots are the non-significant variables and the red dots are significant with the −log10 (p-value) > 1. (D) Venn diagram based on the 96 lipid signals obtained by Neural Network (N.N), 131 signals obtained by PLS-DA and 36 variables obtained by Volcano plot (V.P.). (E) Histograms reporting the relative intensity of the most significant lipid species in MuS and OND CSF. *Means p < 0.05, **means p < 0.001 and ***means p < 0.0001 obtained by Mann-Whitney test. Sphingomyelins and Phosphatidylcholines are reported according their Systematic Names. (F) Combine ROC curve of the selected lipids for the evaluation of predictive accuracy of the model, using 100 permutations tests. The plot shows the AUC of all permutation, highlighting the actual observed AUC (0.942) and the empirical p value (0.02). (G) Plot of the predicted class probabilities of each sample through the 100-cross validation, underlying good predictivity of the proposed model in discriminating MuS patients from OND. Details of the reclassification are reported in the confusion matrix associated (0 means OND and 1 means MuS).
shown in Fig. 2B, the ASMase was significantly more active in MuS than in both OND groups analyzed (p < 0.05). We measured the activity of neutral isoform of SMase in CSF. Our results, reported in Fig. S2, showed no activity of nSMase in all CSF analyzed, suggesting that the balance between SM and ceramide levels in CSF was dependent exclusively by acid isoform of the enzyme.
Acid sphingomyelinase activity in CSF as a biomarker of Multiple Sclerosis.
In order to investigate whether the measurement of ASMase activity may represent a potential diagnostic tool for MuS, we analyzed 87 Figure 2. (A) ASMase expression in pooled CSF from MuS patients vs pooled OND CSF (divided in central and peripheral disease). The histograms show the mean normalized OD of the ASMase band (57KDa) relative to the OD of the proASMase band (75KDa). Error bars show the standard error of the mean from three independent pools of each disease condition. The image of WB is cropped from the same gel reported in Fig. S7. (B) Enzymatic activity of ASMase in CSF of the same pooled samples by using fluorescent SM-FLBODIPY (reaction reported in the scheme) incubated with CSF and analyzed by HPLC-FLD. C_OND and P_OND mean Other Central and Peripheral Neurological Diseases, respectively. **Means p < 0.001 obtained by Mann-Whitney test.www.nature.com/scientificreports/
MuS CSF and 57 OND patients divided into 34 C_OND and 23 P_OND. Figure 3A shows the ASMase activity in the CSF of the enrolled patients, showing a significantly higher activity (p < 0.0001 for the Kruskal-Wallis test) in CSF of MuS patients compared to both OND groups obtained by Dunn’s multiple comparison post-test (p < 0.0001 for P_OND and p < 0.001 for C_OND).
Similar results were achieved by comparing MuS with a sub-group of inflammatory neurological diseases, sug-gesting that ASMase behavior in CSF is independent of unspecific inflammatory condition (Fig. 3B). A pearson correlation test was performed to determine if ASMase activity was age dependent, showing no significant corre-lation (p = 0.13, R2 = 0.03) as reported in Fig. S3. In Fig. 3 panels C-D are reported the ROC curves based on this activity data, showing an AUC of 0.88 (p < 0.0001), with a sensitivity of 78.16% and specificity of 86,96% in dis-tinguishing MuS patients from P_OND through a cut-off of 0.34. Whereas, the threshold that best distinguished MuS from C_OND patients was set to 0.43, resulting an AUC = 0.68 (p < 0.001), with sensitivity of 56.32% and specificity of 70.59%. More details of the performed ROC curves are reported in Supplementary Table S5.
Acid sphingomyelinase activity correlates with the number of exosomes in CSF.
ASMase is described to be matured in secretory isoform by Golgi and translocated into extracellular compartment by a still unclear mechanism16. To evaluate the potential relationship between the number of released exosomes in CSFand ASMase activity in MuS, a flow cytometry investigation was carried out. In Fig. 4 are reported representative flow cytometry data related to the exosomes content in the analyzed CSF, on the basis of their surface expression of tetraspanins Fig. 4 Panels A-C show the dot-plots of CD9 and CD63 surface expression for MuS, C_OND and P_OND CSF, respectively. Whereas, panels D-F show CD63 and CD81 positive exosomes from MuS, C_ OND and P_OND CSF, respectively. Moreover, we analyzed a subgroup of patients by staining CD9, CD63 and CD81, as well as phosphatidylserin by PerCP-conjugated Annexin-V (BD Biosciences), showing no Annexin-V+ exosomes in our samples, as reported in Fig. S4. Based on this operative scheme, were identified, gated and counted the total exosomes in CSF from 66 MuS patients and 46 OND patients (depending to CSF availability, excluded outliers and divided into 28 C_OND and 18 P_OND), finding significantly high numbers of exosomes Figure 3. (A) CSF ASMase activity calculated in 87 MuS CSF and 57 OND patients divided into 34 C_OND and 23 P_OND. (B) Comparison of CSF ASMase activity in MuS patients and a sub-group of inflammatory neurological diseases, obtained by the exclusion of non-inflammatory diseases from the OND data set. (C) Receiver Operating Characteristic (ROC) curve for ASMase activity in MuS patients vs P_OND obtaining (p < 0.0001) an Area Under the Curve (AUC) of 0.88, sensitivity = 78.16% and specificity = 86.96% for a cutoff = 0.34. (D) ROC curve for ASMase activity in MuS patients vs C_OND obtaining (p < 0.001) AUC = 0.68, sensitivity = 56.32% and specificity = 70.59% for a cutoff = 0.43. *Means p < 0.05, **means p < 0.001 and ***means p < 0.0001 of Kruskal-Wallis test with Dunn’s Multiple Comparison post-test.
in MuS compared with both OND clinical groups (p < 0.001 for the comparison between MuS and C_OND and p < 0.0001 for the comparison between MuS and P_OND, Kruskal-Wallis test), as reported in Fig. 4G. The pres-ence of exosomes was confirmed by dynamic laser light scattering experiments, where exosomes (mean diameter for the major population of 84 ± 7 nm) were detected. In particular the population is relatively homogenous as the polydispersivity index is 0.169 ± 0.07 (see Fig. 4H).
The high number of exosomes/µL was able to reclassify MuS from C_OND whit 83,33% sensitivity and 64,29% specificity, resulting in AUC = 0.74 (p < 0.0001) setting a cut off = 45 exosomes/µL (Fig. 5A). By compar-ing MuS vs P_OND (Fig. 5B) we obtained an AUC of 0.77 for a cut off = 58 exosomes/µL (sensitivity = 69.23% and specificity = 72.22%). Furthermore, our data show that the number of exosomes released in CSF is correlated Figure 4. Panels (A–C) show the dot-plots of CD9 and CD63 surface expression for MuS, C_OND and P_OND CSF, respectively. Whereas, panels (D–F) show CD63 and CD81 positive exosomes from MuS, C_OND and P_OND CSF, respectively. (G) Dots plot shows the numbers of exosomes/μL gated in CSF of MuS patients compared with both OND clinical groups. (H) Hydrodynamic radius distribution of exosomes as obtained by Dynamic Laser Light Scattering analyses in terms of intensity distribution. **Means p < 0.001 and ***means p < 0.0001 of Kruskal-Wallis test with Dunn’s Multiple Comparison post-test.
www.nature.com/scientificreports/
(p < 0.001, r = 0,323) to ASMase activity measured in 109 patients, as reported in Fig. 5C, where full dots indicate MuS samples and empty dots indicate OND patients. These data demonstrate that both CSF ASMase activity and number of CSF exosomes are able to reclassify MuS subjects. Details of ROC curves and correlations are given in Supplementary Tables S5 and S6.
Exosomes deliver active acid sphingomyelinase cargo.
To better understand the relationship between exosomes and ASMase activity in CSF, we labeled the enzyme on these nano-vesicles with a fluorescent antibody. Figure 5D shows the correlation between the ASMase amount per exosome (MFI) with the measure-ment of ASMase activity by using the same 109 patients (MuS and OND) and demonstrating a correlation among the two parameters (p < 0.001, r = 0,360), without an evident separation between the analyzed groups. In order to verify the relationship between the number of exosomes and ASMase activity we measured no ASMase activity in CSF exosomes free fraction, as reported in Fig. S5. All together, these data demonstrate that CSF exosomes seem to be the nano-carriers of secreted ASMase, and probably, they generate a specific micro-environment to permit enzymatic activity versus endogenous SMs. Therefore, the activity is deeply influenced by the amount of enzyme delivered through exosomes, independently of the disease. Meanwhile, our data show (Supplementary Fig. S6 and Table S6) that the amount of ASMase per exosome is well correlating to Expanded Disability Status Scale (EDSS) registered for patients at the time of lumbar puncture (P < 0.05, r = 0.335 for Spearman test), indicating as the ASMase carried through extracellular vesicles may play important role in disease course.Discussion
MuS is presumed to be an autoimmune disease directed against the lipid-rich myelin sheath. We showed, through lipidomics approach, decreased SMs content in MuS CSF able to discriminate disease with good statistical per-formances. Moreover, our data suggest as level of SMs may serve as potential biomarkers. Further investigation Figure 5. (A) ROC curve for number of Exosome/μL in MuS patients vs C_OND obtaining (p < 0.0001) AUC = 0.74, sensitivity = 83,33% and specificity = 64,29% for a cutoff = 45 exosomes/µl. (B) ROC curve for number of Exosome/μL in MuS patients vs P_OND obtaining AUC of 0.77 for a cut off = 58 exosomes/µl (sensitivity = 69.23% and specificity = 72.22%). (C) Significant Rank correlation (p < 0.001, r = 0,323) between ASMase activity and Exosome/μL gated in the entire patient case studies (109 patients divided into 65 MuS and 44 OND). Full dots are associated to MuS samples and empty dots for OND patients. (D) Significant Rank correlation (p < 0.001, r = 0,360) between the ASMase amount per exosome (MFI) with the measurement of ASMase activity by using the same 109 patients.
demonstrated that low levels of SMs are due to the overexpression of active ASMase carried by specific exosomes. Actually, SMs are widely distributed in the nervous tissue and they are integral component of bio membranes, involved in many cellular function, including cell proliferation, signalling cascades and apoptosis6. Between
sphingolipids, the SMs are the most abundant structural component of myelin and demonstrated that in adreno-leukodystrophy a depletion of SMs can be observed in demyelination areas, in accordance with our data11,24.
The SMs are hydrolysed to ceramide by SMases, a family of enzymes strongly dependent on environmental pH. Ceramide serves as a potential lipid second messenger or mediator molecule modulating diverse cellular signal pathways e.g. apoptosis. Recently, patients with MuS were found to have increased CSF levels of ceramide C16:0 and C24:0 and these ceramide species were sufficient to induce neuronal mitochondrial dysfunction and axonal damage12. This evidence may be correlated with high degradation of SMs consistent with our data. Between these
SMs, we found low level of C16:0 precursor (SM (d18:1/16:0)) in MuS in respect to OND.
To explain these results, we found overexpression of ASMase accompanied by high enzymatic activity in MuS CSF. Recently, ASMase was proposed as a novel target for the therapy of human autoimmune diseases, since it shows a pivotal role in regulation of human CD4 + T-cell activation and responses. In fact, several studies have shown that upon stimulation of CD3 and/or CD28, ASM-dependent ceramide signalling mediates intracellu-lar downstream signal cascades of CD3 and CD28, and regulates CD4 + T-cell activation and proliferation25.
Therefore, CD3926 and CD16127 have direct interactions with ASMase, which mediates downstream signals
including STAT3 and mTOR and thus defines human Th17 cells.
In order to investigate whether the acid isoform of the enzyme may be active in the extracellular compart-ment, we studied exosomes related to ASMase cargo by flow cytometry. In fact, it is important to emphasize that exosomes effectively separate and protect their contents from the extracellular environment allowing intact cargo to be safely transported28. In addition, it has been demonstrated that the activation of ASMase is associated with
MV release from glial cells, opening new strategies for the treatment of neuro-inflammatory disease29, even if we
did not find data on ASMase as exosomal cargo. The number of exosomes was already characterized in serum of MuS patients30 and recently, it was demonstrated that they carry transcriptome biomarkers31. In this work, we
show that the number of CSF exosomes is significantly higher in MuS patients compared to patients with OND, and that this number is correlated to CSF ASMase activity, highlighting an implication of exosomes in release and safe transport of ASMase in extracellular environment. Interestingly, we found that ASMase is located in CSF exosomes by labelling the enzyme with fluorescent antibody, showing that the ASMase abundance per exosome is strongly correlated to its activity. ASMase activity was known to act only close to membrane cell domain16, which
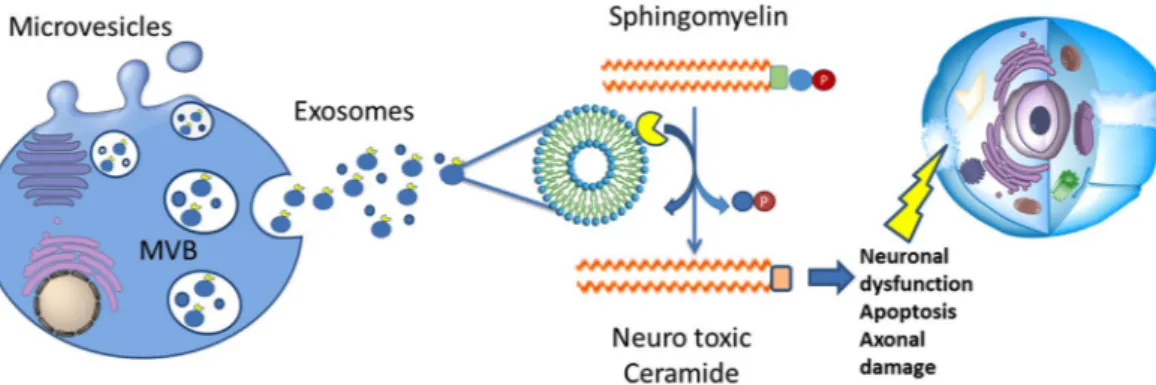
allows the correct enzymatic condition. Our data show, for the first time, a high number of released exosomes carrying a cargo of active ASMase, that probably acts far from the original cells, inducing neuronal mitochondrial dysfunction and axonal damage through the conversion of SMs in ceramides (Fig. 6). To support this hypothesis, we correlated the quantity of ASMase per exosome to Expanded Disability Status Scale (EDSS) of patients, at the time of lumbar puncture, finding significant statistical correlation (p < 0.005) between parameters. Actually, mice lacking ASMase had a significant increase in myelin recovery and a significantly higher oligodendrocyte cell count after 2 weeks remyelination compared to wildtype littermates14.
In conclusion this work shows for the first time low levels of SMs and high ASMase activity in CSF from MuS patients, meanwhile the activity of this enzyme was related to the number of exosomes and to the content of enzyme per exosome. Finally, we demonstrated that CSF exosomes seem to be nano-carriers of secreted ASMase and that the exosomal ASMase content is related to MuS severity. Therefore, we can speculate that exosomes can generate a specific micro-environment to allow enzymatic activity versus endogenous SMs. This evidence may contribute to an improved understanding of the molecular mechanisms involved in MuS as well as development of novel diagnostic and therapeutic strategies. Our findings were obtained in a comparison between MuS and other Neurologic Disorders putatively characterized by lower or similar inflammatory processes (like Chronic Inflammatory Demyelinating Polineuropathy). Futures studies may consider comparison with other, less com-mon diseases, like Neuromylitis Optica with antiacquaporin antibodies or Neurosarcoidosis, where the inflam-matory burden could be similar to MuS Patterns.
Figure 6. Proposed exosomal ASMase release and activity. The high number of released exosomes carry a cargo of active ASMase, which probably acts far from the original cells. The activity of the enzyme allows the conversion of SMs in Ceramides. Ceramides are neurotoxic messengers for cells. In particular ceramide is able to generate apoptosis, neuronal mitochondrial dysfunction and axonal damage. MVB = Multi-Vesicular Bodies.
www.nature.com/scientificreports/
Materials and Methods
Ethics Statement.
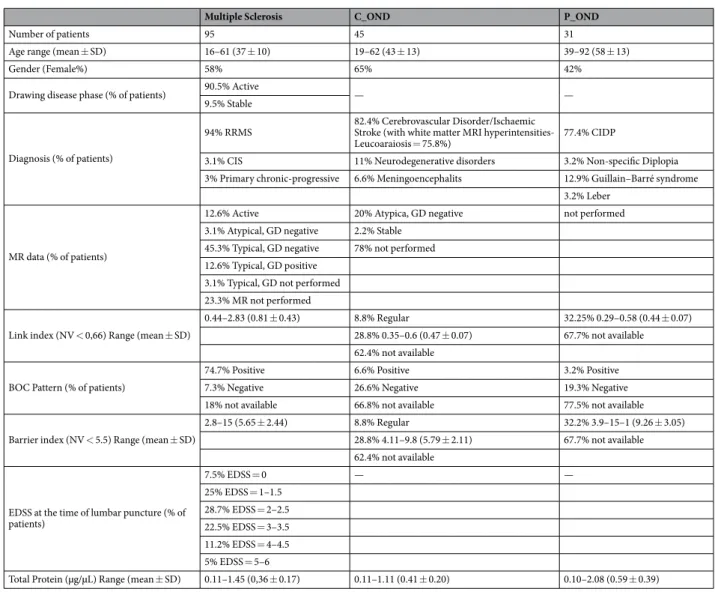
The study design was made following the guidelines for the local Ethics Committee that approved the study (n. 18 of 31 october 2013, protocol n. 176, Ethic committee of “G. d’Annunzio” University and ASL N.2 Lanciano-Vasto-Chieti, Italy), and conducted according to Declaration of Helsinki (World Medical Association, 1997). All patients were informed about the procedures and provided written informed consent to participate in the study. In order to protect human subject identity a number code was employed for specimen identification.Table 1 summarizes clinical and demographic features of the enrolled patients. All patients were selected in order to obtain age, sex and ethnicity (Caucasian people) matched cohorts of subjects. Patients with other disease course and comorbidites were excluded. CSF samples were collected at the MuS Center of Chieti (Italy) (Details are reported in Supplementary methods section).
LC-MS/MS lipidomics.
A training set of samples (20 MuS and 17 OND) was used for the untargeted lipid-omics approach. The extraction procedure was carried out on 200 µL of CSF as reported in our previous work21and in Supplementary methods.
An HPLC Alliance HT 2795 Separations Module coupled to Quattro Ultima Pt ESI tandem quadrupole mass spectrometer (Waters Corporation, Milford, MA, USA) was used for lipidomics study. The total lipid extract was injected (20 µL) and analyzed following our already reported method with few modifications concerning the profile of biological phospholipids analyzed that was focused on the acquisition of SMs and Phosphatidylcholines (PCs)22. The differential lipid signals were tentatively identified by Lipidmaps Database and HMDB database, by
the retention time and by using the mass fragmentation data.
SDS-PAGE and Western blot.
15 CSF from MuS patients and 15 CSF from OND subjects were used for SDS-PAGE and WB analysis (Example of raw WB performed was reported in Supplementary Fig. S7). CSF ASMase levels were analyzed by Western blot. Proteins were quantified by Bradford assay (Bio-Rad, München, Germany). Detail are reported in Supplementary methods.Enzymatic activity assay of sphingomyelinase.
CSF from 87 MuS patients and CSF from 57 OND subjects were studied for ASMase and nSMase activity experiments by using the fluorescent sub-strate BODIPY-FL-C12-SM (N-(4,4-difluoro-5,7- dimethyl-4-bora-3a,4a-diaza-s-indacene-3-dodecanoyl) sphingosyl-Phosphocholine (ThermoFisher scientific). 6 μL of CSF were incubated following the protocols sug-gested by Mühle et al.23 for both acid and neutral isoforms. After incubation, the enzyme reaction was stoppedat 100 °C for 10 minutes, samples were centrifuged for 15 minutes at 20880 g and finally transferred into poly-propylene vial (Waters Corporation, Milford, MA, USA) for HPLC measurement of BODIPY-FL-C12-SM as substrate and BODIPY-FL-C12-CERAMIDE as product of the enzymatic activity. A Kinetex 5 µ XB-C18 100 Å 50 × 2.10 mm (Phenomenex, P/N 00B-4605-AN, S/N 639249-6) column fitted with guard column C18 4 × 2.0 mm (Phenomenex, P/N AJ0-4286) was used, kept at 45 °C. Analytes were monitored at emission wave-length 520 nm (excitation wavewave-length 488 nm, FLD). The enzyme activity was determined as a ratio of peak area of BODIPY-FL-C12-CERAMIDE (product) and the sum of peak area of the product and the BODIPY-FL-C12-SM (substrate). Data were normalized on the total proteins content for each CSF sample. Examples of chromatograms are reported in Fig. S8 in Supplementary materials.
Exosomes staining for flow cytometry.
From each enrolled subject, 100 µL of CSF were processed by a common flow cytometry no-lyse and no-wash method32. Briefly, CSF samples were stained using CD81-FITC(1 µl, clone: JS-81, CAT: 561956, BD Biosciences), CD63-PE (5 µl, clone: H5C6, CAT: 558020, BD Biosciences), CD9-BV450 (3 µl, clone: M-L13, CAT: 658167, BD Biosciences). After 30 min of staining (4 °C in the dark), 200 µL of PBS 1× were added to each tube and 1 × 10⁶ events/sample were acquired by flow cytometry (FACSVerse, BD Biosciences - three laser, eight color configuration, or FACSCanto, BD Biosciences - three laser, eight color configuration). In a separate tube, ASMase antibody (1 µl/test, 30 min at 4 °C in the dark) was added, using its specific secondary antibody FITC-conjugated (1 µl/test, Jackson Immuno Research, Cat. 115-095-146) after a dilution step (50 µl/test). Amplifier settings for forward scatter (FSC) and side scatter (SSC) as well as for any flu-orescence channel were set in height (H) and in logarithmic mode. Exosomes scatter properties were established by running Megamix-Plus SSC beads (Biocytex, Marseille, France) at the same photomultiplier (PMT) voltages used for exosome detection. Each antibody/reagent was titrated (8 point titration) under assay conditions; dilu-tions were established based on achieving the highest signal (mean fluorescence intensity, MFI) for the positive population and the lowest signal for the negative population, representing the optimal signal to noise ratio33, and
stain indexes were calculated34. The immune complex formation and unspecific background linked to antibody
aggregation was prevented by spinning the antibody stock solution before use, at 21,000 g for 12 minutes. Instrument performances, data reproducibility and fluorescence calibrations were sustained and checked by the Cytometer Setup & Tracking Beads (BD Biosciences). In order to evaluate non-specific fluorescence, Fluorescence Minus One (FMO) controls were used35. Compensation was assessed using CompBeads and
FACSuite FC Beads (BD Biosciences) and single stained fluorescent samples. Data were analyzed using FACSuite v 1.0.5 (BD Biosciences) and FCS Express 5.01 software (De Novo Software, Glendale, CA). Exosome numbers were obtained by volumetric count.
Gating strategy. A morphological gate was placed on a SSC-H/FSC-H dot-plot on the basis of the area contain-ing the exosome compartment established by runncontain-ing MegMix-Plus SSC Beads (Biocytex, Marseille, France). The exosome compartment was analyzed for the expression of CD9, CD63 and CD81 and Annexin V (in a sub-group of patients) on the basis of the respective FMO control, while the ASMase compartment was identified on the
basis of the respective negative control (unspecific bound of the specific secondary antibody on the exosome gate). MFI Ratio for the ASMase was calculated by dividing the MFI of the positive events by the MFI of the secondary antibody alone36. Aggregates of exosomes were monitored by plotting both FSC-Area (FSC-A) signals
versus FSC-High (FSC-H) signals, or SSC-Area (SSC-A) signals versus SSC-High (SSC-H). As evidenced in the representative dot-plots reported in Fig. S9, by analyzing non-manipulated samples, the majority of exosomes (more than 98%) are single events.
Exosome sorting. Exosomes were separated, by instrumental cell sorting (70 µm nozzle, FACSAria III, BD Biosciences), on the basis of the above described flow cytometry method and gating strategy. Pure samples (92– 97% of purity) were analyzed for their size by Dynamic Light Scattering.
Dynamic Laser Light Scattering.
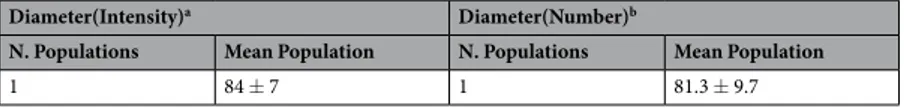
Pure exosomes dimensions have been determined through Dynamic laser Light Scattering by using a 90Plus/BI-MAS Zeta Plus multiangle particle size analyzer (Brookhaven Instruments Corp.) and showed in Table 2. The size of the exosomes has been calculated from the translational diffusion coefficient by using the Stokes-Einstein equation [d = k T/3μη D, where d is the particle diameter, k is the Boltzmann’s constant, T is the absolute temperature, k is the fluid viscosity, D is the translational diffusion coefficient]. Data have been analyzed in terms of both scattering intensity and particles number by using either a monomodal or a multimodal size distribution software depending on the specific sample. The polydispersity index has been used as a measure of the homogeneity of the exosomal population.MR data (% of patients)
12.6% Active 20% Atypica, GD negative not performed
3.1% Atypical, GD negative 2.2% Stable 45.3% Typical, GD negative 78% not performed 12.6% Typical, GD positive
3.1% Typical, GD not performed 23.3% MR not performed Link index (NV < 0,66) Range (mean ± SD)
0.44–2.83 (0.81 ± 0.43) 8.8% Regular 32.25% 0.29–0.58 (0.44 ± 0.07)
28.8% 0.35–0.6 (0.47 ± 0.07) 67.7% not available 62.4% not available
BOC Pattern (% of patients)
74.7% Positive 6.6% Positive 3.2% Positive
7.3% Negative 26.6% Negative 19.3% Negative
18% not available 66.8% not available 77.5% not available
Barrier index (NV < 5.5) Range (mean ± SD)
2.8–15 (5.65 ± 2.44) 8.8% Regular 32.2% 3.9–15–1 (9.26 ± 3.05)
28.8% 4.11–9.8 (5.79 ± 2.11) 67.7% not available 62.4% not available
EDSS at the time of lumbar puncture (% of patients) 7.5% EDSS = 0 — — 25% EDSS = 1–1.5 28.7% EDSS = 2–2.5 22.5% EDSS = 3–3.5 11.2% EDSS = 4–4.5 5% EDSS = 5–6
Total Protein (µg/µL) Range (mean ± SD) 0.11–1.45 (0,36 ± 0.17) 0.11–1.11 (0.41 ± 0.20) 0.10–2.08 (0.59 ± 0.39)
Table 1. Demographical and Clinical features of enrolled patients. C_OND = Other Central Neurological Disease; P_OND = Other Peripheral Neurological Disease; SD = Standard Deviation; RRMS = Relapsing-Remitting Multiple Sclerosis; CIS = Clinically Isolated Syndrome; MR = Magnetic Resonance; GD negative = absence of Gadolinium enhancement; GD positive = presence of Gadolinium enhancement; Typical = indicates a Brain MR suggestive of Multiple Sclerosis, Atypical = indicates a Brain MR not suggestive of Multiple Sclerosis; Regular = indicates a value of Link or Barrier Index inferior the normal value (NV); EDSS = Expanded Disability Status Scale; BOC = Oligo Clonal Bands. CIDP = Chronic Inflammatory Demyelinating Polineuropathy.
www.nature.com/scientificreports/
Statistical Analysis.
Mass spectra obtained by LC-MS/MS phospholipids analysis were processed using MarkerLynx software (Waters, Milford, USA). After the exclusion of lipid signals absent in 75% of samples, that resulted the optimum compromise to eliminate most of the useless variables, data matrix was subjected to differ-ent explorative statistical approaches.The first multivariate statistical analysis was performed using Neural Designer software (version 2.9.5) by neural network implementation on data matrix. Partial least squares Discriminant Analysis (PLS-DA), was also performed on the same data matrix, by using SIMCA-P + 11.0 software (Umetrics AB, Umea, Sweden). Lastly, the univariate statistical analysis visualized as Volcano-plot using Metaboanalyst 3.0 software, was carried out. The significant lipid signals resulted by comparing the above mentioned statistical approaches, were used to perform a combined ROC curve, an internal and external diagnostic model validations and a logistic regression model, using Metaboanalyst 3.0 software. Unpaired t test with Welch’s correction or Kruskal-Wallis test with Dunn’s Multiple Comparison post-test were performed for comparisons between clinical groups, using GraphPad Prism (GraphPad software, Inc. USA). The ROC curve analysis based on single variable, and Rank correlation between variables were performed using MedCalc 7.6 (MedCalc software bvba), by using a Spearman non-parametric cor-relation test. The values of p < 0.05 were considered significant. 95% of confidence interval was assumed for each test. ChemBioDraw Ultra 13.0 software was used for the cartoon making of the proposed mechanism reported in Fig. 6.
References
1. Polman, C. H. et al. Diagnostic criteria for multiple sclerosis: 2010 revisions to the McDonald criteria. Annals of neurology 69, 292–302, https://doi.org/10.1002/ana.22366 (2011).
2. Tremlett, H., Zhao, Y., Rieckmann, P. & Hutchinson, M. New perspectives in the natural history of multiple sclerosis. Neurology 74, 2004–2015, https://doi.org/10.1212/WNL.0b013e3181e3973f (2010).
3. Comabella, M. & Montalban, X. Body fluid biomarkers in multiple sclerosis. The Lancet. Neurology 13, 113–126, https://doi. org/10.1016/S1474-4422(13)70233-3 (2014).
4. He, X., Huang, Y., Li, B., Gong, C. X. & Schuchman, E. H. Deregulation of sphingolipid metabolism in Alzheimer’s disease.
Neurobiology of aging 31, 398–408, https://doi.org/10.1016/j.neurobiolaging.2008.05.010 (2010).
5. Reale, M. & Sanchez-Ramon, S. Lipids at the Cross-road of Autoimmunity in Multiple Sclerosis. Current medicinal chemistry 24, 176–192, https://doi.org/10.2174/0929867324666161123093606 (2017).
6. Walter, S. & Fassbender, K. Spingolipids in Multiple Sclerosis. Cellular physiology and biochemistry: international journal of
experimental cellular physiology, biochemistry, and pharmacology 26, 49–56, https://doi.org/10.1159/000315105 (2010).
7. Farooqui, A. A. Lipid mediators in the neural cell nucleus: their metabolism, signaling, and association with neurological disorders.
The Neuroscientist: a review journal bringing neurobiology, neurology and psychiatry 15, 392–407, https://doi. org/10.1177/1073858409337035 (2009).
8. Dargahi, N. et al. Multiple Sclerosis: Immunopathology and Treatment Update. Brain sciences 7, https://doi.org/10.3390/ brainsci7070078 (2017).
9. Wheeler, D., Bandaru, V. V., Calabresi, P. A., Nath, A. & Haughey, N. J. A defect of sphingolipid metabolism modifies the properties of normal appearing white matter in multiple sclerosis. Brain: a journal of neurology 131, 3092–3102, https://doi.org/10.1093/brain/ awn190 (2008).
10. Moscatelli, E. A. & Isaacson, E. Gas liquid chromatographic analysis of sphingosine bases in sphingolipids of human normal and multiple sclerosis cerebral white matter. Lipids 4, 550–555 (1969).
11. Singh, I., Pahan, K., Khan, M. & Singh, A. K. Cytokine-mediated induction of ceramide production is redox-sensitive. Implications to proinflammatory cytokine-mediated apoptosis in demyelinating diseases. The Journal of biological chemistry 273, 20354–20362 (1998).
12. Vidaurre, O. G. et al. Cerebrospinal fluid ceramides from patients with multiple sclerosis impair neuronal bioenergetics. Brain: a
journal of neurology 137, 2271–2286, https://doi.org/10.1093/brain/awu139 (2014).
13. Jana, A. & Pahan, K. Oxidative stress kills human primary oligodendrocytes via neutral sphingomyelinase: implications for multiple sclerosis. Journal of neuroimmune pharmacology: the official journal of the Society on NeuroImmune Pharmacology 2, 184–193,
https://doi.org/10.1007/s11481-007-9066-2 (2007).
14. Chami, M. et al. Acid sphingomyelinase deficiency enhances myelin repair after acute and chronic demyelination. PloS one 12, e0178622, https://doi.org/10.1371/journal.pone.0178622 (2017).
15. Fonteh, A. N. et al. Sphingolipid metabolism correlates with cerebrospinal fluid Beta amyloid levels in Alzheimer’s disease. PloS one
10, e0125597, https://doi.org/10.1371/journal.pone.0125597 (2015).
16. Kornhuber, J., Rhein, C., Muller, C. P. & Muhle, C. Secretory sphingomyelinase in health and disease. Biological chemistry 396, 707–736, https://doi.org/10.1515/hsz-2015-0109 (2015).
17. Carandini, T. et al. Microvesicles: What is the Role inMultiple Sclerosis? Frontiers in neurology 6, 111, https://doi.org/10.3389/ fneur.2015.00111 (2015).
18. Pusic, A. D., Pusic, K. M. & Kraig, R. P. What are exosomes and how can they be used in multiple sclerosis therapy? Expert review of
neurotherapeutics 14, 353–355, https://doi.org/10.1586/14737175.2014.890893 (2014).
19. Verderio, C. et al. Myeloid microvesicles are a marker and therapeutic target for neuroinflammation. Annals of neurology 72, 610–624, https://doi.org/10.1002/ana.23627 (2012).
20. Del Boccio, P. et al. Lipidomic investigations for the characterization of circulating serum lipids in multiple sclerosis. Journal of
proteomics 74, 2826–2836, https://doi.org/10.1016/j.jprot.2011.06.023 (2011).
21. Pieragostino, D. et al. An integrated metabolomics approach for the research of new cerebrospinal fluid biomarkers of multiple sclerosis. Molecular bioSystems 11, 1563–1572, https://doi.org/10.1039/c4mb00700j (2015).
22. Del Boccio, P. et al. Serum lipidomic study reveals potential early biomarkers for predicting response to chemoradiation therapy in advanced rectal cancer: A pilot study. Advances in radiation oncology 2, 118–124, https://doi.org/10.1016/j.adro.2016.12.005 (2017).
Diameter(Intensity)a Diameter(Number)b
N. Populations Mean Population N. Populations Mean Population
1 84 ± 7 1 81.3 ± 9.7
Table 2. Dynamic Laser Light Scattering Determination. aData evaluated by using intensity distribution of the scattered light. bData evaluated by using number distribution of particles monitored.
proteins. Multiple sclerosis, 1352458517696597, https://doi.org/10.1177/1352458517696597 (2017).
31. Selmaj, I. et al. Global exosome transcriptome profiling reveals biomarkers for multiple sclerosis. Annals of neurology 81, 703–717,
https://doi.org/10.1002/ana.24931 (2017).
32. Holtom, E., Usherwood, J. R., Macey, M. G. & Lawson, C. Microparticle formation after co-culture of human whole blood and umbilical artery in a novel in vitro model of flow. Cytometry. Part A: the journal of the International Society for Analytical Cytology
81, 390–399, https://doi.org/10.1002/cyto.a.22010 (2012).
33. Maecker, H. T., Frey, T., Nomura, L. E. & Trotter, J. Selecting fluorochrome conjugates for maximum sensitivity. Cytometry. Part A:
the journal of the International Society for Analytical Cytology 62, 169–173, https://doi.org/10.1002/cyto.a.20092 (2004).
34. Kalina, T. et al. EuroFlow standardization of flow cytometer instrument settings and immunophenotyping protocols. Leukemia 26, 1986–2010, https://doi.org/10.1038/leu.2012.122 (2012).
35. Lachmann, R., Lanuti, P. & Miscia, S. OMIP-011: Characterization of circulating endothelial cells (CECs) in peripheral blood.
Cytometry. Part A: the journal of the International Society for Analytical Cytology 81, 549–551, https://doi.org/10.1002/cyto.a.22071
(2012).
36. Miscia, S. et al. Abeta(1-42) stimulated T cells express P-PKC-delta and P-PKC-zeta in Alzheimer disease. Neurobiology of aging 30, 394–406, https://doi.org/10.1016/j.neurobiolaging.2007.07.011 (2009).
Acknowledgements
This study was supported by: -Italian Ministry of Health, Grant number: GR-2010-2307655. -FISM, Fondazione Italiana Sclerosi Multipla, Grant cod: 2015/R/12. We are grateful to Doctor Troels Mygind for the critical reading of the manuscript.
Author Contributions
D.P. optimized lipidomics methods, performed data processing and manipulation and drafted the manuscript and references. I.C. screened and provided ASMase activity and lipidomics experiments of all patients enrolled, was involved in drafting the manuscript. P.L. supervised and optimized flow cytometry assays. Additionally, she has been involved in the data processing and manuscript preparation. E.E. performed the exosomes staining of all CSF samples and help in flow cytometry experiments. M.d.I. collected cerebrospinal fluids and clinical data of all patients enrolled in the study. M.Z., performed LC-MS/MS experiments and FLD-HPLC analyses. R.Z., performed the Dynamic Laser Light scattering measurements. P.S. discussed hypothesis and helped in design and implementation of the study for enzymatic section, he, also, contributed for funding. S.M. and M.M. shared the original conception of the study for flow cytometry section and for the final approval of the article. M.O., Head of the Neurology Clinic, was responsible for the original conception and design of the clinical part of the study and for the final approval of the article before submission to the Journal. P.D.B. is responsible for the original conception and design of the experimental part, he contributed in the supervision and funding of the work and drafting, and critically revised the article for lipidomics field before submission and is also the corresponding author for the submission.
Additional Information
Supplementary information accompanies this paper at https://doi.org/10.1038/s41598-018-21497-5. Competing Interests: The authors declare no competing interests.
Publisher's note: Springer Nature remains neutral with regard to jurisdictional claims in published maps and institutional affiliations.
Open Access This article is licensed under a Creative Commons Attribution 4.0 International License, which permits use, sharing, adaptation, distribution and reproduction in any medium or format, as long as you give appropriate credit to the original author(s) and the source, provide a link to the Cre-ative Commons license, and indicate if changes were made. The images or other third party material in this article are included in the article’s Creative Commons license, unless indicated otherwise in a credit line to the material. If material is not included in the article’s Creative Commons license and your intended use is not per-mitted by statutory regulation or exceeds the perper-mitted use, you will need to obtain permission directly from the copyright holder. To view a copy of this license, visit http://creativecommons.org/licenses/by/4.0/.