Emphysema- and airway-dominant COPD
phenotypes defined by standardised
quantitative computed tomography
Deepak R. Subramanian
1,2,23, Sumit Gupta
3,4,23, Dorothe Burggraf
5,
Suzan J. vom Silberberg
5, Irene Heimbeck
5, Marion S. Heiss-Neumann
5,
Karl Haeussinger
5, Chris Newby
6, Beverley Hargadon
7, Vimal Raj
3,4,
Dave Singh
8, Umme Kolsum
8, Thomas P. Hofer
5, Khaled Al-shair
8,
Niklas Luetzen
9, Antje Prasse
10, Joachim Müller-Quernheim
10, Giorgio Benea
11,
Stefano Leprotti
11, Piera Boschetto
11, Dorota Gorecka
12, Adam Nowinski
12,
Karina Oniszh
13, Wolfgang zu Castell
14, Michael Hagen
14, Imre Barta
15,
Balázs Döme
16, Janos Strausz
17, Timm Greulich
18,19, Claus Vogelmeier
18,19,
Andreas R. Koczulla
18,19, Ivo Gut
20, Jens Hohlfeld
19,21,22, Tobias Welte
19,22,
Mahyar Lavae-Mokhtari
22, Loems Ziegler-Heitbrock
5,
Christopher Brightling
3,4,24and David G. Parr
1,24ABSTRACT EvA (Emphysema versus Airway disease) is a multicentre project to study mechanisms and identify biomarkers of emphysema and airway disease in chronic obstructive pulmonary disease (COPD). The objective of this study was to delineate objectively imaging-based emphysema-dominant and airway disease-dominant phenotypes using quantitative computed tomography (QCT) indices, standardised with a novel phantom-based approach.
441 subjects with COPD (Global Initiative for Chronic Obstructive Lung Disease (GOLD) stages 1–3) were assessed in terms of clinical and physiological measurements, laboratory testing and standardised QCT indices of emphysema and airway wall geometry.
QCT indices were influenced by scanner non-conformity, but standardisation significantly reduced variability ( p<0.001) and led to more robust phenotypes. Four imaging-derived phenotypes were identified, reflecting “emphysema-dominant”, “airway disease-dominant”, “mixed” disease and “mild” disease. The emphysema-dominant group had significantly higher lung volumes, lower gas transfer coefficient, lower oxygen (PO2) and carbon dioxide (PCO2) tensions, higher haemoglobin and higher blood
leukocyte numbers than the airway disease-dominant group.
The utility of QCT for phenotyping in the setting of an international multicentre study is improved by standardisation. QCT indices of emphysema and airway disease can delineate within a population of patients with COPD, phenotypic groups that have typical clinical features known to be associated with emphysema-dominant and airway-dominant disease.
@ERSpublications
Standardisation of quantitative CT improves delineation of emphysema and airway phenotypes in a multicentre study http://ow.ly/10zjhV
Editorial comment in: Eur Respir J 2016; 48: 10–13.
This article has supplementary material available from erj.ersjournals.com
Received: Nov 11 2015 | Accepted after revision: March 17 2016 | First published online: May 26 2016
Support statement: The EvA study is an EU-funded project (#200506) under the Seventh Framework Programme (FP7). Funding information for this article has been deposited with FundRef.
Conflict of interest: Disclosures can be found alongside the online version of this article at erj.ersjournals.com Copyright ©ERS 2016
Affiliations: 1Dept of Respiratory Medicine, University Hospitals Coventry and Warwickshire NHS Trust, Coventry, UK.2Dept of Respiratory Medicine, Royal Derby Hospital, Derby, UK.3Dept of Infection, Immunity and Inflammation, Institute for Lung Health, University of Leicester, Leicester, UK.4Radiology Dept, Glenfield Hospital, University Hospitals of Leicester NHS Trust, Leicester, UK.5EvA Study Center, Helmholtz Zentrum Muenchen and Asklepios-Klinik, Gauting, Germany.6Institute for Lung Health, Dept of Infection, Immunity and Inflammation, University of Leicester, Leicester, UK. 7National Institute for Health Research, Leicester Respiratory Biomedical Research Unit, Leicester Institute for Lung Health, University Hospitals of Leicester, Leicester, UK. 8Centre for Respiratory Medicine and Allergy, The University of Manchester, Medicines Evaluation Unit, University Hospital of South Manchester NHS Foundation Trust, Manchester, UK.9Dept of Diagnostic Radiology, University Medical Center, Freiburg, Germany. 10Dept of Pneumology, University Medical Center, Freiburg, Germany. 11Dept of Medical Sciences, University of Ferrara and Ferrara City Hospital, Ferrara, Italy. 122nd Dept of Respiratory Medicine, National Institute of Tuberculosis and Lung Diseases, Warsaw, Poland. 13Department of Radiology and Diagnostic Imaging, National Institute of Tuberculosis and Lung Diseases, Warsaw, Poland.14Scientific Computing Research Unit, Helmholtz Zentrum München, Munich, Germany. 15Dept of Pathophysiology, National Koranyi Institute for TB and Pulmonology, Budapest, Hungary. 16Dept of Tumorbiology, National Koranyi Institute for TB and Pulmonology, Budapest, Hungary. 17Dept of Pneumology, National Koranyi Institute for TB and Pulmonology, Budapest, Hungary. 18Dept of Medicine, Pulmonary and Critical Care Medicine, University Medical Center Giessen and Marburg, Philipps-University, Marburg, Germany.19Member of the German Center for Lung Research (DZL).20Centre Nacional d’Anàlisi Genòmica, Barcelona, Spain. 21Fraunhofer Institute for Toxicology and Experimental Medicine, Hannover, Germany.22Dept of Respiratory Medicine, Hannover Medical School, Hannover, Germany. 23Both authors contributed equally.24Both authors contributed equally.
Correspondence: Loems Ziegler-Heitbrock, EvA Study Center, Helmholtz Zentrum Muenchen and Asklepios-Klinik, 82131 Gauting, Germany. E-mail: [email protected]
Introduction
Chronic obstructive pulmonary disease (COPD) is a heterogeneous condition characterised by persistent, incompletely reversible airflow obstruction as a consequence of emphysema, airway remodelling and obliteration. To better understand the pathogenetic mechanisms of COPD, the EvA (Emphysema versus Airway disease) study aims at defining emphysema- and airway disease-phenotypes of the disease [1]. COPD is typically defined, diagnosed and staged using spirometric criteria [2, 3]. Whilst spirometry is convenient for use in routine clinical practice, it does not reliably differentiate the emphysema and airway disease components of COPD [4]. Quantitative computed tomography (QCT) imaging can objectively and non-invasively evaluate emphysema and airway morphology [5], and is therefore a potentially valuable tool in phenotyping studies, but its role in multi-centre phenotyping studies has not been systematically evaluated. The quantification of emphysema via determination of the lung density in computed tomography (CT) images dates back more than two decades [6] and is now accepted for use as an outcome measure in studies of emphysema-modifying therapy in patients withα1-antitrypsin deficiency [7]. CT technologies to assess the extent of airway disease have also been developed and airway wall morphometry is used as a measure of airway remodelling in asthma [8–10]. NAKANOet al. [11] reported that airway wall thickness
correlates with airflow obstruction in patients with COPD, and that high percent wall area and low lung density can be mutually exclusive. We therefore hypothesised that QCT could accurately subdivide COPD patients into emphysema-dominant and airways disease-dominant cases [11]. However, since EvA combines data from 10 clinical centres we sought to assess the impact of scanner differences [12–15] and to establish the potential utility of dedicated phantoms for QCT standardisation. Using this strategy we investigated whether standardised CT-defined patient subgroups have distinct clinical and laboratory features. Some of the results of these studies have been previously reported in the form of abstracts [16–19].
Material and methods
The strategy and study design for the EvA study has been described previously [1]. In summary, EvA is a multicentre study across five European countries (Germany, UK, Italy, Hungary and Poland) that involves clinical examination, CT imaging and bronchoscopic sampling, in order to identify markers specific to emphysema and airway disease in COPD. The study was approved by the relevant ethics and review boards at the participating centres and all subjects provided written informed consent.
Clinical assessment
A diagnosis of COPD was based on a post-bronchodilator forced expiratory volume in 1 s (FEV1)/forced vital capacity (FVC) ratio <70%. Patients were excluded if they had very severe COPD (FEV1<30% predicted or <1 L), bronchodilator reversibility greater than 400 mL, had smoked within the previous 12 months, or had a primary diagnosis of bronchiectasis, asthma or any other significant respiratory diseases [1].
All subjects were assessed by clinical history, physical examination, pulmonary function testing, including plethysmography, 6-min walk distance (6MWD), quantification of dyspnoea using the modified Medical
Research Council (mMRC) scale [20] and CT. All subjects received their usual prescribed medication. Venous blood was taken for clinical chemistry including α1-antitrypsin and C-reactive protein. Plasma samples were frozen at −20°C and shipped on dry ice to the coordinator site (Munich, Germany) for storage at −80°C. Erythropoietin was determined in plasma samples using the e-biosciences ELISA (BMS2002CE).
CT scanning and image analysis
Detailed methods for CT acquisition and analysis are available in the online supplementary material. Patients were scanned in General Electric (Fairfield, CT, United States) or Siemens (Erlangen, Germany) CT scanners with a volumetric scan covering the whole lung for lung densitometry and a limited scan of the middle of the lung including the tracheal carina for airway morphometry of the right S1 segmental airway (table S1). Image analysis was performed using Pulmo CMS [21] and EmphylxJ [22] software packages. The 15th percentile (Perc15) point derived from the lung density histogram was used to assess emphysema severity and the % wall area (%WA) for the right S1 segmental bronchus was used to assess airway disease. The latter may be used as a surrogate parameter for small airway disease since it has been shown that the measures of airway wall dimensions in CT predicted the dimensions of smaller airways as determined in histology [23]. Still, this study does not directly measure the dimensions of small airways nor does it compare inspiratory and expiratory scans to determine gas trapping, which is considered an indirect measure of small airway disease. For standardisation of emphysema and airway CT indices, dedicated emphysema and airway phantoms were scanned in all centres and indices were derived to generate centre-specific regression equations using a method validated in a preclinical phantom studies (figures S1 and S2 and table S2 and S3).
Statistics
COPD cases were classified into four groups using the upper 95th percentile value of the Perc15 and % WA for the normal control subjects. The four groups were termed:“emphysema dominant” (Ea), “airway disease dominant” (eA), “mixed” pathology (EA) and “mild” disease (ea). Extreme E and A phenotypes were identified by giving rank order numbers to each subject based on the product of the ranks given to Perc15 and %WA in these two groups and classifying the subjects as extreme phenotypes if they were in the half with the highest rank. Statistical analysis used the non-parametric Wilcoxon–Mann–Whitney test, Kruskal–Wallis, Chi-squared and linear, partial and multiple linear regression analyses in the R-environment. Non-parametric correlations were analysed using Spearman’s test. A p-value <0.05 was considered significant after Bonferroni–Holm correction was applied.
Results
Patients
We recruited 534 patients with COPD and 280 controls at 10 clinical centres. CT scans of the chest were obtained from all cases and 56 controls. Quantitative indices could not be obtained in 93 patients (for the list of reasons see table S4). There were no differences in clinical parameters between those cases with or without an assessable CT or between scanner manufacturers except for a lower gas transfer in patients studied on General Electric scanners (table S5). The clinical characteristics of cases and controls are as shown table 1.
Standardisation of QCT indices
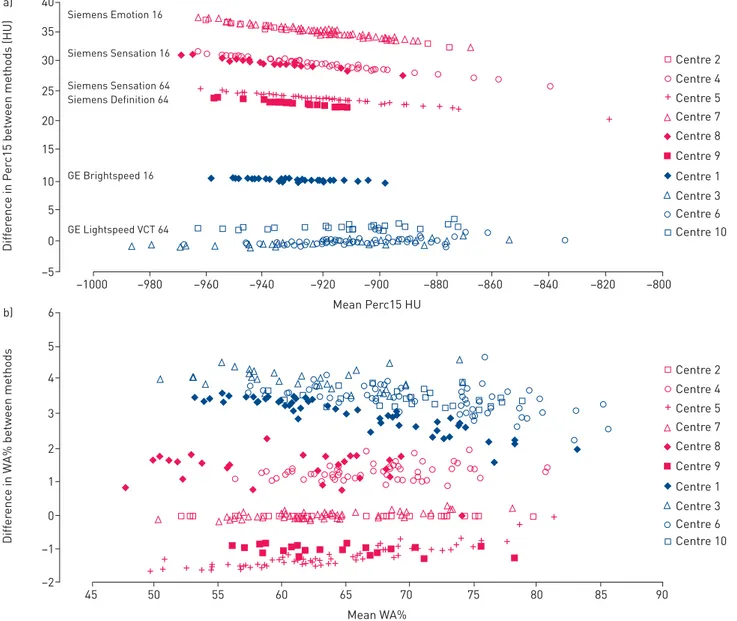
Differences in unstandardised Perc15 and %WA were associated with differences in scanner manufacturer and model (see figure 1a and b). The preclinical densitometry and airway morphometry phantom studies demonstrated that standardisation reduced variability by 84% ( p<0.001) (mean±SD difference of
26.2±13.4 HU in unstandardised densitometry data versus 4.1±2.3 HU in standardised data) (table S2 and figure S3). A mean±SDdifference of 2.9±1.9 was observed in unstandardised %WA of the phantom tubes
across all EvA centres. Standardisation reduced the mean difference to 0.6±0.5, representing an error reduction of 79% ( p=0.002) (table S3 and figure S4). The mean±SD %WA of the phantom tubes were
significantly lower on the Siemens-derived imaging compared to the General Electric-derived imaging (62.0±11.6% versus 66.4±12.0%; p=0.007).
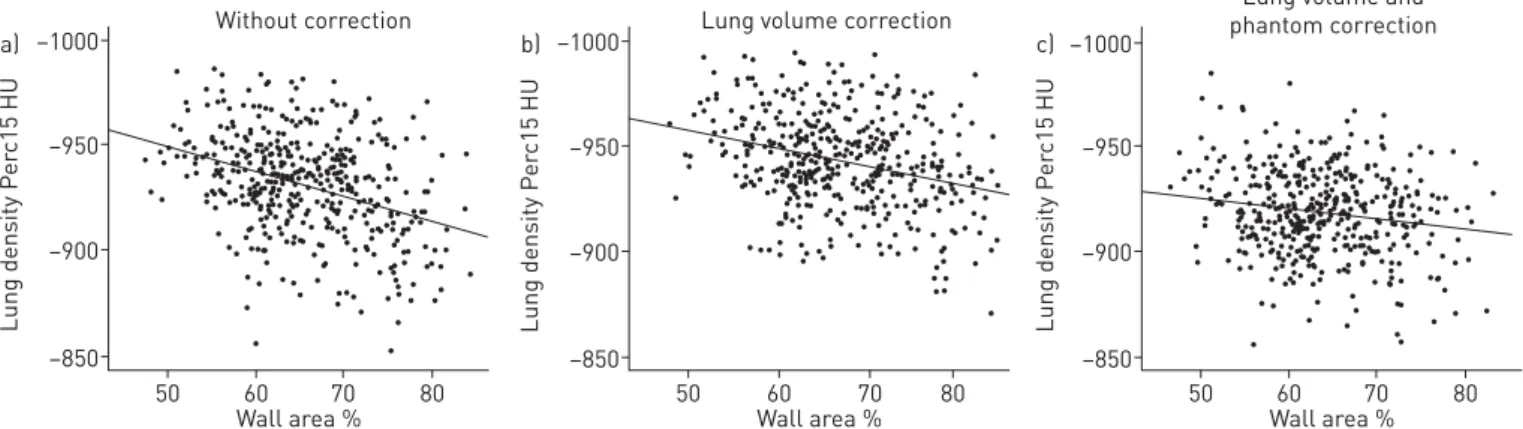
There was a correlation between unstandardised Perc15 and %WA (r=0.34, p<0.001; figure 2a), which was reduced by adjusting lung density for lung volume (r=0.27, p<0.001; figure 2b) and further reduced following phantom standardisation (r=0.11, p=0.17; figure 2c).
Comparison of CT-defined phenotypes
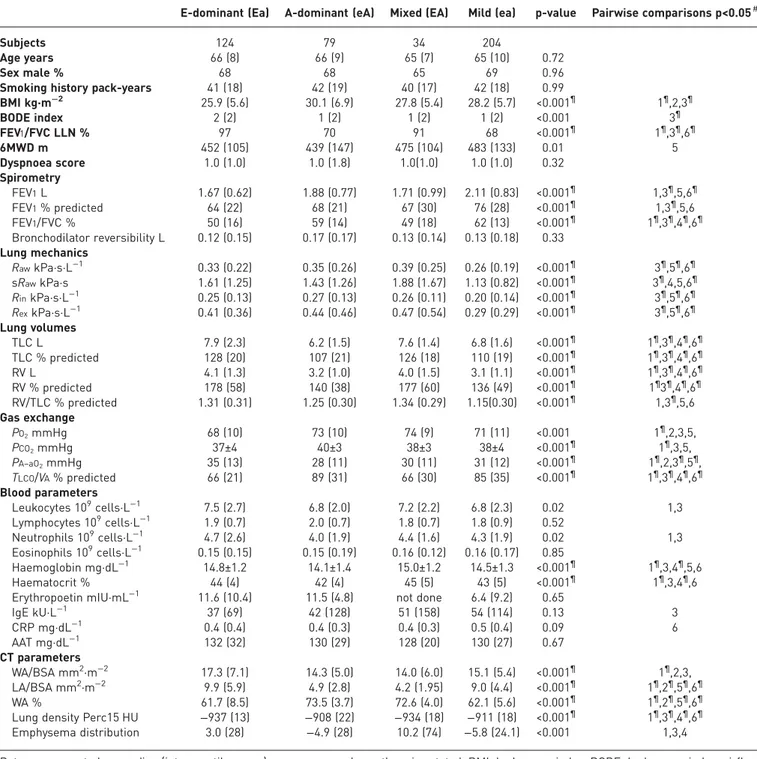
QCT data from the 56 control subjects showed that the upper 95th percentile values for Perc15 was −925.6 HU and for WA was 69.3%. The COPD cases were subsequently classified into the four pre-specified groups; “emphysema-dominant” (Ea) (n=124), “airway disease-dominant” (eA) (n=79),
“mixed” pathology (EA) (n=34) and “mild” disease (ea) (n=204) (figure 3a). There was no difference for age, sex and smoking history among the four phenotypes (table 2). When comparing the E-dominant versus A-dominant cases in that table then the E-dominant cases (Ea) had, for instance, a lower body mass
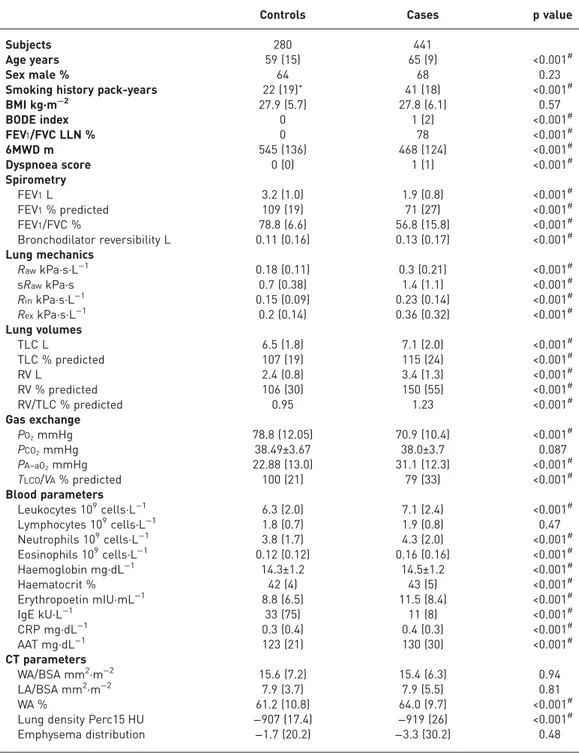
TABLE 1Clinical characterics of cases and controls
Controls Cases p value
Subjects 280 441
Age years 59 (15) 65 (9) <0.001#
Sex male % 64 68 0.23
Smoking history pack-years 22 (19)+ 41 (18) <0.001#
BMI kg·m−2 27.9 (5.7) 27.8 (6.1) 0.57 BODE index 0 1 (2) <0.001# FEV1/FVC LLN % 0 78 <0.001# 6MWD m 545 (136) 468 (124) <0.001# Dyspnoea score 0 (0) 1 (1) <0.001# Spirometry FEV1L 3.2 (1.0) 1.9 (0.8) <0.001# FEV1% predicted 109 (19) 71 (27) <0.001# FEV1/FVC % 78.8 (6.6) 56.8 (15.8) <0.001# Bronchodilator reversibility L 0.11 (0.16) 0.13 (0.17) <0.001# Lung mechanics RawkPa·s·L−1 0.18 (0.11) 0.3 (0.21) <0.001# sRawkPa·s 0.7 (0.38) 1.4 (1.1) <0.001# RinkPa·s·L−1 0.15 (0.09) 0.23 (0.14) <0.001# RexkPa·s·L−1 0.2 (0.14) 0.36 (0.32) <0.001# Lung volumes TLC L 6.5 (1.8) 7.1 (2.0) <0.001# TLC % predicted 107 (19) 115 (24) <0.001# RV L 2.4 (0.8) 3.4 (1.3) <0.001# RV % predicted 106 (30) 150 (55) <0.001# RV/TLC % predicted 0.95 1.23 <0.001# Gas exchange PO2mmHg 78.8 (12.05) 70.9 (10.4) <0.001# PCO2mmHg 38.49±3.67 38.0±3.7 0.087 PA–aO2mmHg 22.88 (13.0) 31.1 (12.3) <0.001# TLCO/VA% predicted 100 (21) 79 (33) <0.001# Blood parameters Leukocytes 109cells·L−1 6.3 (2.0) 7.1 (2.4) <0.001# Lymphocytes 109cells·L−1 1.8 (0.7) 1.9 (0.8) 0.47 Neutrophils 109cells·L−1 3.8 (1.7) 4.3 (2.0) <0.001# Eosinophils 109cells·L−1 0.12 (0.12) 0.16 (0.16) <0.001# Haemoglobin mg·dL−1 14.3±1.2 14.5±1.2 <0.001# Haematocrit % 42 (4) 43 (5) <0.001# Erythropoetin mIU·mL−1 8.8 (6.5) 11.5 (8.4) <0.001# IgE kU·L−1 33 (75) 11 (8) <0.001# CRP mg·dL−1 0.3 (0.4) 0.4 (0.3) <0.001# AAT mg·dL−1 123 (21) 130 (30) <0.001# CT parameters WA/BSA mm2·m−2 15.6 (7.2) 15.4 (6.3) 0.94 LA/BSA mm2·m−2 7.9 (3.7) 7.9 (5.5) 0.81 WA % 61.2 (10.8) 64.0 (9.7) <0.001#
Lung density Perc15 HU −907 (17.4) −919 (26) <0.001#
Emphysema distribution −1.7 (20.2) −3.3 (30.2) 0.48
Data are presented as median (interquartile range) or mean±SD, unless otherwise stated. BMI: body mass index; BODE: body-mass index, airflow obstruction, dyspnoea, exercise; FEV1: forced expiratory volume in 1 s; FVC: forced vital capacity; LLN: lower limit of normal; 6MWD: 6-min walk distance;Raw: airway resistance; sRaw: specific airway resistance;Rin: inspiratory resistance;Rex: expiratory resistance; RV: residual volume; TLC: total
lung capacity; PO2: oxygen tension; PCO2: carbon dioxide tension; PA–aO2: alveolar–arterial oxygen tension differential;TLCO: transfer capacity of the lung for carbon monoxide;VA: alveolar volume; Ig: immunoglobulin; CRP: C-reactive protein; AAT:α1-antitrypsin; CT: computed tomography; WA/BSA: airway wall area corrected for body surface area; LA/BSA: lumen area corrected for body surface area; WA: airway wall area; Perc15: 15th percentile point.#: significant after correction for multiple testing;+: 47 out of 280 were never-smokers.
index (BMI) of 25.9 kg·m−2than the A-dominant cases (eA) with a BMI of 30.1 kg·m−2. In the last column, “1” indicates that in a pairwise comparison this Ea versus eA difference is significant and¶indicates that it is also significant after correction for multiple testing. The table furthermore shows that the E-dominant cases had more obstructive spirometry, increased lung volumes, reduced gas transfer, higher haemoglobin, lower PO2and PCO2and more were prescribed long-acting muscarinic antagonists. The group with mixed
pathology had upper lobe predominant emphysema but no clear distinguishing features when compared to the“emphysema-dominant” and “airway disease-dominant” groups. Patients with mild disease had better spirometric measures than the other phenotypes. The proportion of subjects in each CT-phenotype was significantly different between centres (table S6) and scanner type (table S7) ( p<0.001).
Analysis of the extreme CT-defined phenotypes
The distribution of the Perc15 versus %WA for the COPD cases and controls are as shown in figure 3a with the extreme emphysema-dominant (Eex) and extreme airway disease-dominant (Aex) shown in figure 3b. Comparison between the extreme emphysema-dominant (Eex) (n=62) and extreme airways-disease dominant (Aex) (n=40) groups demonstrated that the pattern of several clinical and laboratory characteristics were more pronounced with a greater difference in lung function parameters, blood gases, haemoglobin and leukocytes (table S8).
30 35 40 Siemens Emotion 16 Siemens Sensation 16 Siemens Sensation 64 Siemens Definition 64 GE Brightspeed 16 GE Lightspeed VCT 64 a) 25 20 15 10 5 –5 0 Diff er enc e in P e
rc15 between methods (HU)
Mean Perc15 HU –1000 –980 –960 –940 –920 –900 –880 –860 –840 –820 –800 + + + + + + + + + + ++ + ++ +++ ++++++++ ++++++++++++++++ + + + + + Centre 2 Centre 4 Centre 5 Centre 7 Centre 8 Centre 9 Centre 1 Centre 3 Centre 6 4 5 6 b) 3 2 1 0 –2 –1 Diff er enc e in W A% between methods Mean WA% 45 50 55 60 65 70 75 80 85 90 + Centre 2 Centre 4 Centre 5 Centre 7 Centre 8 Centre 9 Centre 1 Centre 3 Centre 6 Centre 10 Centre 10 + + + + ++ + + + + + ++ + + + + + + + + + + + + +++ ++ + ++ + + + + + + + + + + + + + + + + + + ++ + + + + + + + + + +
FIGURE 1Bland-Altman plots for unstandardisedversus standardised 15th percentile point (Perc15) and wall area (WA).a)Bland-Altman plot comparing unstandardised Perc15 (corrected for blood and air with Pulmo CMS software) with Perc15 standardised against the densitometry reference scanner ( prior to volume correction).b)Bland-Altman plot comparing unstandardised WA (%) against WA (%) standardised against the airway reference scanner. n=441.
Correlation and multiple linear regression analyses
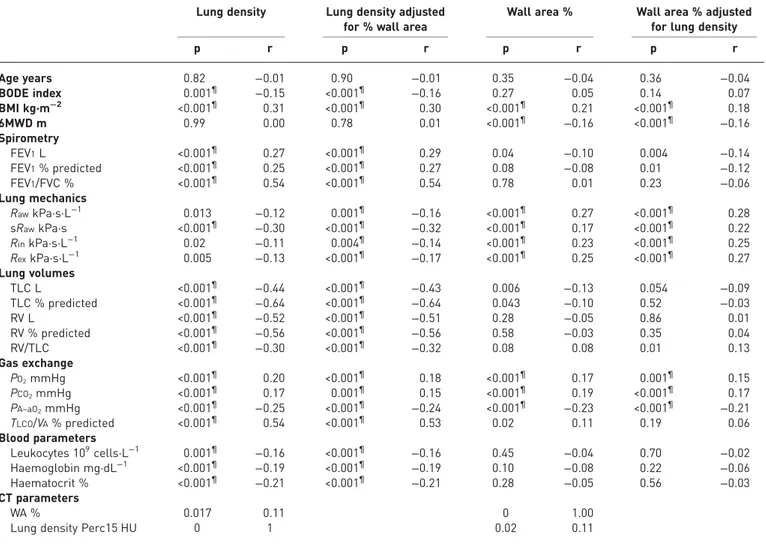
Univariate analyses were undertaken between the clinical, physiological and laboratory indices and both Perc15 and %WA (table 3). Lung density was positively correlated with FEV1% predicted, BMI, PO2, PCO2,
and gas transfer factor, and negatively with lung volumes, haemoglobin and total leukocyte counts. Partial correlation of lung density adjusting for %WA revealed that the associations with these parameters were independent of %WA (table 3). %WA was positively correlated with BMI, PO2, PCO2 and negatively
correlated with lung volumes and there was an association with small airways resistance parameters. Partial correlation of %WA adjusting for lung density demonstrated that the association of %WA with PO2and
PCO2was independent of lung density. The correlation between %WA and small airways resistance (Raw)
was more pronounced following adjustment for lung density with a p-value of 2.1×10⁻⁸ before and of 1×10⁻⁹after adjustment. Multiple linear regression analysis revealed that BMI, FEV1, total lung capacity –1000 Without correction a) –950 –900 –850 Lung density P e rc15 HU Wall area % 50 60 70 80
–1000 Lung volume correction
Lung volume and phantom correction b) –950 –900 –850 Lung density P e rc15 HU Wall area % 50 60 70 80 –1000 c) –950 –900 –850 Lung density P e rc15 HU Wall area % 50 60 70 80
FIGURE 2Impact of volume and phantom correction on patterns of wall areaversus lung density in the Emphysema versus Airway disease chronic obstructive pulmonary disease cases. a) without correction, b), with correction of lung density for volume, c) following phantom-derived standardisation methodology and volume correction. n=441. Spearman’s Rho is 0.336, 0.271 and 0.113 fora, b, and c, respectively.
–1000 E-dominant A-dominant a) –950 –900 –850 Lung density P e rc15 HU Wall area % 50 60 70 80 –1000 Eex Aex b) –950 –900 –850 Lung density P e rc15 HU Wall area % 50 60 70 80
FIGURE 3Definition of emphysema-dominant, airway disease dominant and extreme phenotypes based on computed tomography (CT).a)wall area (WA) and lung density in the Emphysemaversus Airway disease (EvA) chronic obstructive pulmonary disease (COPD) cases (n=441, filled circles) and controls (n=56, open circles) are given in this wall areaversus lung density plot. The upper limit of normal (ULN) for wall area (69.3%) and lower limit of normal (LLN) for emphysema (−925.6 HU) are given as vertical and horizontal dotted lines, respectively.b)wall area and lung density in the EvA COPD cases: extreme phenotypes. Rank orders were determined in that all WA% values in the upper left quadrant were given rank numbers, with highest wall area ranked as 1. Also all 15th percentile (Perc15) values in the upper left quadrant were given a rank number, with the highest lung density ranked as 1. The two rank numbers for each individual were multiplied and individuals were ordered according to the product size. Individuals in the upper half of this rank product list were classified as extreme emphysema dominant (Eex). For extreme airway disease dominant (Aex) in the lower right corner, the procedure was applied accordingly. Cases with this extreme CT-phenotype are indicated by coloured dots on the background of the grey dots for the remainder of patients. E-extreme in the upper left (n=62) and A-extreme in the lower right (n=40). The ULN for wall area (69.3%) and LLN for emphysema (−925.6 HU) are given as vertical and horizontal dotted lines, respectively.
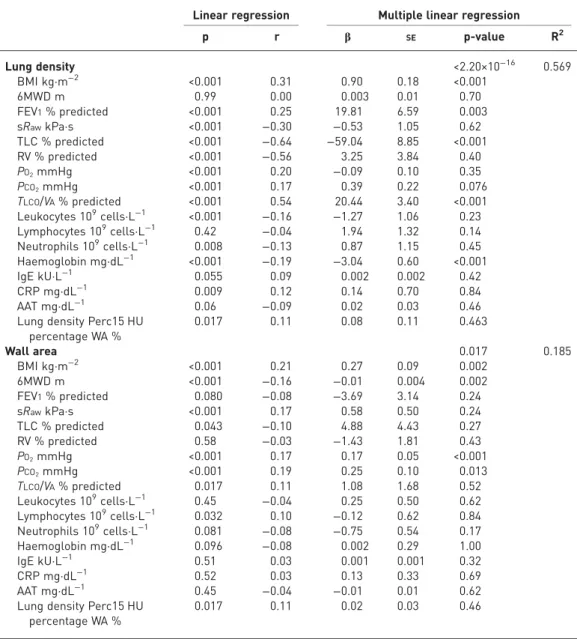
(TLC), and transfer capacity of the lung for carbon monoxide (TLCO)/alveolar volume (VA) % predicted and Hb were strongly associated with lung density, while %WA was associated with BMI, 6MWD, PO2and
PCO2(table 4).
TABLE 2Characteristics of the CT-derived phenotypes
E-dominant (Ea) A-dominant (eA) Mixed (EA) Mild (ea) p-value Pairwise comparisons p<0.05#
Subjects 124 79 34 204
Age years 66 (8) 66 (9) 65 (7) 65 (10) 0.72
Sex male % 68 68 65 69 0.96
Smoking history pack-years 41 (18) 42 (19) 40 (17) 42 (18) 0.99
BMI kg·m−2 25.9 (5.6) 30.1 (6.9) 27.8 (5.4) 28.2 (5.7) <0.001¶ 1¶,2,3¶ BODE index 2 (2) 1 (2) 1 (2) 1 (2) <0.001 3¶ FEV1/FVC LLN % 97 70 91 68 <0.001¶ 1¶,3¶,6¶ 6MWD m 452 (105) 439 (147) 475 (104) 483 (133) 0.01 5 Dyspnoea score 1.0 (1.0) 1.0 (1.8) 1.0(1.0) 1.0 (1.0) 0.32 Spirometry FEV1L 1.67 (0.62) 1.88 (0.77) 1.71 (0.99) 2.11 (0.83) <0.001¶ 1,3¶,5,6¶ FEV1% predicted 64 (22) 68 (21) 67 (30) 76 (28) <0.001¶ 1,3¶,5,6 FEV1/FVC % 50 (16) 59 (14) 49 (18) 62 (13) <0.001¶ 1¶,3¶,4¶,6¶ Bronchodilator reversibility L 0.12 (0.15) 0.17 (0.17) 0.13 (0.14) 0.13 (0.18) 0.33 Lung mechanics RawkPa·s·L−1 0.33 (0.22) 0.35 (0.26) 0.39 (0.25) 0.26 (0.19) <0.001¶ 3¶,5¶,6¶ sRawkPa·s 1.61 (1.25) 1.43 (1.26) 1.88 (1.67) 1.13 (0.82) <0.001¶ 3¶,4,5,6¶ RinkPa·s·L−1 0.25 (0.13) 0.27 (0.13) 0.26 (0.11) 0.20 (0.14) <0.001¶ 3¶,5¶,6¶ RexkPa·s·L−1 0.41 (0.36) 0.44 (0.46) 0.47 (0.54) 0.29 (0.29) <0.001¶ 3¶,5¶,6¶ Lung volumes TLC L 7.9 (2.3) 6.2 (1.5) 7.6 (1.4) 6.8 (1.6) <0.001¶ 1¶,3¶,4¶,6¶ TLC % predicted 128 (20) 107 (21) 126 (18) 110 (19) <0.001¶ 1¶,3¶,4¶,6¶ RV L 4.1 (1.3) 3.2 (1.0) 4.0 (1.5) 3.1 (1.1) <0.001¶ 1¶,3¶,4¶,6¶ RV % predicted 178 (58) 140 (38) 177 (60) 136 (49) <0.001¶ 1¶3¶,4¶,6¶ RV/TLC % predicted 1.31 (0.31) 1.25 (0.30) 1.34 (0.29) 1.15(0.30) <0.001¶ 1,3¶,5,6 Gas exchange PO2mmHg 68 (10) 73 (10) 74 (9) 71 (11) <0.001 1¶,2,3,5, PCO2mmHg 37±4 40±3 38±3 38±4 <0.001¶ 1¶,3,5, PA–aO2mmHg 35 (13) 28 (11) 30 (11) 31 (12) <0.001¶ 1¶,2,3¶,5¶, TLCO/VA% predicted 66 (21) 89 (31) 66 (30) 85 (35) <0.001¶ 1¶,3¶,4¶,6¶ Blood parameters Leukocytes 109cells·L−1 7.5 (2.7) 6.8 (2.0) 7.2 (2.2) 6.8 (2.3) 0.02 1,3 Lymphocytes 109cells·L−1 1.9 (0.7) 2.0 (0.7) 1.8 (0.7) 1.8 (0.9) 0.52 Neutrophils 109cells·L−1 4.7 (2.6) 4.0 (1.9) 4.4 (1.6) 4.3 (1.9) 0.02 1,3 Eosinophils 109cells·L−1 0.15 (0.15) 0.15 (0.19) 0.16 (0.12) 0.16 (0.17) 0.85 Haemoglobin mg·dL−1 14.8±1.2 14.1±1.4 15.0±1.2 14.5±1.3 <0.001¶ 1¶,3,4¶,5,6 Haematocrit % 44 (4) 42 (4) 45 (5) 43 (5) <0.001¶ 1¶,3,4¶,6
Erythropoetin mIU·mL−1 11.6 (10.4) 11.5 (4.8) not done 6.4 (9.2) 0.65
IgE kU·L−1 37 (69) 42 (128) 51 (158) 54 (114) 0.13 3 CRP mg·dL−1 0.4 (0.4) 0.4 (0.3) 0.4 (0.3) 0.5 (0.4) 0.09 6 AAT mg·dL−1 132 (32) 130 (29) 128 (20) 130 (27) 0.67 CT parameters WA/BSA mm2·m−2 17.3 (7.1) 14.3 (5.0) 14.0 (6.0) 15.1 (5.4) <0.001¶ 1¶,2,3, LA/BSA mm2·m−2 9.9 (5.9) 4.9 (2.8) 4.2 (1.95) 9.0 (4.4) <0.001¶ 1¶,2¶,5¶,6¶ WA % 61.7 (8.5) 73.5 (3.7) 72.6 (4.0) 62.1 (5.6) <0.001¶ 1¶,2¶,5¶,6
Lung density Perc15 HU −937 (13) −908 (22) −934 (18) −911 (18) <0.001¶ 1¶,3¶,4¶,6¶ Emphysema distribution 3.0 (28) −4.9 (28) 10.2 (74) −5.8 (24.1) <0.001 1,3,4
Data are presented as median (interquartile range) or mean±SD, unless otherwise stated. BMI: body mass index; BODE: body-mass index, airflow obstruction, dyspnoea, exercise; FEV1: forced expiratory volume in 1 s; FVC: forced vital capacity; LLN: lower limit of normal; 6MWD: 6-min walk distance;Raw: airway resistance; sRaw: specific airway resistance;Rin: inspiratory resistance;Rex: expiratory resistance; RV: residual volume; TLC: total lung capacity;PO2: oxygen tension;PCO2: carbon dioxide tension;PA–aO2: alveolar–arterial oxygen tension differential; TLCO: transfer capacity of the lung for carbon monoxide; VA: alveolar volume; Ig: immunoglobulin; CRP: C-reactive protein; AAT: α1-antitrypsin; CT: computed tomography; WA/BSA: airway wall area corrected for body surface area; LA/BSA: lumen area corrected for body surface area; WA: airway wall area; Perc15: 15th percentile point.#:1: Eaversus eA; 2: Ea versus EA; 3: Ea versus ea; 4: eA versus EA; 5: eA versus ea; 6: EA versus ea. ¶: significant after correction for multiple testing.
Discussion
The current study has demonstrated that emphysema-dominant and airways disease-dominant phenotypic groups may be delineated within a heterogeneous COPD population with mild-to-moderate airflow obstruction using standardised QCT. In addition, groups with mixed disease and mild disease were identified that had comparable smoking history to the other groups. We also showed that QCT indices obtained from different sites were significantly influenced by scanner make and model, and that the use of dedicated standardisation phantoms was of critical importance in improving comparability between centres. Standardisation of CT measures is not relevant to clinical practice at this point in time but it is important in multicentre trials for proper classification of patients with COPD. This has been noted earlier in the COPDGene study [24].
The“emphysema-dominant” and “airway disease-dominant” phenotypes delineated in our COPD population had clinical characteristics that are recognisable in the historical descriptions of the“pink puffer” and the “blue bloater” [25, 26], respectively. Furthermore, these two groups are similar to those described in previous phenotyping studies using cluster analysis [27–29]. In our study, subjects in the “emphysema-dominant” group had more obstructive spirometry, increased lung volumes, lower BMI, greater impairment of gas exchange, and higher TLC and residual volume (RV) in comparison with the “airways disease-dominant” group. The finding that these two groups were comparable with respect to age, disease severity, smoking exposure and inflammatory markers supports the contention that genetic susceptibility to the development of emphysema may be distinct from susceptibility to the development of airways disease. The clinical features of
TABLE 3Linear and partial regression
Lung density Lung density adjusted for % wall area
Wall area % Wall area % adjusted for lung density
p r p r p r p r Age years 0.82 −0.01 0.90 −0.01 0.35 −0.04 0.36 −0.04 BODE index 0.001¶ −0.15 <0.001¶ −0.16 0.27 0.05 0.14 0.07 BMI kg·m−2 <0.001¶ 0.31 <0.001¶ 0.30 <0.001¶ 0.21 <0.001¶ 0.18 6MWD m 0.99 0.00 0.78 0.01 <0.001¶ −0.16 <0.001¶ −0.16 Spirometry FEV1L <0.001¶ 0.27 <0.001¶ 0.29 0.04 −0.10 0.004 −0.14 FEV1% predicted <0.001¶ 0.25 <0.001¶ 0.27 0.08 −0.08 0.01 −0.12 FEV1/FVC % <0.001¶ 0.54 <0.001¶ 0.54 0.78 0.01 0.23 −0.06 Lung mechanics RawkPa·s·L−1 0.013 −0.12 0.001¶ −0.16 <0.001¶ 0.27 <0.001¶ 0.28 sRawkPa·s <0.001¶ −0.30 <0.001¶ −0.32 <0.001¶ 0.17 <0.001¶ 0.22 RinkPa·s·L−1 0.02 −0.11 0.004¶ −0.14 <0.001¶ 0.23 <0.001¶ 0.25 RexkPa·s·L−1 0.005 −0.13 <0.001¶ −0.17 <0.001¶ 0.25 <0.001¶ 0.27 Lung volumes TLC L <0.001¶ −0.44 <0.001¶ −0.43 0.006 −0.13 0.054 −0.09 TLC % predicted <0.001¶ −0.64 <0.001¶ −0.64 0.043 −0.10 0.52 −0.03 RV L <0.001¶ −0.52 <0.001¶ −0.51 0.28 −0.05 0.86 0.01 RV % predicted <0.001¶ −0.56 <0.001¶ −0.56 0.58 −0.03 0.35 0.04 RV/TLC <0.001¶ −0.30 <0.001¶ −0.32 0.08 0.08 0.01 0.13 Gas exchange PO2mmHg <0.001¶ 0.20 <0.001¶ 0.18 <0.001¶ 0.17 0.001¶ 0.15 PCO2mmHg <0.001¶ 0.17 0.001¶ 0.15 <0.001¶ 0.19 <0.001¶ 0.17 PA–aO2mmHg <0.001¶ −0.25 <0.001¶ −0.24 <0.001¶ −0.23 <0.001¶ −0.21 TLCO/VA% predicted <0.001¶ 0.54 <0.001¶ 0.53 0.02 0.11 0.19 0.06 Blood parameters Leukocytes 109cells·L−1 0.001¶ −0.16 <0.001¶ −0.16 0.45 −0.04 0.70 −0.02 Haemoglobin mg·dL−1 <0.001¶ −0.19 <0.001¶ −0.19 0.10 −0.08 0.22 −0.06 Haematocrit % <0.001¶ −0.21 <0.001¶ −0.21 0.28 −0.05 0.56 −0.03 CT parameters WA % 0.017 0.11 0 1.00
Lung density Perc15 HU 0 1 0.02 0.11
BODE: body-mass index, airflow obstruction, dyspnoea, exercise; BMI: body mass index; 6MWD: 6-min walk distance; FEV1: forced expiratory volume in 1 s; FVC: forced vital capacity;Raw: airway resistance; sRaw: specific airway resistance; Rin: inspiratory resistance;Rex: expiratory resistance; TLC: total lung capacity; RV: residual volume;PO2: oxygen tension;PCO2: carbon dioxide tension;PA–aO2: alveolar–arterial oxygen tension differential;TLCO: transfer capacity of the lung for carbon monoxide;VA: alveolar volume; CT: computed tomography; WA: airway wall area; Perc15: 15th percentile point.¶: significant after correction for multiple testing.
these two groups were more pronounced when the extreme subphenotypes were compared. The definition of extreme phenotypes (Eexand Aex) is based on CT measures only but we could show that these phenotypes go along with more extreme clinical laboratory values like FEV1and PO2(see table S8). This concept has been
developed for this specific study and needs to be validated in independent cohorts.
As shown in previous studies [30–32], we found a negative correlation between the indices of emphysema severity and airway wall thickening. Whilst this inverse relationship appears to suggest that these two disease characteristics are relatively independent, we demonstrated that it was at least partially accounted for by the influence of inspiratory volume during scan acquisition and scanner non-conformity. Consequently, we hypothesise that because a greater inspiratory level during imaging would cause a reduction in lung density and an increase in airway distension, this would produce apparent worsening in emphysema indices whilst simultaneously reducing apparent airway wall thickness; the reverse changes would be seen with a lower inspiratory volume during imaging. Therefore correction for lung volume is an important part of the standardisation exercise.
TABLE 4Multiple linear regression
Linear regression Multiple linear regression
p r β SE p-value R2 Lung density <2.20×10⁻¹⁶ 0.569 BMI kg·m−2 <0.001 0.31 0.90 0.18 <0.001 6MWD m 0.99 0.00 0.003 0.01 0.70 FEV1% predicted <0.001 0.25 19.81 6.59 0.003 sRawkPa·s <0.001 −0.30 −0.53 1.05 0.62 TLC % predicted <0.001 −0.64 −59.04 8.85 <0.001 RV % predicted <0.001 −0.56 3.25 3.84 0.40 PO2mmHg <0.001 0.20 −0.09 0.10 0.35 PCO2mmHg <0.001 0.17 0.39 0.22 0.076 TLCO/VA% predicted <0.001 0.54 20.44 3.40 <0.001 Leukocytes 109cells·L−1 <0.001 −0.16 −1.27 1.06 0.23 Lymphocytes 109cells·L−1 0.42 −0.04 1.94 1.32 0.14 Neutrophils 109cells·L−1 0.008 −0.13 0.87 1.15 0.45 Haemoglobin mg·dL−1 <0.001 −0.19 −3.04 0.60 <0.001 IgE kU·L−1 0.055 0.09 0.002 0.002 0.42 CRP mg·dL−1 0.009 0.12 0.14 0.70 0.84 AAT mg·dL−1 0.06 −0.09 0.02 0.03 0.46
Lung density Perc15 HU percentage WA % 0.017 0.11 0.08 0.11 0.463 Wall area 0.017 0.185 BMI kg·m−2 <0.001 0.21 0.27 0.09 0.002 6MWD m <0.001 −0.16 −0.01 0.004 0.002 FEV1% predicted 0.080 −0.08 −3.69 3.14 0.24 sRawkPa·s <0.001 0.17 0.58 0.50 0.24 TLC % predicted 0.043 −0.10 4.88 4.43 0.27 RV % predicted 0.58 −0.03 −1.43 1.81 0.43 PO2mmHg <0.001 0.17 0.17 0.05 <0.001 PCO2mmHg <0.001 0.19 0.25 0.10 0.013 TLCO/VA% predicted 0.017 0.11 1.08 1.68 0.52 Leukocytes 109cells·L−1 0.45 −0.04 0.25 0.50 0.62 Lymphocytes 109cells·L−1 0.032 0.10 −0.12 0.62 0.84 Neutrophils 109cells·L−1 0.081 −0.08 −0.75 0.54 0.17 Haemoglobin mg·dL−1 0.096 −0.08 0.002 0.29 1.00 IgE kU·L−1 0.51 0.03 0.001 0.001 0.32 CRP mg·dL−1 0.52 0.03 0.13 0.33 0.69 AAT mg·dL−1 0.45 −0.04 −0.01 0.01 0.62
Lung density Perc15 HU percentage WA %
0.017 0.11 0.02 0.03 0.46
BMI: body mass index; 6MWD: 6-min walk distance; FEV1: forced expiratory volume in 1 s; sRaw: specific airway resistance; TLC: total lung capacity; RV: residual volume;PO2: oxygen tension;PCO2: carbon dioxide tension;TLCO: transfer capacity of the lung for carbon monoxide;VA: alveolar volume; Ig: immunoglobulin; CRP: C-reactive protein; AAT:α1-antitrypsin; WA: airway wall area.
The mixed group phenotype, which was observed in only 7.7% of our COPD population, was comprised of patients with upper lobe predominant emphysema and airway wall thickening. This is similar to the recently described cluster which CASTALDI et al. [27] described as“mild upper zone-predominant emphysema and
airflow obstruction”. In their study, this cluster accounted for 15% of their population and was shown to be more likely to experience an exacerbation and more likely to have used the emergency room or been admitted to the hospital for a respiratory issue compared to patients with“relatively resistant” disease. In our study, patients in the“mixed” group did not exhibit greater functional impairment arising from a summative effect of both components when compared to those with emphysema or airways disease alone. Consequently, this combination of features may have a sparing effect on functional impairment; however, further studies are needed to clarify this finding.
The majority of patients in our study were in the group classified as having a“mild” COPD phenotype. They demonstrated relative preservation of FEV1 and gas transfer with QCT indices consistent with minimal emphysematous change and airway wall thickening, despite comparable age and smoking history to the other groups. It is uncertain whether this phenotypic group represents a truly mild form of COPD or consists of a sub-group of subjects on the cusp of abnormality, who have been “misclassified” as a consequence of the current, commonly employed definition of COPD. To address this question we re-analysed our dataset and replaced the fixed FEV1/FVC ratio of 0.7 as the cut-off value with the use of a lower limit of normal (LLN) [33]; only 68% in the “mild” group were still classified as having airflow obstruction, which suggests that almost one-third of subjects in this “mild” group may not have COPD. When comparing mild cases above and below LLN then those above LLN had TLC and TLCO/Va values similar to controls while airway resistance was significantly increased (see table S9). This issue may be resolved following the collection of longitudinal data to identify any progressive change, or by clarification of the current uncertainty relating to the definition of airflow obstruction in COPD.
The partial regression analysis provides further evidence of the association between QCT measures of lung structure and clinical parameters. In keeping with the findings of MARTINEZet al. [32] we observed a
strong correlation between standardised emphysema measurement (adjusted for %WA) and the BODE (body-mass index, airflow obstruction, dyspnoea, exercise) index. The association was mainly due to the strong correlation between emphysema measurement and FEV1and BMI; however, in this study we did not observe an association with 6MWD. Furthermore, in keeping with previous studies, there was an association between standardised airway wall measurements (adjusted for Perc15) and 6MWD [32], BMI [34, 35] but not the BODE index [32]. Both indices correlated with measures of gas exchange, however only emphysema measurement negatively correlated with haemoglobin concentration and leukocyte count. This association cannot be explained by hypoxia alone and warrants further investigation in future studies.
While in early studies, increased haemoglobin concentrations had been reported in COPD [36], more recent studies reported on lower levels along the lines of anaemia of chronic disease [37]. Our data now show that increases of haemoglobin can be detected in COPD, when the appropriate sub-phenotypes are being analysed. Of note, the finding of increased blood haemoglobin and increased blood leukocytes in the emphysema-dominant patients but not in airway disease dominant patients points towards fundamental differences in the pathophysiology of these two sub-phenotypes, which is already apparent in early stage patients studied herein.
The clearly defined clinical features of the emphysema and airways disease groups that were delineated in the current study confirm the clinical relevance and, thereby, imply the validity of the phenotyping methodology that was utilised. We demonstrated, using lung phantoms, that there is significant non-conformity between scanners of different make and model, even when comparable image acquisition protocols are used. Using our standardisation methodology we identified the cut-off between“normal” and emphysema as −925.6 HU and for airways disease as 69.3% WA. Further studies are required to establish normal values using a larger population of controls, with comparable age and smoking history. Furthermore, the approach used for standardisation is currently too cumbersome for use in routine clinical practice and will require refinement and further development before it can be applied to routine clinical practice.
There are a number of limitations to this cross-sectional study. Firstly, we did not recruit patients with very severe airflow obstruction, because tolerance of bronchoscopy was essential for participation in the EvA study [1]. Therefore the majority of cases in this study represent GOLD stages 1 and 2. Hence, the findings reported herein do not apply the full spectrum of COPD cases but are predominantly relevant to the mild to moderate COPD group. It is of interest that even in these cases with only mild to moderate disease, the emphysema-dominant and airway disease-dominant cases can be clearly identified.
Secondly, it is likely that the phenotypic groups that were defined in the current study could be further divided if we had included additional clinical parameters (e.g. emphysema subtypes) and utilised cluster
analysis. However, our approach was determined a priori and this degree of detailed phenotyping was not required for the primary purpose of the EvA study, which is to identify candidate susceptibility genes in emphysema- and airways-dominant phenotypes. Nevertheless, application of the methodology described here to a larger dataset may enable further phenotypic delineation.
Thirdly, data from 93 patients were excluded primarily due to lack of appropriate imaging data; notwithstanding this limiting factor, sub-analysis on this group did not find any significant clinical differences with the patients included in this study.
Fourthly, our study only included CT imaging obtained on General Electric and Siemens scanners, and it remains unclear whether QCT standardisation methods described in our study are applicable to imaging on CT scanners produced by other manufacturers.
Lastly, the COPD phenotypes presented in this study were determined based on whole lung densitometry and airway morphometry of a single proximal airway. Various studies have demonstrated that, despite heterogeneity, the right upper lobe segmental airway is a good surrogate of proximal airway remodelling in the remainder of the lung [9, 38]. However, it is uncertain whether similar changes will be seen in the small airways [10]. Small airway assessment using inspiratory and expiratory scans to determine gas-trapping, which is considered an indirect measure of small airway disease, may help in future studies to validate the COPD phenotypes as described herein.
In conclusion, the current study demonstrates the utility of QCT in phenotyping of COPD, specifically for the delineation of emphysema and airway disease sub-groups. Standardisation of QCT was shown to be of critical importance when imaging is acquired from scanners of different make and model, as frequently occurs in multicentre studies. It is anticipated that the methodology employed in the current study will facilitate future studies in these two distinct COPD phenotypes. Furthermore, it is desirable that these phenotypic groups, and the methodology, are further validated through the collection of longitudinal data and the demonstration of an association with biomarkers and genotype; this may be provided in due course by the results of the EvA project. Also, it will be important to determine in future studies as to whether the different phenotypes will show a different outcome with respect to exacerbations, antibiotic use, lung function decline and mortality.
Acknowledgements
We are indebted to the European Respiratory Society for their support in launching the project. We would like to thank Dr. Greg Gibbons, Adam Land and Professor Ken Young from the Warwick Manufacturing Groups for constructing the Warwick Densitometry Phantom.
Author contributions: conception, hypotheses delineation and design of the study: L. Ziegler-Heitbrock, C. Brightling, I. Gut, K. Haeussinger, D. Singh, D.G. Parr; acquisition of the data or the analysis and interpretation of such information: D.R. Subramanian, S. Gupta, D. Burggraf, S.J. vom Silberberg, I. Heimbeck, M.S. Heiss-Neumann, K. Haeussinger, C. Newby, B. Hargadon, V. Raj, D. Singh, U. Kolsum, T.P. Hofer, K. Al-shair, N. Luetzen, A. Prasse, J. Müller-Quernheim, G. Benea, S. Leprotti, P. Boschetto, D. Gorecka, A. Nowinski, K. Oniszh, W. zu Castell, M. Hagen, I. Barta, B. Döme, J. Strausz, T. Greulich, C. Vogelmeier, A.R. Koczulla, I. Gut, J. Hohlfeld, T. Welte, M. Lavae-Mokhtari, L. Ziegler-Heitbrock, C. Brightling, D.G. Parr; Writing the article or substantial involvement in its revision prior to submission: L. Ziegler-Heitbrock, D. Singh, S. Gupta, D. Burggraf, C. Brightling, D.G. Parr.
References
1 Ziegler-Heitbrock L, Frankenberger M, Heimbeck I, et al. The EvA study: aims and strategy. Eur Respir J 2012; 40: 823–829.
2 Rabe KF, Hurd S, Anzueto A, et al. Global strategy for the diagnosis, management, and prevention of chronic obstructive pulmonary disease: GOLD executive summary. Am J Respir Crit Care Med 2007; 176: 532–555.
3 Celli BR, MacNee W. Standards for the diagnosis and treatment of patients with COPD: a summary of the ats/ers position paper. Eur Respir J 2004; 23: 932–946.
4 Agusti A, Calverley PM, Celli B, et al. Characterisation of COPD heterogeneity in the eclipse cohort. Respir Res 2010; 11: 122.
5 Coxson HO, Rogers RM. Quantitative computed tomography of chronic obstructive pulmonary disease. Acad Radiol 2005; 12: 1457–1463.
6 Hayhurst MD, MacNee W, Flenley DC, et al. Diagnosis of pulmonary emphysema by computerised tomography. Lancet 1984; 2: 320–322.
7 Committee BPA. Clinical and surrogate endpoints for evaluating efficacy of alpha1-proteinase inhibitor (human) augmentation therapy. 95th Meeting, July 20–21, 2009. www.fda.gov/downloads/AdvisoryCommittees/ CommitteesMeetingMaterials/BloodVaccinesandOtherBiologics/BloodProductsAdvisoryCommittee/UCM171091.pdf
8 Niimi A, Matsumoto H, Amitani R, et al. Airway wall thickness in asthma assessed by computed tomography. Relation to clinical indices. Am J Respir Crit Care Med 2000; 162: 1518–1523.
9 Gupta S, Siddiqui S, Haldar P, et al. Quantitative analysis of high-resolution computed tomography scans in severe asthma subphenotypes. Thorax 2010; 65: 775–781.
10 Gupta S, Hartley R, Khan UT, et al. Quantitative computed tomography-derived clusters: redefining airway remodeling in asthmatic patients. J Allergy Clin Immunol 2013; 133: 729–738.
11 Nakano Y, Muller NL, King GG, et al. Quantitative assessment of airway remodeling using high-resolution CT. Chest 2002; 122: 271S–275S.
12 Parr DG, Stoel BC, Stolk J, et al. Influence of calibration on densitometric studies of emphysema progression using computed tomography. Am J Respir Crit Care Med 2004; 170: 883–890.
13 Kemerink GJ, Lamers RJ, Thelissen GR, et al. Scanner conformity in CT densitometry of the lungs. Radiology 1995; 197: 749–752.
14 Stoel BC, Bakker ME, Stolk J, et al. Comparison of the sensitivities of 5 different computed tomography scanners for the assessment of the progression of pulmonary emphysema: a phantom study. Invest Radiol 2004; 39: 1–7.
15 Bakker ME, Stolk J, Putter H, et al. Variability in densitometric assessment of pulmonary emphysema with computed tomography. Invest Radiol 2005; 40: 777–783.
16 Subramanian D, Gupta S, Ziegler-Heitbrock L, et al. The influence of scanner manufacturer on lung densitometry in a multicentre study. Am J Respir Crit Care Med 2011; 183: A5204.
17 Subramanian D, Gupta S, Ziegler-Heitbrock L, et al. for the EvA consortium. Assessing the relationship between standardized CT lung densitometry and airways disease. Am J Respir Crit Care Med 2011; 183: A5222.
18 Burggraf D, Heiss-Neumann M, Wjst M, et al. Reference values for respiratory system resistance in adults. Eur Respir J 2012; 40: Suppl 56, P3221.
19 Heiss-Neumann M, Burggraf M, Wjst M, et al. Airway resistance in COPD. Eur Respir J 2012; 40: Suppl 56, P876.
20 Mahler DA, Wells CK. Evaluation of clinical methods for rating dyspnea. Chest 1988; 93: 580–586.
21 Stoel BC, Stolk J. Optimization and standardization of lung densitometry in the assessment of pulmonary emphysema. Invest Radiol 2004; 39: 681–688.
22 Yuan R, Mayo JR, Hogg JC, et al. The effects of radiation dose and CT manufacturer on measurements of lung densitometry. Chest 2007; 132: 617–623.
23 Nakano Y, Wong JC, de Jong PA, et al. The prediction of small airway dimensions using computed tomography. Am J Respir Crit Care Med 2005; 171: 142–146.
24 Zach JA, Newell JD Jr, Schroeder J, et al. Quantitative computed tomography of the lungs and airways in healthy nonsmoking adults. Invest Radiol 2012; 47: 596–602.
25 Dornhorst AC. Respiratory insufficiency. Lancet 1955; 268: 1185–1187.
26 Burrows B, Fletcher CM, Heard BE, et al. The emphysematous and bronchial types of chronic airways obstruction. A clinicopathological study of patients in london and chicago. Lancet 1966; 1: 830–835.
27 Castaldi PJ, Dy J, Ross J, et al. Cluster analysis in the copdgene study identifies subtypes of smokers with distinct patterns of airway disease and emphysema. Thorax 2014; 69: 415–422.
28 Pistolesi M, Camiciottoli G, Paoletti M, et al. Identification of a predominant copd phenotype in clinical practice. Respir Med 2008; 102: 367–376.
29 Cho MH, Washko GR, Hoffmann TJ, et al. Cluster analysis in severe emphysema subjects using phenotype and genotype data: An exploratory investigation. Respir Res 2010; 11: 30.
30 Kim WJ, Silverman EK, Hoffman E, et al. CT metrics of airway disease and emphysema in severe COPD. Chest 2009; 136: 396–404.
31 Patel BD, Coxson HO, Pillai SG, et al. Airway wall thickening and emphysema show independent familial aggregation in chronic obstructive pulmonary disease. Am J Respir Crit Care Med 2008; 178: 500–505.
32 Martinez CH, Chen YH, Westgate PM, et al. Relationship between quantitative CT metrics and health status and bode in chronic obstructive pulmonary disease. Thorax 2012; 67: 399–406.
33 Swanney MP, Ruppel G, Enright PL, et al. Using the lower limit of normal for the FEV1/FVC ratio reduces the misclassification of airway obstruction. Thorax 2008; 63: 1046–1051.
34 Lee YK, Oh YM, Lee JH, et al. Quantitative assessment of emphysema, air trapping, and airway thickening on computed tomography. Lung 2008; 186: 157–165.
35 Camp PG, Coxson HO, Levy RD, et al. Sex differences in emphysema and airway disease in smokers. Chest 2009; 136: 1480–1488.
36 Simpson T. Anoxia in emphysema; its relief by oxygen. Lancet 1957; 273: 105–113.
37 Similowski T, Agusti A, MacNee W, et al. The potential impact of anaemia of chronic disease in COPD. Eur Respir J 2006; 27: 390–396.
38 Aysola RS, Hoffman EA, Gierada D, et al. Airway remodeling measured by multidetector CT is increased in severe asthma and correlates with pathology. Chest 2008; 134: 1183–1191.