www.nature.com/scientificreports
optical and mechanical properties
of streptavidin‑conjugated gold
nanospheres through data mining
techniques
Simone peli
1,2, Andrea Ronchi
1,2,3, Giada Bianchetti
1,2,7,8, Francesco Rossella
4,
Claudio Giannetti
1,2, Marcella Chiari
5, Pasqualantonio Pingue
4, Francesco Banfi
1,6&
Gabriele Ferrini
1,2*The thermo-mechanical properties of streptavidin-conjugated gold nanospheres, adhered to a surface via complex molecular chains, are investigated by two-color infrared asynchronous optical sampling pump-probe spectroscopy. Nanospheres with different surface densities have been deposited and exposed to a plasma treatment to modify their polymer binding chains. The aim is to monitor their optical response in complex chemical environments that may be experienced in, e.g., photothermal therapy or drug delivery applications. By applying unsupervised learning techniques to the spectroscopic traces, we identify their thermo-mechanical response variation. This variation discriminates nanospheres in different chemical environments or different surface densities. Such discrimination is not evident based on a standard analysis of the spectroscopic traces. This kind of analysis is important, given the widespread application of conjugated gold nanospheres in medicine and biology.
Ultrafast optical spectroscopy experiments made substantial contributions to the understanding of the electronic and thermo-mechanical dynamics of solids with nano-metric dimensions1,2. Perhaps the most studied examples
are metallic nanostructures in the form of thin films, spheres, pillars, cylinders, pyramids, with dimensions of the order of 10 nm, that have generated a conspicuous amount of literature3–6. As a non-exhaustive list of
investiga-tions on the impulsive thermo-mechanics of paradigmatic systems made of metallic nanostructures in a dielectric environment we mention thin films7,8, nanoparticles layers9–11, spheres1, disks12–14 and periodic gratings15. The
electrons excitation by light pulses and the subsequent energy flow to the lattice with the associated mechanical excitations have been thoroughly investigated, generating several theoretical models (essentially based on the classical two-temperatures model or implementing the Boltzmann equation)16–18. Recently the investigations
aimed at understanding the thermo-mechanical dynamics of nanostructures inside a host matrix, to take into account the influence of the matrix material and the interfaces12,19–22. The time-resolved experiments are
usu-ally conducted on well-characterized and possibly single nanostructures, to avoid the averaging process due to the statistical dispersion of dimensions, shapes, and interface properties that occurs working with aggregated nanostructures2,23–26. These kinds of experiments can be rationalized with a bottom-up approach, modeling the
opto-thermal response starting from a detailed knowledge of the investigated sample.
Here we explore a different scenario, where the system is complex and ill characterized compared to the experiments cited in the preceding paragraphs. Time-resolved measurements performed on these systems are not amenable to bottom-up modeling. We, therefore, implement data mining techniques to classify time-resolved
open
1Interdisciplinary Laboratories for Advanced Materials Physics (I-LAMP), Università Cattolica del Sacro Cuore, 25121 Brescia, Italy. 2Dipartimento di Matematica e Fisica, Università Cattolica del Sacro Cuore, 25121 Brescia, Italy. 3Department of Physics and Astronomy, KU Leuven, Celestijnenlaan 200D, 3001 Leuven, Belgium. 4NEST, Scuola Normale Superiore and CNR – Istituto Nanoscienze, piazza San Silvestro 12, 56127 Pisa, Italy. 5Istituto di Chimica del Riconoscimento Molecolare, CNR, Milano, Italy. 6FemtoNanoOptics Group, Université de Lyon, CNRS, Université Claude Bernard Lyon 1, Institut Lumière Matière, F-69622 Villeurbanne, France. 7Fondazione Policlinico Universitario A. Gemelli IRCSS, Rome, Italy. 8Dipartimento di Neuroscienze, Università Cattolica del Sacro Cuore, Rome, Italy. *email: [email protected]
www.nature.com/scientificreports/
traces and gain physical insight27. This approach does not rely on previous knowledge of the investigated system
and we, therefore, address it as a top-down approach. For these reasons, as a paradigmatic model system, we investigate functionalized gold nanospheres adhered to an optically transparent surface via complex molecular chains.
We select gold nanoparticles because of their chemical inertness and their low toxicity when used in biological systems. Other metallic nanoparticles do not share the same properties. From an optical point of view, it is known that Cu nanoparticles are prone to surface oxidation that affects their optical properties28. Ag nanoparticles are
known to be unstable under a process known as oxidative dissolution, consisting of a release of Ag+ ions through an oxidative mechanism. Moreover, Ag nanoparticles are subject to photo-oxidation processes that change their optical properties29. Both Ag and Cu nanoparticles are mainly used for their antibacterial properties30,31.
For the gold nanospheres system, one of the major issues was the reproducibility of the experimental data. The statistical dispersion of measured parameter was indeed high, due to the low transmission modulation induced by the optical pump on the system, the different chemical environments to which each group of the gold nanospheres under scrutiny was subject, the impossibility of precisely define the measurement conditions. Such problems arise while dealing with samples escaping a thorough characterization or while performing in vivo measurements of biological interest32, due to the impossibility to gather a deep knowledge of the samples
of interest. Since a measurement scenario as the one described above has a great interest in applications and/or technological developments, the fundamental question relates to the possibility of extracting some meaningful information from statistical methods requiring the smallest number of measurements.
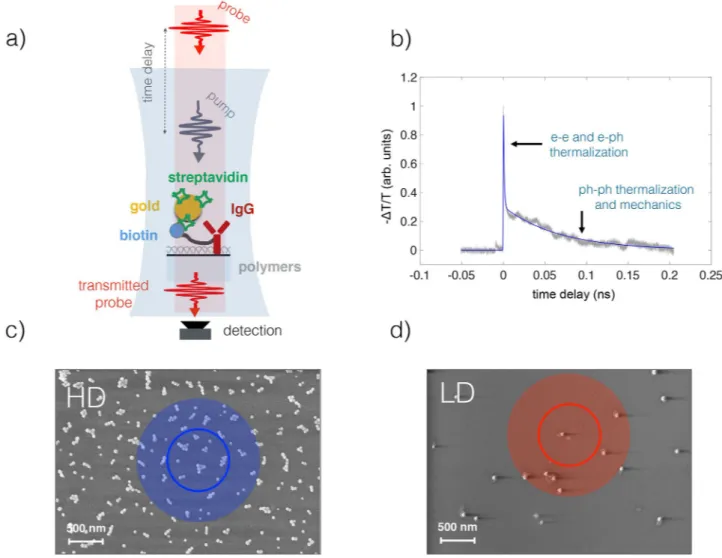
In the present study, the time-resolved experiments (see Fig. 1a,b) are carried out using ASynchronous OPtical Sampling (ASOPS). This choice is tailored to scenarios requiring fast acquisition time, eventually in conjunction with a microscopy set-up. Indeed, ASOPS has proven very successful in mechanical nanometrology33–35, and
super-resolution imaging of nano-objects36. The pump-probe delay is controlled electronically, avoiding moving
parts and providing an ideal setting for single nano-objects investigations on extended time-delays. Besides pro-viding superior beam pointing stability (actually that of the laser cavity), the acquisition speed allowed for high rate sampling yielding unprecedented sensitivity in recent experiments, where relative transmissivity variations as low as 10−7 where achieved9. Furthermore, the rapid acquisition of the time-resolved spectra over delay windows
of tens of ns with sub-ps time resolution is well suited for investigating degradable and biological samples, such as imaging of cells structures on a single cell via photoacoustics microscopy37,38. The ASOSP technique allows
avoiding sample exposure to high-intensity radiation, such as in-vivo photoacoustic imaging39, and collecting a
statistically significant number of spectra where needed27. These latter aspects make the ASOPS technique
par-ticularly well suited in conjunction with top-down analysis approaches based on data mining techniques, where information has to be retrieved from extended data sets acquired on possibly degradable samples.
Our experiments are taken on three groups of gold nanospheres, differing for surface density and surface treatment. The goal is to identify specific features of each group, digging data from the measurement made on each group, without other external information besides the measurements themselves. The data analysis used in this work has three main goals: to eliminate outliers, reduce data dimensionality, identify the characteristic response of each group.
Methods
Functionalized gold nanoparticles, with a nominal diameter of 40 nm, are bonded on an optically transparent sapphire substrate according to the following procedure. The sapphire substrate is coated with a polymeric solu-tion of poly (DMA-co-NAS-co-MAPS)40. Then a biotinylated antibody, diluted at different concentrations in a
phosphate-buffered saline solution, is spotted on the polymer covered substrate using an automated dispens-ing system. The spotted substrates are finally incubated with a solution of gold nanospheres conjugated with streptavidin at different concentrations. The high-density samples are obtained using a 1 mg/ml concentration of antibody incubated with and undiluted nanosphere solution. The low sample is obtained with a 0.1 mg/ml concentration of antibody and a nanoparticle solution diluted 1:10. The high-density samples have been succes-sively subject to a plasma treatment to partially remove the polymer coating and expose the bare nanospheres (see the Supplementary Information (SI), section 1, for more details). Scanning electron microscopy and atomic force microscopy have been used to characterize the nanospheres’ surface density and state of aggregation after the measurements. The undiluted sample has aggregated clusters of 1-5 nanospheres, with an average surface density of 10 clusters µm−2 , see Fig. 1c. The diluted sample is composed mainly of single nanospheres with an
average surface density of 1 µm−2 , see Fig. 1d. See SI, sections 2 and 3 for more details.
There are thus two distinct density groups that we will refer to as the high density (HD) and low density (LD) groups. Among the HD groups, there are two subgroups: HDnp, which did not undergo the plasma treatment, and HDp, representing the plasma-treated nanospheres.
The optical experiments are carried out using the pump and probe technique, see Fig. 1a. The pump pulses are generated by an Er:doped fiber laser at a wavelength of pu= 1560 nm. A separate fiber laser generates
the probe pulses at a wavelength of pr= 780 nm. Both laser have an average repetition rate of 100 MHz and
their cavities are locked to emit two beams that have a small, stable, and tunable repetition rate difference. The laser beams are colinearly directed in a 50× microscope objective (numerical aperture: 0.55), producing on the sample a 1 µm spot diameter at pu= 1560 nm and 0.6 µm at pr= 780 nm. The pump beam has a power of 2
mW (fluence 640 µJ/cm2 on the sample), the probe beam of 0.25 mW (fluence 220 µJ/cm2 on the sample). The
transmitted probe pulses are sampled after interacting with the sample, which is optically pumped with the beam coming from the pump laser. The transmission variation is defined as �T/T = (Iprobe
pump,τ− Inopumpprobe )/Inopumpprobe ,
where Iprobe
www.nature.com/scientificreports/
intensity at delay τ after the pump pulse. With this convention, negative transmission variation indicates that pump excitation lowers probe transmission, see Fig. 1b. This ASynchronous Optical Sampling (ASOPS) allows high-speed scanning over a delay window of 10 ns with 100 fs resolution, without a mechanical delay line41. This
technique routinely measures relative reflectivity or transmission variation as small as 10−6 . The absolute
vari-ation in transmission caused by the pump beam is of the order of �T/T = −5/ − 2 × 10⁻⁵ . The transmission
variation is negative for all measurements.
In the experiments on the LD sample, we expect to have, on average, one-two nanospheres in the probe spot. The HD sample shows, on average, around ten clusters inside the probe spot, composed of few (2-5) particles each. In both cases, the nominal diameter of the nanospheres is about 20 times smaller than the probe wave-length, and their positions on the sample surface are not known a priori.
The samples were raster-scanned with the collinear beams until a signal was detected in the probe beam as a relative transmission variation ( �T/T ) induced by the pump. When a signal was detected, its amplitude was optimized with small adjustments around that specific position and a measurement acquired without moving the sample. Since the polymer layer was optically transparent, the presence of the signal was attributed to the presence of the gold nanospheres, modulating the probe transmission via the pump excitation, as is well docu-mented in the literature1,17. The measurements were acquired in 12 sessions within two months. The quality of
the signal varied from session to session, and scan to scan. However, the data were not discarded based on the experimenter judgment (as usual in these kinds of measurements) but accumulated, to be assessed after all the experimental sessions were completed. A set of 36 time-resolved pump-probe measurements has been performed, 13 measurements on HDnp, 17 on LD, and 6 on HDp.
Figure 1. (a) A scheme of the pump-probe technique and the composition of the sample. A streptavidin-coated
gold nanosphere is attached to a biotinylated antibody which is polymer-tethered to a sapphire surface. (b) A representative time-resolved experimental trace, with the indication of the physical processes contributing at different delays, see text for discussion. (c) A scanning electron micrography of a high density sample, with an average surface density of 10 clusters, µm−2 . Each cluster is on average composed of 3 ± 2 nanospheres. The
shaded blue disk represents the pump spot, the continuous blue circumference represents the probe spot. (d) A scanning electron micrography of a low-density sample, with a surface density of 1–2 nanospheres µm−2 . The
www.nature.com/scientificreports/
Before the analysis, the transient transmission data have been normalized at the maximum amplitude. The delay axis has been centered, so that delay zero corresponds to the arrival of the pump pulse on the sample. The normalization aims at disentangling the successive analysis from the magnitude of the pump-induced transient transmission variations, which depends on experimental parameters that may vary from one experimental ses-sion to the other as, e.g., centering of nanostructures on the pump beam focus, pump-probe beam alignment, pump intensity fluctuations, etc.
Each measurement has a temporal evolution starting with a (negative) peak at zero delay due to electron absorption followed by a multiple exponential decays. The temporal evolution is fitted with a double decaying exponential function, convoluted with a gaussian function to take into account the finite temporal resolution of the laser pulse. The fit function is F1= exp(t2/τG2) ∗ (AFe(t/τF)+ ASe(t/τS)) , where τF and τS are the fast and
slow exponential decay times, respectively, AF and AS are amplitudes associated to the fast and slow decaying
exponentials, τG is the time-width at 1/e of the pulse Gaussian envelope, ∗ is the convolution operator. In Fig. 2,
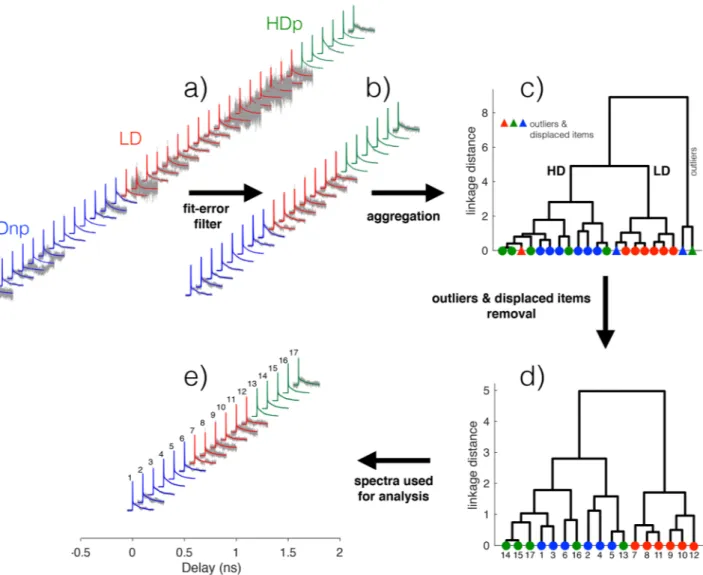
the time-resolved traces with the superposed bi-exponential fits and the filtering method (that will be discussed in the next section) are shown. The fit parameters and the associated errors retrieved from the fit process are reported in Fig. 3. Note that the data have different degrees of noise, depending on the group to which they belong. Diluted measurements are more difficult to perform because of lower signal levels and lower signal-to-noise ratio. This is reflected in the fit function errors, shown in Fig. 3, where the LD group is characterized by wider error bars. Figure 4 shows the analysis of the transient transmission data using the singular value decom-position (SVD), a general data mining technique used for data dimensionality reduction, data visualization, and information analysis42,43.
Figure 2. The set of measurements (gray lines, displaced for clarity) and the superposed fit functions (colored
continuous lines) are shown in (a). The color code is as follows: blue, high density without plasma treatment (HDnp); red, low density (LD); green, high density with plasma treatment (HDp). In (b) are shown the filtered spectra using the fitting error as a parameter (see text for details). The results of the hierarchical clustering algorithm based on Ward’s method are shown as a dendrogram in (c). The leaves (that constitute the lower terminal part of the dendrogram) represent the spectra as seen in (b), ordered hierarchically. The same color code as in (a) is used. The dendrogram, pruned away from outliers and displaced items, is shown in (d). The remaining spectra, used for subsequent analysis, are shown in (e).
www.nature.com/scientificreports/
The analysis of the residuals of the double-exponential fits shows the presence of a periodic mod-ulation, that has been fitted with a sum of damped cosines at two frequencies. The fit function is F2= a1cos(2πf1t + φ1)exp(−b1t) + a2cos(2πf2t + φ2)exp(−b2t) , where a1 and a2 are amplitudes, f1 and f2
frequencies, φ1 and φ2 phases, b1 and b2 damping rates. τ1= 1/b1 and τ2= 1/b2 are damping times associated to
the damping rates. In Fig. 5 the residual traces with the superposed damped cosines fit, the fit parameters and the associated errors are shown. Figure 6 shows the analysis of the residuals by SVD, as done for the transient transmission data.
In the next sections, these measurements and their analysis will be discussed.
Results and discussion
Although the detailed description of light absorption and successive electronic and lattice dynamics is not the focus of the present work, we give a brief description of the main points of the thermal and mechanical dynamics.
The plasmon resonance for gold nanospheres of 40 nm diameter is approximately located at = 530 nm ( hν = 2.34 eV), the inter-band transition starts approximately at hν = 2 eV ( = 620 nm). So the infrared pump used in these experiments ( pu= 1560 nm) is non-resonant and generates a hot electrons distribution in the
nanoparticle via intra-band transitions44. The hot electrons thermalize in few hundreds of fs and release energy
to the lattice in 1–2 ps3. The higher nanoparticle temperature, besides changing the optical constants of gold, will
determine a temperature gradient directed from the nanoparticle towards the surrounding molecules (polymers chains, biotin, etc.). As a result, an energy transfer takes place along the temperature gradient and the tempera-ture of the molecules will raise, changing the local refraction index12,21. Also, the raising lattice temperature
will cause an impulsive expansion of the nano-sphere diameter1,45,46. Since spherical particles are endowed with
normal oscillation modes (oscillation eigenmodes), the mechanical expansion consists of the linear combination of few lower normal modes, called breathing modes1. It is found experimentally that modulation of the probe
transmission is present at the frequency of the breathing mode for 40 nm diameter gold spheres. The standard mechanism to rationalize probe modulation in time-resolved experiments, described in the literature, is based on the periodic shift of plasmon resonance, which depends on the nanoparticle volume1. In our case, the pump
is very far from resonance, so it is not obvious if the plasmon modulation provides the dominant contribution to the observed probe modulation. Other candidates could be the pump-induced modulation of the dielectric constant of gold or the nanospheres’ mechanical modulation of their molecular corona. More details on the absorption section, the electron and lattice temperatures, and the pump-induced variation of the cross-section in SI, cross-sections 4, 5, 6.
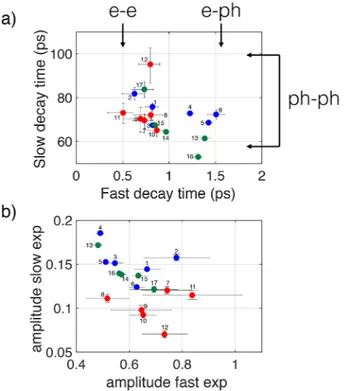
Figure 3. Fitting parameters for the double exponential fit to the data of the selected spectra shown in Fig. 2e. In (a) the fast exponential decay times versus the slow exponential decay times are reported. Note that the fast decay times are longer than the electron–electron scattering times (e–e) and slower than the maximum electron–phonon scattering time (e–ph) reported in the literature3,53,54. The slow decay time values fall between
the limits reported in the literature for phonon–phonon scattering times (ph–ph). In (b) the amplitudes of the fast decaying exponentials versus the amplitudes of the slow decaying exponentials are shown.
www.nature.com/scientificreports/
In any case, we are seeking dissimilarities between nanospheres probed in different conditions irrespective of the precise physical mechanism of excitation. The analysis is divided into two parts. First, the probe transmission variation induced by the pump is studied, without taking into account eventual rapid modulations of the signal, by fitting the initial peaked response with decaying exponentials. Then the residuals are fitted with damped oscillating cosines to extract the periodic signal modulation.
Thermal analysis.
Each measurement has been fitted by two-component decaying exponential functions to capture the fast electronic response and the slower thermal dynamics, a well-documented procedure in the literature19,27,47. The quality of fit is generally good, see Fig. 2a, however several measurements have a high level ofnoise and/or varying shape that we ascribe to non-optimal measurement conditions. To obtain a set of data with an overall good quality, we filter data based on the error of the fitting parameters, keeping the measurements whose decay times are subject to an error that is less than 25% of the decay times values. We note that the high errors on fit parameters we found in some traces are not due to a failure of the fitting model, but to increased noise, as confirmed by the residual analysis. After this selection, 21 measurements (8 HDnp, 7 LD, 6 HDp ) are considered for further analysis, out of the initial 36, Fig. 2b. We will refer to these measurements as filtered
meas-Figure 4. Results from Singular Value decomposition analysis on the data fit functions. In (a) are shown the
convex hulls of each data group. The convex hulls are shown as the smallest (semitransparent) convex polyhedra that contain all the points of each group. The coordinates (M1, M2, M3) represent the projections of each spectrum onto the three eigenvectors with the highest eigenvalues. The color code is the same as in Fig. 2. In (b) the shapes of the first three eigenvectors ( U1,U2,U3 ) are shown. The shape of the pump-probe cross correlation
is shown as a dashed black line. In (c) is shown the reconstructed barycentric trace for the low-density case (red cross in a)), obtained by the sum of the first three weighted eigenvectors. The three weighted eigenvectors are shown for comparison with the reconstructed barycentric trace. (d) and (e), same as c) for the cases of high density without plasma treatment and high density with plasma treatment, respectively.
www.nature.com/scientificreports/
urements. To assess the general consistency of the data and isolate eventual outliers, data were aggregated using a hierarchical cluster analysis, known as Ward’s minimum variance method48,49. It does not require to pre-specify
the number of clusters to be generated. The method agglomerates data adding items one at a time, associating each item to a group with the criterion to minimize the total within-cluster variance. In our case, a Euclidean metric is used to calculate the distance between experimental traces. See SI, section 7, for a detailed description of the method.
Outliers are commonly seen as “cases that do not follow the same model as the rest of the data”50. In this broad
definition are included items known to belong to a class and classified in another. We will refer to these items as displaced items51,52. Our strategy is to use hierarchical cluster analysis as a guide to obtaining distinct groups,
guided by the known characteristics of the samples, i.e., density variation and eventually plasma treatment. We follow these steps: (a) aggregate data and remove outliers, if any; (b) aggregate data without the outliers and remove the displaced items to obtain distinct groups, if possible; (c) use the remaining items for further analysis. Step (b) is crucial, and it is possible only if the data are of sufficiently high quality to have a low number of outli-ers and if data show a neat clustering tendency, with a small number of displaced items. In this way, we purify the spectral characteristics belonging to a specific group by eliminating displaced items from that group, that we attribute to a statistical and unpredictable variation in the measured data, as explained above.
The result of the hierarchical cluster algorithm is a dendrogram that visually represents the distances between items and identifies clusters of items. The analysis of the 21 spectra remaining after the filtering gives a dendro-gram whose root node divides the measurements into two groups, one where the majority of the measurements are found in the fundamental cluster and another with only two elements, so distant from all the others to be classified as outliers and excluded from subsequent analysis. The fundamental cluster divides the measurement into two sub-clusters (or leaves), one with a prevalence of HD measurements and the other with a prevalence of LD measurements, Fig. 2c. The shape of the two leaves shows that the one containing mainly LD traces (red) has a reduced distance between items compared to the other leaf, containing mainly HD traces, with a more
Figure 5. The set of residuals (gray lines, displaced for clarity) and the superposed fit functions (colored
continuous lines), are shown in (a). In (b, c) are reported the oscillation frequencies versus associated exponential damping times for the first ( f1 vs τ1 ) and second ( f2 vs τ2 ) oscillator. (d, e) reports the amplitude
www.nature.com/scientificreports/
fragmented aspect. This suggests that traces in the LD group have less inter-group distance and consequently are more “similar” among themselves than those in the HD group. It is important to note that the notion of similarity here depends on the metric used to calculate the traces distances.
The displaced items in the two groups are eliminated (one item in the HD group, one item in the LD group). We will refer to this analysis as outliers removal. After outliers removal, 17 spectra remains (6 HDnp, 6 LD, 5 HDp), their dendrogram is shown in Fig. 2d. The silhouette criterion confirms that the optimal number of clusters for this distribution is 249. The remaining spectra with their fitting functions are shown in Fig. 2e. For reference,
the selected spectra have been numbered.
Is the clustering shown in Fig. 2d) evident from the distribution of the fit parameters? In Fig. 3a) we show the fast decay time plotted against the slow decay time. The three groups do not show any significant formation of
Figure 6. Results from singular value decomposition analysis of the fit functions of the residuals. In (a) are
shown the convex hulls of each data group. The color code is the same as in Fig. 2. In (b) the shapes of the first three eigenvectors ( U1,U2,U3 ) are shown. In (c) is shown the reconstructed barycentric trace for the
low-density case (red cross in (a)), obtained by the sum of the first three weighted eigenvectors. The three weighted eigenvectors are shown for comparison with the reconstructed barycentric trace. (d) and (e), same as (c) for the cases of high density without plasma treatment and high density with plasma treatment, respectively.
www.nature.com/scientificreports/
separate clusters, the point of all group being intermixed. Same conclusions if we plot the amplitude coefficients of the fast decay exponentials versus the amplitude coefficients of the slow decay exponentials, Fig. 3b. We reach the same conclusions by plotting the fitting parameters in other combinations. We note that the fast and slow decay times have values within bounds found in the literature: electron thermalization and electron-phonon decay time are expected to range from 500 fs to 1.5 ps3,53,54, while the slower phonon-phonon coupling
of the particle to its surrounding medium implies a decay time of the order of 80-100 ps in gold nanoparticles3,53.
Now we analyze the selected data using the singular value decomposition (SVD)42,43. SVD can be applied to
any m × n matrix X and provides a factorization into the product of three matrices, X = USVT , susceptible of
an interesting interpretation. U is an m × m (real or complex) unitary matrix, V is an n × n (real or complex) unitary matrix, S is a m × n non-negative, real, diagonal, rectangular matrix. The columns of U and V form a set of orthonormal vectors, called left-singular eigenvectors and right-singular eigenvectors respectively, the associated eigenvalues in S are ordered in descending magnitude along the diagonal.
The SVD decomposition has an important approximation property. To approximate a matrix X with another matrix ˆX of lower rank r, the solution is given by the SVD of X as ˆX = U ˆSVT , where ˆS is the diagonal matrix
S containing only the r highest magnitude eigenvalues and replacing the others by zero42,43. This allows us to
approximate all the column vectors in the matrix X using a truncated version of U, i.e. using a maximum of r eigenvectors. The n × n matrix M = SVT contains the coefficients to reconstruct the original data using the
left-singular vectors as a base. Using only the first three eigenvectors for the reconstruction, it is possible to obtain an approximate reconstruction and reduce considerably the dimension of the data space. It is possible to demon-strate that, for a given dimension, this approximate reconstruction is the best obtainable in the least square sense. It is important to underline the problem of normalization of data. It is well known that hierarchical analysis and SVD depend critically on data normalization. However, there is no consensus on which kind of normalization is considered best practice. In our case, we have normalized the experimental traces to unity at the highest value of the transient transmission and have used the best fits to the normalized traces as the input to the statistical analysis, without further pre-processing. As a consequence, the processed data are not centered, as is usually done in this kind of analysis. The idea behind analyzing the fitting functions, not directly the data, is that the shape of the fitting functions is sufficiently rich in information to disentangle the characteristics features of each group while avoiding the masking effect of noise.
We project each of the 17 fit functions on the three eigenvectors, to retrieve the projection coefficients that characterize uniquely each single measurement in this reduced data space. The projection coefficients Mi
1,M2i,M3i
are the weights relative to the ith experimental trace, that is approximated by a weighted sum of the three
eigen-vectors ( U1,U2,U3 ) as Ei= M1i× U1+ M2i× U2+ M3i× U3 . The projection coefficients M1i,M2i,M3i can be
represented in a three-dimensional projection space. Instead of representing one point for each measurement in the projection space, we visualize the points distribution via the convex hulls for each data group. The convex hull is the smallest convex polyhedron that contains all the points of each group. In Fig. 4a the convex hulls of each data group are shown as colored semitransparent polyhedra. The barycenter of each group is shown with a cross. The barycenter position is also projected on the 2D representations on the limiting planes of the 3D graph. The polyhedron containing the LD group (red), is distinct from the other two, containing the HD samples. The SVD analysis separates the data based on a different nano-spheres surface density. The polyhedra containing the HDnp (blue) and HDp (green) are partially superposed and have well-separated barycenters. This shows that the plasma treatment affected the optical properties of the HD nano-spheres to a minor degree compared to density variation.
The normalized shape of the three eigenvectors is shown in Fig. 4b. The eigenvectors’ shape can be correlated to the evolution of the electronic and thermal degrees of freedom of the gold nanospheres. The first eigenvector represents the measurement backbone, i.e., the dynamic that is most representative of all the experimental data. It appears as a peak due to electron-phonon relaxation within the nanoparticle, with a time width of approximately 1.5 ps, followed by an exponential decay lasting several tens of ps, due to the phonon-phonon thermal dynamics. The second eigenvalue has a peak whose temporal width is comparable to that of the first eigenvector followed, by a zero-crossing and a long exponential tail. The third eigenvalue is characterized by a peak with a time width much shorter than the typical electron-lattice relaxation time that is identical to the time resolution of the experiment, given approximately by the Gaussian FWHM width of 600 fs, representing the pump-probe cross-correlation. As we will see, the second and third eigenvalues have a much smaller contribution to reconstructing data and can be interpreted as showing the differences between experiments. Differences between measurements due to fast, out-of-equilibrium electronic processes are captured by the third eigenvector.
The barycentric trace, reconstructed using the barycentric coordinates of a specific group (see Fig. 4c–e), represents the characteristic shape of that group and may contain physical information not accessible using an analysis based on the fitting of the data with a model function. To synthesize the barycentric traces we consider the first three eigenvectors ( U1,U2,U3 ), shown in Fig. 4b as normalized curves. The crosses in Fig. 4a
mark the barycentric coordinated of the convex hulls of each data group. The location of each cross is given by three coordinates Mb
1,M2b,M3b , where b is a label to identify the three groups LD, HDnp, HDp. Each
M-coor-dinate represent the weight (projection) of each eigenvector in reconstructing the barycentric traces, as follows Tb= M1b× U1+ M2b× U2+ M3b× U3 where Tb is the barycentric trace of the b-th group. The barycentric
trace Tb and the three weighted curves that synthesize each Tb (i.e. Mb
1× U1,M2b× U2,M3b× U3 ) are shown in
Fig. 4c–e. It is interesting to study the sign of the projection coefficients needed to reconstruct the average spec-trum. By denoting the projection coefficient signs relating to the three eigenvectors with the notation (sign(U1), sign(U2), sign(U3)), we have the following results: LD (−, −, −) , Fig. 4c; HDnp (−, +, +) , Fig. 4d; HDp (−, −, +) ,
www.nature.com/scientificreports/
Fig. 4e. Each group is identified by a different sign combination. The magnitude of the first eigenvector U1 is by
far the largest, has the same (negative) sign for all cases. U1 determines the average shape of the trace for the three
groups (in the figure is reported the negative of the transient transmission). The second and third projections ( U2 and U3 ), considered as corrections to the main eigenvector, show a characteristic pattern for each group.
In the cases of LD and HDnp groups, U2 and U3 have the same sign and peak near zero-delay, tending to sum
up and modifying the shape of the main peak of the first eigenvector by increasing (LD) or decreasing (HDnp) the transmission compared to U1 . Instead, in the HDp group, the peaks of U2 and U3 tend to cancel out and, as
a result, only minor modifications are brought to the shape of U1 . The transient transmission peak decay in the
LD group is faster compared to the average trace (first eigenvector, U1 ), while the transient transmission in the
HDnp group is longer. The increase in transmission in the LD group modifies the transient transmission trace, with an ultrafast component that steepens the leading edge that is absent in the HDnp group. Our data analy-sis highlights the influence of adsorbates on the gold nanospheres electron-phonon dynamics, that is already described in the literature in some specific cases55.
Mechanical analysis.
In Fig. 5a are shown the residuals of the double exponential fits (gray lines) and the superposed double damped-cosines fits (continuous colored lines). In Fig. 5b–e are shown the fit parameters with the error bars. Not all the fits to the residuals of the spectra analyzed in the thermal analysis section give reasonable errors on fit parameters. Selecting measurements for thermal analysis do not guarantee the quality of the measurements on mechanical oscillations. In Fig. 5b–e we zoom in a range of values of the fitting param-eters where points are found to group together. As a result only a subset of the fitting paramparam-eters referring to the initially selected spectra in Fig. 2 are shown. Note that the number identifying a single measurement may not be present in all the graphs. The graphs showing the complete set of fitting parameters are reported in the SI, section 8. The subsequent SVD analysis is made using all the fits, independently on their quality. This choice is determined by the fact that the fitting parameters of a single trace may have very different error levels. Since excluding a fit because of a larger error in one fitting parameter (but not in the others) involve a degree of arbi-trariness, we prefer to keep in the subsequent analysis all the traces. It will be evident that the SVD analysis will give reasonable results, being very robust with respect to data quality.There are two oscillation intervals where most of the analyzed nanoparticles reside, the higher in frequency around 60–75 GHz, f1 axis in Fig. 5b, the lower around 5–15 GHz, f2 axis in Fig. 5c. The higher frequencies
interval corresponds to the breathing modes of spherical gold particles spanning a diameter of 35-45 nm. This is in agreement with the nominal particle diameter of 40 nm, taking into account the possible dispersion of the nano-spheres diameter. The damping times associated with the higher frequencies are of the order of few oscil-lation periods: an average damping time of 50 ps for an average period of 14.3 ps, i.e. roughly 3.5 osciloscil-lation periods resulting in an oscillator quality factor Q = 4.5 (see Fig. 5b).
The lower frequencies have the same order of magnitude associated with the oscillation found in densely polymer-tethered colloidal particles and attributed to polymer chains oscillations56. In this case, the damping
times are not well defined, being spread around zero (in the interval (− 500, + 500) ps) with some particles having negative damping values, Fig. 5c. This is due to two main reasons: the first is the extremely low signal amplitude (relative transmission variation in the range of 10−7 ), the second is that the periods of oscillation (in the range
100–200 ps) are of the same order of the damping times, with an oscillator quality factor Q ∼ 1.
The amplitudes associated with high frequency oscillations (Fig. 5d), a1 axis) are well defined and of the order
of a1∼ 0.01 − 0.1 . Taking into account that the peak relative transmission variation in the exponentials in Fig. 2e
is �T/T = 2 − 5 × 10⁻⁵ , the present peak relative transmission variation is of the order �T/T = 2 − 10 × 10−7 .
The associated phases concentrate in an interval around 90 deg (associated with a sine type oscillation), with a big dispersion that witnesses the varied conditions of the nanoparticles.
The oscillations amplitudes associated with the low-frequency oscillations a2 (Fig. 5e) are even smaller than
a1 and many amplitudes are nearly zero. The phases associated with a2 are evenly distributed at all angles.
The SVD analysis of the fits to the mechanical oscillations are shown in Fig. 6. Figure 6a shows the convex hulls associated with the three groups in the projection space. As already noted, all the points associated with the spectra of a group are contained in the corresponding convex hull, represented as a colored semitransparent polyhedron. The polyhedron containing the LD spectra (red) is the most spread out, containing the polyhedra associated with HDnp (blue) and HDp (green). The spread-out of the acoustic response of the LD spectra is accompanied by their higher error bars in the decaying exponential fits in Fig. 3. The HDnp group has the small-est volume, suggsmall-esting that the spectra in this group are similar and have low dispersion. This means that the low-density spectra have varied acoustic responses, to be contrasted with the HDnp group, that have characteristic, less varied acoustic oscillations. The plasma action on the high-density group (HDp, green) causes an expansion of the volume in the projection space, making the acoustic response more varied, more similar to the LD case. The above consideration could be confirmed by looking at the shape of the first three eigenvectors. In Fig. 6b the normalized eigenvectors corresponding to the three larger eigenvalues are shown. U1 is a superposition of a
damped high-frequency oscillation and a low-frequency oscillation, appearing as a modulation. U2 and U3 have
the same general behavior as U1 , save the different damping and phase. U2 is approximately in anti-phase with
U1 , U3 is approximately in quadrature with U1.
The barycentric spectrum of the LD group is shown in Fig. 6c. As in the previous case (Fig. 4c), the trace is obtained by summing the first three eigenvectors with the weights related to the barycenter of the polyhedron containing the LD group, see the red cross in Fig. 6a. In the figure, the contributing weighted eigenvectors are shown. The first eigenvector essentially coincides with the barycentric trace, the contribution of U2 , and U3 being
www.nature.com/scientificreports/
characterized by a marked influence of U2 and U3 eigenvectors, that differentiate its trace from those of the other
groups, see Fig. 6e. To rationalize these findings, we note that it has been demonstrated that densely polymer-tethered colloidal particles, studied by Brillouin light scattering, have a modified acoustic response compared to uniform particle-in-polymer systems56. Following this suggestion, we note that when the cross-linking polymers
in the high-density nanospheres are cut by the plasma action, these become acoustically similar to the low-density nanospheres, where inter-particle polymer cross-linking is absent. Our analysis shows that the acoustic response depends not on particle surface density, but on the presence or absence of polymer cross-linking between gold nanospheres, a fact that opens a new dimension in the control of nanoparticle acoustics response in complex environments.
conclusions
We have developed and detailed a protocol to analyze time-resolved spectra. Using a hierarchical clustering algorithm, it is possible to identify data outliers in a simple and meaningful way. Outlier removal allows us to purify spectra from the influence of errors that do not stem from the limitations of instruments but have a sin-gular origin and are non-reproducible. As non-exhaustive examples, consider mislabeling of data by researchers, unintended measurements on different features of a sample (e.g. contaminants), unintended alteration of the instruments’ parameters. The analysis of the selected experimental traces with the SVD, in addition to confirm-ing the subdivision into groups found by the hierarchical clusterconfirm-ing, allows to reduce data dimensionality and focus on a small number of eigenvectors to reconstruct data.
The proposed analysis allows us to extract useful information from data that have been collected under chal-lenging experimental conditions. The gold nanoparticles investigated in this work have been measured with an off-resonance mid-infrared pump instead of a pump near the plasmon absorption peak, as usual in the literature. As a consequence, the energy delivery to the nanoparticle is smaller by orders of magnitude compared to an in-resonance pump (see the SI, section 4 for an estimate of the absorption cross-section).
Although the wavelength choice for the pump beam ( pu= 1560 nm) is not optimized for measurement
sensitivity, the use of short-wavelength infrared beams is interesting to explore a spectral region that is not usually probed in time-resolved experiments. An infrared pump is an attractive choice to investigate biological materials because is known as non-carcinogenic. As an example of a potential implementation, consider both the optical absorption coefficient and the scattering coefficient of the human subcutaneous adipose tissue, that are reduced in the near-infrared/short-wavelength infrared region ( 0.7µm < < 1.6µm)57, implying an increase
in light penetration depth and reduced scattering. It has been found that a mild hyperthermia treatment (with a temperature increase of less than 5◦C ) causes pro-apoptotic responses in particle-labeled cancer cells, so that
even a wavelength not optimized for absorption may be useful in cancer thermal treatment58,59.
The near-infrared probe beam at 780 nm is in a spectral window where both water and hemoglobin have low absorption, being thus highly penetrating in living tissues (e.g. brain tissue)60. Both wavelength have a reduced
scattering in tissues compared to visible wavelengths, thus enhancing the contrast in sensing applications. In all these cases, the application of time-resolved measurement techniques should benefit from the data analysis presented in this work.
Finally, we would like to highlight that the procedures outlined in this work can be applied in different experimental conditions and are thus general. Consider an experiment whose output depends on a set of control parameters (e.g., density, temperature, pH, concentration, etc.) that are under the experimenters’ control. Repeat-ing the experiment varyRepeat-ing the parameters in discrete steps produces different groups labeled by different control parameters. In this case, the analysis presented here should help to extract differences among these groups by looking at the eigenvectors and to highlight if dominant features common to all groups are present. The detailed interpretation of the data is specific to the experimental situation. It needs some clues coming from what is known from the physics, chemistry, biology of the problem at hand and possibly an interpretative model to be tested.
Received: 17 January 2020; Accepted: 31 August 2020
References
1. Hartland, G. V. Optical studies of dynamics in noble metal nanostructures. Chem. Rev. 111, 3858–3887 (2011).
2. Beane, G., Devkota, T., Brown, B. S. & Hartland, G. V. Ultrafast measurements of the dynamics of single nanostructures: a review. Rep. Prog. Phys. 82, 016401 (2019).
3. Link, S. & El-Sayed, M. A. Optical properties and ultrafast dynamics of metallic nanocrystals. Annu. Rev. Phys. Chem. 54, 331–366 (2003).
4. Burda, C., Chen, X., Narayanan, R. & El-Sayed, M. A. Chemistry and properties of nanocrystals of different shapes. Chem. Rev.
105, 1025–1102 (2005).
5. Huang, X. & El-Sayed, M. A. Gold nanoparticles: optical properties and implementations in cancer diagnosis and photothermal therapy. J. Adv. Res. 1, 13–28 (2010).
6. Pileni, M. 2d superlattices and 3d supracrystals of metal nanocrystals: a new scientific adventure. J. Mater. Chem. 21, 16748–16758 (2011).
7. Hettich, M. et al. Modification of vibrational damping times in thin gold films by self-assembled molecular layers. Appl. Phys. Lett.
98, 261908 (2011).
8. Grossmann, M. et al. Characterization of thin-film adhesion and phonon lifetimes in al/si membranes by picosecond ultrasonics. New J. Phys. 19, 053019 (2017).
9. Peli, S. et al. Mechanical properties of Ag nanoparticle thin films synthesized by supersonic cluster beam deposition. J. Phys. Chem. C 120, 4673–4681 (2016).
10. Benetti, G. et al. Bottom-up mechanical nanometrology of granular Ag nanoparticles thin films. J. Phys. Chem. C 121, 22434–22441 (2017).
www.nature.com/scientificreports/
11. Benetti, G. et al. Photoacoustic sensing of trapped fluids in nanoporous thin films: device engineering and sensing scheme. ACS Appl. Mater. Interfaces 10, 27947–27954 (2018).
12. Gandolfi, M. et al. Ultrafast thermo-optical dynamics of plasmonic nanoparticles. J. Phys. Chem. C 122, 8655–8666 (2018). 13. Kelf, T. et al. Ultrafast vibrations of gold nanorings. Nano Lett. 11, 3893–3898 (2011).
14. Medeghini, F. et al. Signatures of small morphological anisotropies in the plasmonic and vibrational responses of individual nano-objects. J. Phys. Chem. Lett. 10, 5372 (2019).
15. Travagliati, M. et al. Interface nano-confined acoustic waves in polymeric surface phononic crystals. Appl. Phys. Lett. 106, 021906 (2015).
16. Voisin, C., Del Fatti, N., Christofilos, D. & Vallée, F. Time-resolved investigation of the vibrational dynamics of metal nanoparticles. Appl. Surf. Sci. 164, 131–139 (2000).
17. Hartland, G. V. Coherent vibrational motion in metal particles: determination of the vibrational amplitude and excitation mecha-nism. J. Chem. Phys. 116, 8048–8055 (2002).
18. Nardi, D. et al. Probing thermomechanics at the nanoscale: impulsively excited pseudosurface acoustic waves in hypersonic pho-nonic crystals. Nano Lett. 11, 4126–4133 (2011).
19. Banfi, F. et al. Ab initio thermodynamics calculation of all-optical time-resolved calorimetry of nanosize systems: evidence of nanosecond decoupling of electron and phonon temperatures. Phys. Rev. B 81, 155426 (2010).
20. Banfi, F. et al. Temperature dependence of the thermal boundary resistivity of glass-embedded metal nanoparticles. Appl. Phys. Lett. 100, 011902 (2012).
21. Stoll, T. et al. Time-resolved investigations of the cooling dynamics of metal nanoparticles: impact of environment. J. Phys. Chem. C 119, 12757–12764 (2015).
22. Caddeo, C. et al. Thermal boundary resistance from transient nanocalorimetry: a multiscale modeling approach. Phys. Rev. B 95, 085306 (2017).
23. Smith, B. A., Zhang, J. Z., Giebel, U. & Schmid, G. Direct probe of size-dependent electronic relaxation in single-sized au and nearly monodisperse pt colloidal nano-particles. Chem. Phys. Lett. 270, 139–144 (1997).
24. Muskens, O. L., Del Fatti, N. & Vallée, F. Femtosecond response of a single metal nanoparticle. Nano Lett. 6, 552–556 (2006). 25. Zavelani-Rossi, M. et al. Transient optical response of a single gold nanoantenna: the role of plasmon detuning. ACS Photon. 2,
521–529 (2015).
26. Joplin, A., Chang, W.-S. & Link, S. Imaging and spectroscopy of single metal nanostructure absorption. Langmuir 34, 3775–3786.
https ://doi.org/10.1021/acs.langm uir.7b031 54 (2018).
27. Peli, S. et al. Discrimination of molecular thin films by surface-sensitive time-resolved optical spectroscopy. Appl. Phys. Lett. 107, 163107. https ://doi.org/10.1063/1.49342 16 (2015).
28. Chan, G. H., Zhao, J., Hicks, E. M., Schatz, G. C. & Van Duyne, R. P. Plasmonic properties of copper nanoparticles fabricated by nanosphere lithography. Nano Lett. 7, 1947–1952 (2007).
29. Grillet, N. et al. Photo-oxidation of individual silver nanoparticles: a real-time tracking of optical and morphological changes. J. Phys. Chem. C 117, 2274–2282 (2013).
30. Ingle, A. P., Duran, N. & Rai, M. Bioactivity, mechanism of action, and cytotoxicity of copper-based nanoparticles: A review. Appl. Microbiol. Biotechnol. 98, 1001–1009. https ://doi.org/10.1007/s0025 3-013-5422-8 (2014).
31. Marambio-Jones, C. & Hoek, E. M. V. A review of the antibacterial effects of silver nanomaterials and potential implications for human health and the environment. J. Nanopart. Res. 12, 1531–1551. https ://doi.org/10.1007/s1105 1-010-9900-y (2010). 32. Wu, Y., Ali, M. R., Chen, K., Fang, N. & El-Sayed, M. A. Gold nanoparticles in biological optical imaging. Nano Today 24, 120–140
(2019).
33. Brick, D. et al. Interface adhesion and structural characterization of rolled-up gaas/in 0.2 ga 0.8 as multilayer tubes by coherent phonon spectroscopy. Sci. Rep. 7, 5385 (2017).
34. Nardi, D. et al. Impulsively excited surface phononic crystals: a route toward novel sensing schemes. IEEE Sens. J. 15, 5142–5150 (2015).
35. Abbas, A. et al. Picosecond time resolved opto-acoustic imaging with 48 mhz frequency resolution. Opt. Express 22, 7831–7843 (2014).
36. Fuentes-Domínguez, R., Pérez-Cota, F., Naznin, S., Smith, R. J. & Clark, M. Super-resolution imaging using nano-bells. Sci. Rep.
8, 16373 (2018).
37. Liu, L., Plawinski, L., Durrieu, M.-C. & Audoin, B. Label-free multi-parametric imaging of single cells: dual picosecond optoacoustic microscopy. J. Biophoton. 12, e201900045 (2019).
38. Dehoux, T. et al. All-optical broadband ultrasonography of single cells. Sci. Rep. 5, 8650 (2015).
39. Pérez-Cota, F. et al. High resolution 3d imaging of living cells with sub-optical wavelength phonons. Sci. Rep. 6, 39326 (2016). 40. Pirri, G., Damin, F., Chiari, M., Bontempi, E. & Depero, L. E. Characterization of a polymeric adsorbed coating for dna microarray
glass slides. Anal. Chem. 76, 1352–1358 (2004).
41. Stoica, V. A., Sheu, Y.-M., Reis, D. A. & Clarke, R. Wideband detection of transient solid-state dynamics using ultrafast fiber lasers and asynchronous optical sampling. Opt. Express 16, 2322–2335 (2008).
42. Jolliffe, I. Principal Component Analysis (Wiley, Hoboken, 2002).
43. Wall, M. E., Rechtsteiner, A. & Rocha, L. M. Singular value decomposition and principal component analysis. In A practical approach to microarray data analysis, 91–109 (Springer, 2003).
44. Maier, S. A. Plasmonics: Fundamentals and Applications (Springer, Berlin, 2007).
45. Hodak, J. H., Henglein, A. & Hartland, G. V. Size dependent properties of au particles: Coherent excitation and dephasing of acoustic vibrational modes. J. Chem. Phys. 111, 8613–8621 (1999).
46. Crut, A., Maioli, P., Del Fatti, N. & Vallée, F. Acoustic vibrations of metal nano-objects: time-domain investigations. Phys. Rep.
549, 1–43 (2015).
47. Sun, C., Vallée, F., Acioli, L., Ippen, E. & Fujimoto, J. Femtosecond-tunable measurement of electron thermalization in gold. Phys. Rev. B Condens. Matter 50, 15337 (1994).
48. De Sá, J. M. Pattern Recognition: Concepts, Methods, and Applications (Springer, Berlin, 2001).
49. Kaufman, L. & Rousseeuw, P. J. Finding groups in data: an introduction to cluster analysis (Wiley, Hoboken, 2009). 50. Weisberg, S. Applied Linear Regression Vol. 528 (Wiley, Hoboken, 2005).
51. John, G. H. Robust decision trees: removing outliers from databases. KDD 95, 174–179 (1995). 52. Hodge, V. & Austin, J. A survey of outlier detection methodologies. Artif. Intell. Rev. 22, 85–126 (2004).
53. Link, S., Burda, C., Wang, Z. L. & El-Sayed, M. A. Electron dynamics in gold and gold-silver alloy nanoparticles: the influence of a nonequilibrium electron distribution and the size dependence of the electron-phonon relaxation. J. Chem. Phys. 111, 1255–1264 (1999).
54. Hodak, J. H., Henglein, A. & Hartland, G. V. Electron-phonon coupling dynamics in very small (between 2 and 8 nm diameter) au nanoparticles. J. Chem. Phys. 112, 5942–5947 (2000).
55. Jain, P. K., Qian, W. & El-Sayed, M. A. Ultrafast electron relaxation dynamics in coupled metal nanoparticles in aggregates. J. Phys. Chem. B 110, 136–142 (2006).
56. Schneider, D. et al. Role of polymer graft architecture on the acoustic eigenmode formation in densely polymer-tethered colloidal particles. ACS Macro Lett. 3, 1059–1063 (2014).
www.nature.com/scientificreports/
57. Bashkatov, A., Genina, E., Kochubey, V. & Tuchin, V. Optical properties of human skin, subcutaneous and mucous tissues in the wavelength range from 400 to 2000 nm. J. Phys. D Appl. Phys. 38, 2543 (2005).
58. Ali, M. R., Ali, H. R., Rankin, C. R. & El-Sayed, M. A. Targeting heat shock protein 70 using gold nanorods enhances cancer cell apoptosis in low dose plasmonic photothermal therapy. Biomaterials 102, 1–8 (2016).
59. Dreaden, E. C., Austin, L. A., Mackey, M. A. & El-Sayed, M. A. Size matters: gold nanoparticles in targeted cancer drug delivery. Ther. Deliv. 3, 457–478 (2012).
60. Wray, S., Cope, M., Delpy, D. T., Wyatt, J. S. & Reynolds, E. O. R. Characterization of the near infrared absorption spectra of cytochrome aa3 and haemoglobin for the non-invasive monitoring of cerebral oxygenation. Biochimica et Biophysica Acta (BBA)-Bioenergetics 933, 184–192 (1988).
Acknowledgements
G.F. acknowledges financial support from the MIUR - PRIN 2017 grant in the frame of the aSTAR Project (2017RKWTMY_003). F.R. acknowledges the financial support by MIUR - PRIN 2017 Project PELM, protocol n. 20177PSCKT.2. F.B., S.P., and F.R. acknowledge financial support from the MIUR - Futuro in Ricerca 2013 Grant in the frame of the ULTRANANO Project. F.B. acknowledges financial support from the IDEXLYON project Programme Investissements d’Avenir (ANR-16-IDEX-0005). F.B. and S.P. acknowledge financial support from fondazione E.U.L.O. This work has been partially supported by the Università Cattolica del Sacro Cuore through D.3.1 and D.2.2 grants.
Author contributions
G.F. conceived the project and developed the data analysis. F.B., C.G., and G.F. supervised and organized the research. S.P., A.R., G.B. made the optical time-resolved measurements and fitted the data. M.C. made the samples and characterized their chemistry P.P. made the SEM and AFM analysis and plasma-treated the samples. F.R. made the electron lithography for the samples substrate. G.F. wrote the manuscript with major inputs from F.B. All authors discussed the results and revised the manuscript.
competing interests
The authors declare no competing interests.
Additional information
Supplementary information is available for this paper at https ://doi.org/10.1038/s4159 8-020-72534 -1.
Correspondence and requests for materials should be addressed to G.F. Reprints and permissions information is available at www.nature.com/reprints.
Publisher’s note Springer Nature remains neutral with regard to jurisdictional claims in published maps and
institutional affiliations.
Open Access This article is licensed under a Creative Commons Attribution 4.0 International
License, which permits use, sharing, adaptation, distribution and reproduction in any medium or format, as long as you give appropriate credit to the original author(s) and the source, provide a link to the Creative Commons licence, and indicate if changes were made. The images or other third party material in this article are included in the article’s Creative Commons licence, unless indicated otherwise in a credit line to the material. If material is not included in the article’s Creative Commons licence and your intended use is not permitted by statutory regulation or exceeds the permitted use, you will need to obtain permission directly from the copyright holder. To view a copy of this licence, visit http://creat iveco mmons .org/licen ses/by/4.0/.