Jointly modelling air quality and meteorological
variables using the D-STEM software
Crescenza Calculli1, Annarita Turnone2, Francesco Finazzi3,∗, Alessio Pollice4and Alessandro Fassò5
1Italian Institute for Nuclear Physics, INFN - Bari, via E. Orabona n. 4, 70125 Bari, Italy;
2Apulia Region Environmental Protection Agency (ARPA Puglia), corso Trieste n. 27, 70126 Bari, Italy;
3 Dept. of Management, Economics and Quantitative Methods, University of Bergamo, via dei Caniana n.2,
24127 Bergamo, Italy; [email protected]
4Dept. of Economics and Mathematical Methods, University of Bari, largo Abbazia S. Scolastica n.53, 70124
Bari, Italy;
5Dept. of Engineering, University of Bergamo, viale Marconi n.5, 24044 Dalmine (BG), Italy;
∗Corresponding author
Abstract. This work discusses a general framework for mapping pollutant concentrations over a re-gion of interest considering both concentration and meteorological data. The framework is based on a multivariate space-time model able to handle missing data and non-colocated monitoring networks. The model is implemented and estimated by the D-STEM (Distributed Space Time Expectation Max-imization) software. As a case study, the model is used to produce daily maps of particulate matters and nitrogen dioxide concentrations for the Italian region Apulia. The official data from the air quality monitoring network of Apulia and the meteorological data from the Meteorological Service of Apulia are used, for a total of8 variables and thus a 8-variate model. In order to deal with the computational complexity, the Bari INFN high performance grid computing infrastructure is used.
Keywords. EM algorithm; Heterogeneous networks; Linear coregionalization model
1
Introduction
Mapping the airborne pollutant concentration over a region of interest is a classic problem when dealing with air quality assessment (see for instance [2]). In this work, we discuss a general framework for daily
Calculliet al. Air quality modelling using D-STEM
mapping multiple pollutants starting from data collected by multiple monitoring networks. The data include both the pollutant concentration measurements and the measurements of some meteorological variables that may drive the pollutant concentration. The problem is made more difficult by the fact that, in general, the air quality network and the meteorological network may differ in the number of stations and their spatial locations. Moreover, each variable can be observed over a subset of network stations and missing data are possible. The problem is solved considering a general multivariate space-time model able to accommodate for the above data characteristics and to estimate the pollutant concentration at unmonitored spatial locations. The model is implemented and estimated by the D-STEM software (see [1]) which is based on the Expectation Maximization algorithm and is suitable for handling large datasets. As new data are made available every day, model parameters are estimated in an adaptive manner, that is, the model is re-estimated every day considering only the data from the previous n days. This allows to reduce the computation burden implied by a large n and to avoid the influence of "old" data on present estimations. Within this framework, maps of particulate matters (PM10) and nitrogen
dioxide (NO2) concentrations, uncertainty included, are daily provided for the Apulia region, Italy. The
rest of the paper discusses the statistical model, the data and some preliminary results.
2
Statistical model
Let y(s,t) be the q-variate observation vector at spatial location s and time t. The general model has the following form:
y(s,t) = µ(s,t) + ω(s,t) + ε(s,t) (1)
where µ(s,t) = Xβ(s,t)β is the fixed effect, ω(s,t) is the random effect given by
ω(s,t) =
c
∑
j=1
αj xj(s,t) wj(s,t) + Xz(s,t)z(t) (2)
while ε(s,t) is a random error uncorrelated over space and time. The symbol represents the Hadamard product and
Xβ(s,t) = blockdiag(xβ,1(s,t), ..., xβ,q(s,t)),
Xz(s,t) = blockdiag(xz,1(s,t), ..., xz,p(s,t)),
where blockdiag is the block diagonal building operator. The vectors of loading coefficients xβ,i(s,t)
have dimensions 1 × bifor i = 1, ..., q while the vectors xz,k(s,t) have dimensions 1 × akfor k = 1, ..., p.
In Equation 2, each multivariate spatial latent variable wj(s,t), for each fixed t, is modelled as a
linear coregionalization model with the following spatial variance-covariance matrix functions
Γj(ks − s0k) = Vjρ(ks − s0k; θj, ν), (3)
where Vjis a valid q × q correlation matrix and j = 1, ..., c. On the other hand, the p-dimensional latent
component z(t) has the following Markovian dynamics:
z(t) = Gz(t − 1) + η(t)
with transition matrix G assumed to have eigenvalues smaller than 1 in absolute value and innovations η(t) ∼ Np(0, Ση). Finally, the elements of ε(s,t) are independent and normally distributed with
vari-ances σ2i, i = 1, ..., q.
The model parameter set is ψ = {β, σ2, α, θ, v, G, vη}, where σ2= (σ21, ..., σ2q)>, α is the cq × 1
dimensional vector obtained by stacking α1, ..., αc and v is the cq(q − 1)/2 × 1 dimensional vector
obtained by stacking the unique and non diagonal elements of V1, ..., Vc.
Calculliet al. Air quality modelling using D-STEM
3
Data sets
Pollutant concentration and meteorological data are provided by the Apulia Region Environmental Pro-tection Agency and by the Associazione Regionale dei Consorzi di Difesa della Puglia, respectively. In this work, we considered a summer season (1st July 2012 - 30thSeptember 2012) characterized by high temperature and an intrusion of long range transported air mass from the African continent, with a large number of sites exceeding the daily PM10limit value of 50 µg/m3. PM10 and NO2 are monitored at 73
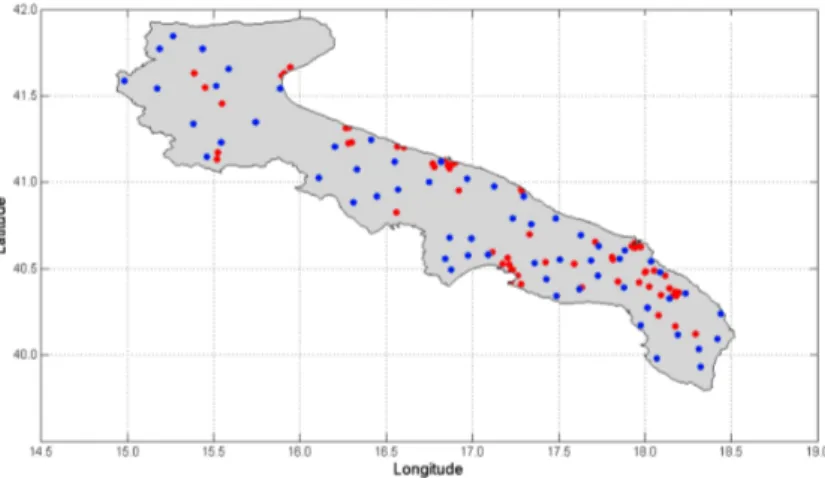
and 68 stations, respectively. This implies that some stations only measure one pollutant. The missing data rate for the above temporal period is 13%. On the other hand, meteorological variables are measured at 58 stations with no missing data and they are: atmospheric pressure, relative humidity, temperature, wind speed, east-west wind component and north-south wind component. Some covariates are also con-sidered and in particular population density, land elevation, latitude and longitude. Note that, as the air quality and meteorological networks are not colocated (see Figure 1), the meteorological variables are not available at the spatial locations where pollutants are measured. To avoid interpolation, air quality and meteorological variables are all considered as response variable (thus, q = 8).
Figure 1: Apulia region air quality network (red dots) and meteorological network (blue dots)
4
Model estimation and mapping
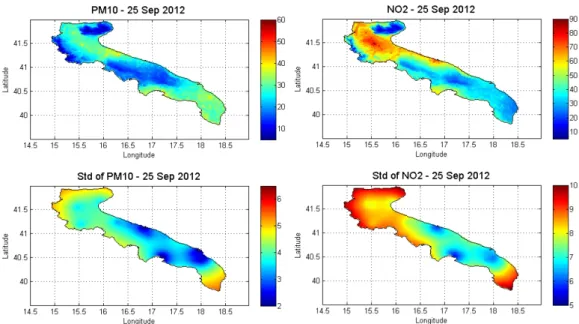
For each day t of the temporal period defined in the previous section, the model in Equation 1 is estimated considering the last 20 days (from t − 19 to t) and it is eventually used to map the pollutant concentration at day t. This way, model parameters are updated every day and the "old" data are forgotten. This approach is particularly useful if the temporal period is long or if the model is used to produce maps every day as soon as new data are available. As the model is 8-variate, the number of model parameters to be estimated is very high. Nonetheless, the D-STEM software is based on the EM algorithm which is stable and reaches convergence even when q is high. Model estimation and mapping were performed on the Bari INFN high performance grid computing infrastructure. The maps of Figure 2 show the daily average pollutant concentrations (and respective standard deviations) for a particular day within the temporal period.
Calculliet al. Air quality modelling using D-STEM
Figure 2: Daily average pollutant concentration and standard deviation maps for PM10 and NO2 on
September 25th, 2012
Acknowledgments. This work was partially funded by the FIRB2012 project "Statistical modelling of environmental phenomena: pollution, meteorology, health and their interactions" (RBFR12URQJ). The authors thanks the Associazione Regionale dei Consorzi di Difesa della Puglia, ASSOCODIPUGLIA, for providing the meteorological data and UNIBA-INFN Bari for the access to the high performance grid computing infrastructure ReCas (PON Ricerca e Competitività 2007-2013, Avviso 254/Ric.)
References
[1] Finazzi, F. and Fassò A. (2014). D-STEM: A software for the analysis and mapping of environmental space-time variables. Journal of Statistical Software. Accepted.
[2] Finazzi, F., Scott, E. M. and Fassò, A. (2013). A model-based framework for air quality indices and popu-lation risk evaluation, with an application to the analysis of Scottish air quality data. Journal Of The Royal Statistical Society: Series C, 62(2), 287–308.