UNIVERSITÀ DEGLI STUDI DI SASSARI
XXI CICLO DI DOTTORATO
SCUOLA DI DOTTORATO IN SCIENZE BIOMEDICHE
____________
ELASTOGRAFIA EPATICA:
METODICHE A CONFRONTO
Coordinatore:
Prof. Andrea Piana
Tutor:
Dott. Gianpaolo Vidili
Tesi di Dottorato di:
SEBASTIANA MARIA ATZORI
CONTENTS
LIST OF ABBREVIATIONS 4
ABSTRACT 5
LIVER DAMAGE 7
HISTOLOGICAL ASSESSMENT OF LIVER FIBROSIS 11
GRADING 11
STAGING 11
SEMI-QUANTITATIVE ESTIMATION OF HISTOLOGICAL DAMAGE 11
KNODELL 12
ISHAK 13
METAVIR 14
NON-ALCOHOLIC FATTY LIVER (NAFL) 14
NAFLD ACTIVITY SCORE (NAS) 16
SAF(STEATOSIS,ACTIVITY,FIBROSIS) SCORE 17
LIVER BIOPSY 18
INDICATIONSFORLIVERBIOPSY[53] 18
ABSOLUTECONTRAINDICATIONS[53] 18
RELATIVE[53] 18
NON-INVASIVE METHODS FOR EVALUATION OF LIVER FIBROSIS 22
SERUMMARKERSOFLIVERFIBROSIS 22
LIVERSTIFFNESSIMAGINGTECHNIQUES 25
PHYSICAL PRINCIPLES 26
TRANSIENTELASTOGRAPHY 32
ACOUSTICRADIATIONFORCEIMPULSE(ARFI) 36
REAL-TIMESHEAR-WAVEELASTOGRAPHY 37
ASSOCIATIONBETWEENFIBROSCANANDSERUMMARKERS 38
PROGNOSTICVALUEOFNON-INVASIVETESTS 39
CONTROLLEDATTENUATIONPARAMETER(CAP SCORE) 40
METHODOLOGY 43
AIMS&OBJECTIVES 43
STUDYDESIGN 43 INCLUSIONCRITERIA 43 EXCLUSIONCRITERIA 44 STUDYPROCEDURES 45 ETHICAL APPROVAL 45 ELAST PQ 45 PATIENTS 46 BREATHING PHASE 46 LIVER LOCATION 47 PROBE POSITION 47
MEASUREMENT RESULTS 48
VIRTUAL TOUCH HDTISSUE 48
PATIENTS 48 BREATHING PHASE 48 PROBE POSITION 49 LIVER LOCATION 49 MEASUREMENT RESULTS 49 FIBROSCAN 50 PATIENTS 50 PROBE POSITION 50 MEASUREMENT RESULT 50 CAP SCORE 50 LIVER HISTOLOGY 50 HISTOLOGICAL ASSESSMENT 51 BLOOD SAMPLES 51 STATISTICAL METHODS 51 RESULTS 52 DISCUSSION 55 TABLES OF RESULTS 57 REFERENCES 65
LLIST OF ABBREVIATIONS
ARFI – Acoustic Radiation Force Impulse ROI – Region of Interest
RTE – Real-Time Elastography SWE– Shear-Wave Elastography SR – Strain Ratio
SRI – Strain Rate Imaging SSI – Supersonic Shear Imaging TE –Transient Elastography US – Ultrasonography
VCS – Visual Categorical Score OVs - Oesophageal varices LS - liver stiffness
NAFL - non-alcoholic fatty liver NASH – non-alcoholic steatohepatitis NAS - NAFLD activity score
pSWE - Point shear-wave elastography
2-D SWE – 2-dimensional shear-wave elastography HVPG - pressure gradient of the hepatic vein Kilo Pascal - kPa
Metres per second - m/s
A
ABSTRACT
Background: The cirrhotic process of liver injury is the end-stage of hepatic fibrosis, which results
from progressive accumulation of extracellular matrix during the wound-healing response of the liver to repeated injury.
Mortality and morbidity rates increase exponentially once cirrhosis develops. Therefore, a prompt assessment of the degree of severity of fibrosis, an accurate and timely diagnosis of liver cirrhosis and management of complications are important in guiding therapy management in chronic liver disease. Liver biopsy is often required, but it is an invasive procedure, with a risk of severe complications (1/4000–10,000). In addition, its accuracy is prone to sampling error (6) and inter-and/or intra-observer diagnostic discrepancies occur in up to 10–20% of liver biopsies. For this reason, there is increasing interest in non-invasive methods for detecting liver fibrosis.
Ultrasound-based transient elastography (TE) is one of the first non-invasive imaging methods to be used in common practice. The technique is based on low-frequency vibrations: shear waves produced by the ultrasound machine propagate through the tissue and produce an elastic deformation, with the premise that liver stiffness (LS) measurements reflect the degree of hepatic fibrosis. Displacement is reflected in the variation of the acquired echo signals. The Siemens-based ARFI system and Philips Elast PQTM use conventional US to generate a shear wave directly within the liver tissues. This allows the sonographer to obtain both conventional US images and also specify a region of interest (ROI) for estimation of liver stiffness. The propagation velocity of the shear wave is reported in metres per second, and correlates with liver stiffness. The direct generation of shear wave within the liver tissue holds advantages over TE since it is not subject to chest/abdominal wall distortion of the waves.
Results: 110 consecutive patients with liver disease underwent a liver biopsy and liver stiffness
and Echosens FibroscanTM (currently the best-validated technique). The results of these three imaging techniques were compared with histological results.
A direct, strong correlation was observed between LS values assessed by TE elastography by Elast PQ and Virtual Touch (p < 0.0001) and Metavir score.
LLIVER DAMAGE
Hepatic fibrosis can be defined as a dynamic process involving cellular, molecular and tissue processes which leads to the accumulation of components of the cellular matrix (ECM) in the liver parenchyma [8]. The pathologies associated with the development of liver fibrosis include chronic infection by hepatotropic viruses (HBV and HCV), chronic exposure to toxic substances (the most common cause being alcohol misure), chronic exposure to altered metabolic conditions and damage caused by autoimmune alterations. The chronic liver damage caused by a chronic inflammatory response, combined with other pathogenetic mechanisms, such as oxidative stress, alteration of the relationship between mesenchymal and epithelial cells and the activation of fibrogenesis, leads to an unbalanced process which favours the formation of fibrous tissue [9-13]. The accumulation of extracellular matrix proteins determines a progressive alteration of the liver architecture, initially characterised by the formation of fibrous septa, as a result of regenerative nodules, with the subsequent development of cirrhosis. Cirrhosis causes hepatocellular dysfunction and determines an increase in resistance of hepatic blood circulation with the development of hepatic insufficiency and portal hypertension [14]. In most patients, the progression to cirrhosis occurs over a period of 15-20 years.
The main complications of cirrhosis include ascites, renal failure, hepatic encephalopathy and variceal bleeding. Patients with compensated cirrhosis do not develop complications for many years, whereas decompensated cirrhosis is associated with reduced survival; the only effective therapeutic strategy is liver transplant. Cirrhosis is also a risk factor for the development of hepatocellular carcinoma [15].
In recent years, substantial progress has been made in understanding the mechanisms that regulate fibrogenesis. In hepatic fibrosis hepatic stellate cells (HSCs), also called Ito cells or perisinusoidal cells, play a fundamental role, as an essential element for the production of collagen in the liver. This type of cell, described for the first time by Kupffer in 1876, undergoes a radical phenotypic
change in the presence of chronic liver disease, with consequent acquisition of fibrogenic properties [15]. In addition to hepatic stellate cells, portal myofibroblasts and bone marrow cells also appear to have fibrogenic potential [16].
The natural history of liver fibrosis is influenced by both genetic and environmental factors. The genes that regulate apoptosis and/or hepatocellular necrosis (Bcl-xL, Fas) affect the extension of liver damage and the subsequent fibrogenic response [17]. Genes regulating inflammatory response to liver injury (IL-1, IL 6, IL 10, IL-13, IFN, SOCS- 1 and osteopontin) determine the fibrogenic response to injury itself [17], while the genes that mediate the production of ROS (NADPH oxidase) regulate both inflammatory response and the deposition of extracellular matrix [18]. Fibrogenic growth factors (TGF-1, FGF), vasoactive substances (angiotensin II, norepinephrine) and adipokines (leptin and adiponectin) are necessary elements for the development of fibrosis [19]. Excess collagen removal is regulated by TIMP-1 and TGF-1 [20].
When the liver suffers an acute damaging stimulus, the parenchymal cells regenerate themselves and replace the necrotic or apoptotic cells. This process determines an inflammatory response and a limited deposition of extracellular matrix. If the damaging stimulus persists, the liver cells are no longer able to regenerate and the hepatocytes are replaced by abundant extracellular matrix, composed primarily of collagen fibres. The arrangement of the fibrous tissue depends on the type of damaging stimulus. In chronic viral liver disease and cholestatic hepatitis, fibrous tissue is localised initially in the portal spaces; in alcoholic liver disease it is localised in perisinusoidal areas [21]. Liver fibrosis is characterised by alterations in both the quantity and composition of the extracellular matrix. In advanced stages of fibrosis, the liver contains a quantity of extracellular matrix approximately six times higher than normal, predominantly consisting of collagen (I, III and IV), fibronectin, elastin, laminin, hyaluronic acid and proteoglycans. This extracellular matrix accumulation is caused by an increase in its synthesis and reduction in its degradation. The reduced activity of the metallo-proteinase (MMP), the enzymes responsible for extracellular matrix degradation, essentially depends on the increase in their specific inhibitors (TIMPs) [22].
Hepatic stellate cells (HSCs) are the main cells responsible for producing extracellular matrix in liver damage. In the normal liver, HSCs are localised in the space of Disse and store vitamin A. During liver injury, HSCs are activated and differentiate into fibrogenic and proliferating myofibroblasts [23]. Activated HSCs migrate and accumulate in the area of damaged tissue, producing a large amount of extracellular matrix and regulating its degradation. The Platelet-Derived Growth Factor (PDGF), produced primarily by Kupffer cells, is the most important mitogenic agent for HSCs. Collagen synthesis in HSCs is regulated both at the transcriptional level and the post-transcriptional [24]. The increase in collagen messenger RNA stability results in a greater production of this protein by activated HSCs [25].
In addition to hepatic stellate cells, other cell lines have fibrogenic potential. The myofibroblasts from small portal vessels proliferate around biliary tracts initiating collagen deposition in the liver fibrosis caused by cholestatic [26] disease. In addition, experiments on in vitro culture of hematopoietic stem cells CD34 + CD38- with different growth factor cells have led to the differentiation of hepatic stellate cells (HSCs) and myofibroblasts derived from bone marrow, able to localise in human liver tissue, resulting in remodelling of tissue architecture [27].
Moreover, the damaged hepatocytes produce reactive oxygen species (ROS) and fibrogenic mediators with consequent recruitment of inflammatory cells. Apoptosis of damaged hepatocytes stimulates collagen production by liver myofibroblasts [28]. The inflammatory cells, both polymorphonuclear and lymphocytic, activate the hepatic stellate cells with consequent production of collagen [29]. The activated hepatic stellate cells secrete inflammatory chemokines, express cell adhesion molecules and modulate the activation of lymphocytes [30]. In addition, the fibrogenic process is influenced by different subtypes of T helper lymphocytes present and the Th2 response is associated with an increased fibrogenesis [31]. Kupffer cells are resident macrophages that play an important role in liver inflammation by releasing ROS and cytokines [32]. Changes in extracellular matrix composition are able to directly stimulate fibrogenesis. Type IV collagen, fibrinogen and
urokinase-type plasminogen activator stimulate hepatic stellate cells through the activation of latent cytokines, such as TGF-1 [33].
The monocyte chemotactic protein-1 stimulates fibrogenesis, while IL-10 and IFN have the opposite effect [34]. Among the growth factors, TGF is a key mediator in human fibrogenesis, stimulating synthesis of extracellular matrix proteins and inhibiting their degradation [35]. The platelet-derived growth factor (PDGF) is the most important mitogen for hepatic stellate cells and its production increases in the fibrotic liver [36]. Cytokines with vasoactive properties regulate liver fibrogenesis. Substances that promote vasodilation (nitric oxide, relaxin) have antifibrotic effects, while substances that promote vasoconstriction (norepinephrine, angiotensin II) have the opposite effects [37]. Among the vasoactive cytokines, angiotensin II seems to play an important role in liver fibrogenesis; it is involved in liver inflammation and stimulates the proliferation and migration of hepatic stellate cells, the production of proinflammatory cytokines and collagen synthesis [39-40].
H
HISTOLOGICAL ASSESSMENT OF LIVER FIBROSIS
Histological assessment of the liver is able to quantify liver damage by identifying the necro-inflammatory grade or "grading" and the degree of fibrosis or "staging".
Grading
Grading is a histological evaluation of the necro-inflammatory state of the liver, and is identified by the following characteristics:
1. Quantity of inflammatory infiltrate (consisting of rare lymphocytes and plasma cells) in the portal tracts, hepatic artery and portal vein branches and biliary interlobular ducts within the fibrous matrix.
2. Quantity of periportal and lobular necrosis and destruction of hepatocytes induced by inflammatory cells (piecemeal necrosis).
3. Entities of confluent necrosis exceeding the limiting lamina and combining or forming bridges between vascular structures or, even more important, portals (bridging necrosis).
4. Quantity of degeneration of hepatocytes and focal necrosis within the lobule. All these data provide the histological grading of the disease [41, 42].
Staging
Staging is a histological evaluation of liver fibrosis and reflects the level of disease progression.
Semi-quantitative estimation of histological damage
In order to classify these histological alterations, the following standardised semi-quantitative scoring systems have been developed and are used in clinical practice.
K
Knodell
In 1981 Knodell and colleagues proposed a scoring system based on a numerical index of histological activity (Histology Activity Index, HAI). The model considers four separate scores for each component of the lesion: from 0 to 10 for periportal necrosis with or without bridging necrosis, 0 to 4 for intralobular degeneration and focal necrosis, 0 to 4 for portal inflammation, and 0 to 4 for fibrosis. The first three categories assess the intensity of inflammatory activity (grading) while the fourth indicates the degree of fibrosis (staging). In this model fibrosis scores are used on a discontinuous scale. Fibrosis is classified thus:
0 = absent
1 = fibrous portal expansion
3 = bridging fibrosis (porto-portal and porto-central) 4 = cirrhosis.
The main limitation of this system is that it groups necro-inflammatory activity and fibrosis, while these parameters describe different types of lesion and have different prognostic implications [43].
HISTOLOGICAL PATTERN SEVERITY SCORE Periportal necrosis piecemeal necrosis (PN) bridging necrosis (BN) Absent PN Mild PN Moderate PN Severe PN + BN Moderate PN + BN Severe Lobular necrosis 10 0 1 3 4 5 6 Intralobular necrosis Absent Mild Moderate Marked 0 1 3 4
Portal inflammation Absent Mild Moderate Severe 0 1 3 4
Ishak
In1994 Ishak and colleagues proposed a revision of the Knodell model with some changes. This system uses a continuous scale of values that describes the degree of activity and the stage of fibrosis as two separate parameters [44]. Grading assessment is carried out separately, considering the different forms of necrosis and attributing a maximum score of 18 for the necro-inflammatory component. Staging evaluation is carried out using a continuous scale, giving a maximum score of 6 for cirrhosis.
Fibrosis Absent
Portal tract expansion Bridging fibrosis Cirrhosis 0 1 3 4 Maximum score 22 HISTOLOGICAL PATTERN SEVERITY SCORE
Piecemeal necrosis Absent
Mild few mild focal areas) Mild/Moderate Moderate Severe 0 1 2 3 4
Confluent necrosis Absent
Focal confluent
Zone 3 necrosis in some areas Zone 3 necrosis in most areas Zone 3 necrosis + occasional portal-central bridging
Zone 3 necrosis + multiple P-C bridging Panacinar bridging 0 1 2 3 4 5 6
This system is less complex than the HAI and it can assess the portal/periportal component and the necro-inflammatory component separately.
M Metavir
This classification system was proposed by the French cooperative study group METAVIR, and provided two separate scores for the evaluation of histological activity and fibrosis stage. It reflects the combination of lobular necrosis, portal inflammation, piecemeal necrosis and bridging necrosis. The activity ranges from 0 to 3. Fibrosis is classified into four stages [45].
HISTOLOGICAL PATTERN SCORE
No fibrosis 0
Enlargement of portal tract without septa formation
1 Rare septa formation (> 1 septum) 2
Several septa 3
Cirrhosis 4
Non-alcoholic fatty liver (NAFL)
Steatosis is a result of excess accumulation of triglycerides in the liver. The threshold for considering steatosis as an abnormal feature is 5% hepatocytes. Steatosis is usually macrovesicular, but may be either purely large droplet or a mixture of small and large droplets (mediovesicular
Focal lytic necrosis, apoptosis and focal inflammation
Absent
One focus or less per 10 x objective
2 to 4 foci 5 to 10 foci More than 10 foci
0 1 2 3 4
Portal inflammation Absent
Mild, some or all portal areas Moderate, some or all portal areas
Moderate/Marked, all portal areas
Marked, all portal areas
0 1 2 3 4 Maximum score 18
steatosis). In macrovesicular steatosis, the lipid vacuole almost entirely fills the hepatocyte, pushing the nucleus to the side. Mediovesicular steatosis occurs when there are one or more smaller vacuoles in the cytoplasm. Microvesicular steatosis is a rare form in which the hepatocyte cytoplasm is replaced by innumerable small vacuoles, giving the cell a foamy appearance. True diffuse microvesicular steatosis is uncommon, but it may occur with patchy distribution in up to 10% of NAFLD. Steatosis may be distributed in a distinctly zone 3 (pericentral) centred pattern, but abundant steatosis can be panacinar, and when resolving, it may be irregular throughout the whole acinus. It is rare for steatosis to be localised in zone 1 (characteristic pattern of paediatric NAFLD), and as the disease progresses towards cirrhosis, steatosis may become more irregularly distributed or may vanish. A simple four-scale grading system (from 0 to 3) is used for grading steatosis. It takes into account only macro- and/or mediovesicular steatosis and assesses the percentage of hepatocytes decorated by steatotic vacuoles [19]. Normal liver (Grade 0) contains fat in < 5% of hepatocytes, while grade 1 steatosis refers to 33% steatotic hepatocytes. In grade 2 and 3 steatosis, fat is present in at least 33% or 66% of hepatocytes, respectively [46].
The relationship between steatosis and steatohepatitis is unclear. Although the natural history of NAFLD is still incompletely understood, it is clear that those who have the histological pattern of non-alcoholic steatohepatitis (NASH) and advanced fibrosis are at much greater risk of developing end-stage liver disease, liver-related mortality or extra-hepatic mortality than the general population of the same age and sex [47-48].
There are no non-invasive tests that can be performed to firmly identify patients with steatohepatitis or distinguish steatohepatitis from pure steatosis. Therefore, if there is a need to know with certainty whether or not a patient has NASH, a liver biopsy must be performed [49]. It is uniformly accepted that two cardinal features - lobular inflammation and liver cell clarification/ballooning - are mandatory features for NASH diagnosis. These patterns have been characterised best in the adult liver in which the lesions centre around the terminal hepatic vein, but once fibrosis progresses and
Inflammation is more often lobular in NASH, typically more prominent than portal inflammation in uncomplicated adult NAFLD. It consists mainly of clusters of mononuclear, but also Kupffer cells, microgranulomas with or without the lipid droplets, sometimes associated with hepatocyte dropout or apoptotic bodies. Neutrophil aggregates are rare and become prominent only if numerous Mallory–Denk bodies are present. The degree of lobular inflammation is usually mild and, when abundant, should suggest another or associated aetiology such as alcohol or drug toxicity [51]. Ballooned hepatocytes need to display both clear, flocculent, non-vacuolar cytoplasm, with a ballooned shape, as defined by the loss of the sharp angles of the liver cell. Size may or may not be increased compared to the size of normal hepatocytes. In the NAFLD activity score (NAS), ballooned cell grading is based mainly on number (none, few, many), while in the SAF score, it is mainly based on the size of ballooned cells.
Other features of hepatocellular injury may also be observed, such as apoptotic bodies, but they are usually sparse and inconstant. Mallory–Denk bodies may be present but they are less well-formed than in alcoholic hepatitis or alcoholic steatohepatitis and sometimes detected only by using p62 or ubiquitin immunohistochemistry. They can be numerous in severe NASH, but numerous Mallory– Denk bodies may suggest an associated alcoholic or toxic injury. The presence of Mallory–Denk bodies correlates with the histological severity of steatohepatitis and with other markers of progression and fibrosis in NASH [52].
NAFLD displays a continuous spectrum of steatosis, hepatocyte damage and inflammatory and fibrous lesions. Therefore, the categorisation of NAFLD into two subgroups (NASH, no NASH) is an oversimplification. Semi-quantitative scoring systems may partially avoid this limit.
N
NAFLD activity score (NAS)
NAS is based on the concept that necroinflammatory lesions and fibrosis stage should be separately evaluated, as the former is potentially more reversible than the latter. NAS was created as an unweighted score for steatosis (0–3), lobular inflammation (0–3) and ballooning (0–2).
Steatosis 0 < 3% 1 5-33% 2 33-66% 3 >66%
Lobular inflammation 0 No foci 1 < 2 foci/200x 2 2-4 foci/200x 3 > 4 foci/200 x
Hepatocyte ballooning 0 None
1 Few balloon cells
2 Many cells/prominent ballooning
S
SAF (Steatosis, Activity, Fibrosis) score
Steatosis NAS Activity Fibrosis
0-3 0-8 0-4
0 < 5 % Steatosis 0-3 0 Normal
1 5-33 % + Balloonisation 0-2 1 Central
2 34-66% + Inflammation 0-3 2 Central + portal
3 67-100% 3 Septal fibrosis
LLIVER BIOPSY
Liver biopsy has long been the “gold standard” for the diagnosis, staging and follow-up of liver diseases and is currently the comparison method in comparative studies on the efficiency of non-invasive diagnostic markers of fibrosis. The biopsy for liver disease can be performed by the percutaneous, laparoscopic or transjugular approach.
INDICATIONS FOR LIVER BIOPSY [53]
• Multiple parenchymal liver disease
• Abnormal liver function tests of unknown origin • Fever of unknown origin
• Focal or diffuse abnormalities in imaging studies • Prognostic-staging of known parenchymal liver disease
• Management-developing treatment plans based on histologic results.
ABSOLUTE CONTRAINDICATIONS [53]
• Uncooperative patient • Platelets <50,000/mm • Severe coagulopathy
• Infectious diathesis of the liver parenchyma
RELATIVE [53]
Ascites
Possible vascular lesions Amyloidosis
The percutaneous biopsy is the most rapid, secure and most widely used approach for studying, grading and staging diffuse liver disease. In addition, most of the centres now use echo-assisted or ultrasound-guided percutaneous biopsy with a significantly reduced number of complications [54,55,56,57].
After the liver biopsy, the patient must remain under observation for 6 hours. During that period clinical parameters including blood pressure and heart rate should be monitored. Liver biopsy is a procedure that can be performed in an outpatient setting. Liver biopsy complications rarely occur. 60% of complications occur within 2 hours and 96% within 24 hours of the procedure. A proportion of patients between 1% and 3% require hospitalisation for complications [58].
Minor complications include transient post-biopsy pain in the right hypochondrium area, experienced by patients in approximately 30% of cases, and the resulting transient hypotension with a vaso-vagal reaction. Major complications include intraperitoneal bleeding, subcapsular or intraparenchymal haematoma, haemobilia and accidental puncture of other organs such as the lung, kidney, gall bladder or colon, resulting in bile peritonitis, pneumothorax, subcutaneous emphysema, pleural effusion, haemothorax, sepsis or abscesses and haemoptysis [59]. With improved techniques and tools and ultrasound devices, the major complications have decreased substantially over time and currently range between 0.3% and 12.57% [60].
Post-procedure mortality varies from 0.01% to 0.17% and is mostly caused by bleeding in patients with cirrhosis or primitive malignant lesions of the liver [61]. Another important aspect to consider is the cost of this diagnostic procedure [62]. The main limitations of the histological assessment of liver biopsy are sampling error and variability in inter- and intra-observer interpretation. Sampling error is closely related to irregular distribution of liver damage and involves both staging and necro-inflammatory grading that is usually underestimated. The importance of sampling errors has recently been emphasised by one study on liver biopsies, obtained by the laparoscopic approach which showed differences in excess of one point of the fibrosis score according to Scheuer between
the left lobe and right lobe in about one third of cases (30.4 %); however in 14.5% of cases the diagnosis of cirrhosis was made in one lobe but, not the other [63].
Autopsy studies and laparoscopic comparison indicate that liver biopsy underestimates cirrhosis in 10-30% of cases, depending on the type of needle used and the size of the sample taken [64, 65]. Sampling error decreases in proportion to the increase in size of the biopsy specimen. Generally, for an accurate diagnosis a sample of liver 1.5-2.5 cm in length and 1.2-2 mm thick is necessary [46]. The importance of sample size is demonstrated by a study that showed that correct diagnosis is possible in 65% of cases with samples of 15 mm length and above 75% of cases with cores of 25 mm length [46]. The number of portal tracts in the sample is also very important; the sample must include at least eleven portal spaces [46].
P
PORTAL HYPERTENSION
Portal hypertension (PHT) is a clinical syndrome defined by a portal venous pressure gradient between the portal vein (PV) and inferior vena cava exceeding 5 mmHg [1]. Cirrhotic PHT is associated with an elevated hepatic venous pressure gradient (HVPG) predominantly due to raised sinusoidal resistance. non-cirrhotic PHT (NCPH), HVPG is normal or only mildly elevated and is significantly lower than PV pressure.
Non-cirrhotic Portal Fibrosis (NCPF) variously called as Idiopathic PHT (IPH), hepatoportal sclerosis and obliterative venopathy, is a disorder of unknown etiology, clinically characterized by features of PHT; moderate to massive splenomegaly, with or without hypersplenism, preserved liver functions, and patent hepatic and portal veins.
Rarity of the disease in the west, a declining trend with improved standards of living and hygienic conditions support the role of infections, of imprecise nature, at an early age in the disease pathogenesis. Role of prothrombotic disorders in the pathogenesis is supported by autopsy studies
showing high prevalence of PV thrombosis (PVT) and studies from the west indicating association with prothrombotic states. Immunological basis is propagated due to female preponderance, association with various immunological and autoimmune disorders, and presence in serum of various autoantibodies. phlebosclerosis, fibroelastosis, periportal, and perisinusoidal fibrosis, aberrant vessels in portal tract (portal angiomatosis), preserved lobular architecture, and differential atrophy. Main PV trunk is dilated with thick sclerosed walls, along with thrombosis in medium and small PV branches – the histological hallmark termed ‘‘obliterative portal venopathy’’. Long term survival after eradication of esophagogastric varices and after a properly timed shunt surgery is nearly 100% and 80%, respectively [17,101]. Liver functions usually remain well preserved, but with course of time in 20–33% of cases, liver slowly undergoes parenchymal atrophy with subsequent decompensation, development of HPS and need for LTx [102,103]. follow-up study, PVT, ascites and liver failure have been shown to develop in 46%, 50%, and 21%, respectively, over a mean period of 7.6 years – the later 2 complications were associated with variceal bleeding, surgery or concurrent extrahepatic disease [14]. Worsening of preexisting PHT and development of new PVT occurred in 46% and 28%, respectively, with a proportion requiring LTx [15]. Development of PVT is thus considered a major event contributing to progression of liver disease and eventual decompensation. However, the same has not been shown in the transplant and autopsy series
N
NON-INVASIVE METHODS FOR EVALUATION OF LIVER FIBROSIS
In recent years, research has focused on the evaluation of non-invasive methods for the assessment of liver fibrosis.
According to EASL guidelines, non-invasive methods are not merely an alternative to biopsy for staging fibrosis, but also predictive of the incidence of liver-related complications of liver fibrosis, including HCC development [66].
Non-invasive methods rely on two different approaches: a biological approach based on the quantification of biomarkers in serum samples or a “physical” approach based on the measurement of liver stiffness (LS).
SERUM MARKERS OF LIVER FIBROSIS
Serum markers of liver fibrosis are divided into direct and indirect markers. Indirect markers reflect the liver damage and include routine laboratory parameters such as GOT/AST transaminases and GPT/ALT, platelet count, gamma globulin, albumin, cholinesterase and INR. Direct markers reflect the changes in the extracellular matrix and enzymes. This category includes part of the glycoproteins, such as hyaluronic acid and laminin, collagens, such as procollagen III and collagen type IV and matrix metalloproteinases (MMPs) and their inhibitors (TIMPs). The advantage of serum markers is that they are universally available and reproducible. However, they can be influenced by comorbidities and medications that need to be considered when the results are interpreted. The table shows the different serum markers available.
HCV
Fibrotest patented formula combining α-2-macroglobulin,
γGT, apolipoprotein A1, haptoglobin, total bilirubin, age and gender
Forns Index 7.811 - 3.131 x ln(platelet count) + 0.781 x ln(GGT) +
3.467 x ln(age) - 0.014 x (cholesterol)
FibroSpect IITM patented formula combining α-2-macroglobulin, hyaluronate and TIMP-1
MP3 0.5903 x log(PIIINP [ng/ml]) - 0.1749 x log(MMP-1
[ng/ml])
Enhanced Liver Fibrosis scoreTM (ELF) patented formula combining age, hyaluronate, MMP-3 and TIMP-1
Fibrosis Probability Index (FPI) 10.929 + (1.827 x Ln[AST]) + (0.081 x age) + (0.768 x past alcohol use*) + (0.385 x HOMA-IR) –(0.447 x cholesterol)
HepascoreTM patented formula combining bilirubin, γGT,
hyaluronate, α-2-
macroglobulin, age and gender
FibrometerTM patented formula combining platelet count,
prothrombin index, AST, α-2-macroglobulin, hyaluronate, urea and age
Lok index -5.56 - 0.0089 x platelet (103/mm3) + 1.26 x
AST/ALT ratio = 5.27 x INR
Gotebörg University Cirrhosis Index (GUCI) AST x prothrombin - INR x 100/platelet
Virahep-C model -5.17 + 0.20 x race + 0.07 x age (yr) + 1.19 ln(AST
[IU/L]) - 1.76 ln(platelet count [103/ml]) + 1.38 ln(alkaline phosphatase (IU/L])
Fibroindex 1.738 - 0.064 x (platelets [104/mm3]) + 0.005 x (AST
[IU/L]) + 0.463 x (gamma globulin [g/dl])
HALT-C model -3.66 - 0.00995 x platelets (103/ml) + 0.008 x serum
TIMP-1 + 1.42 x log(hyaluronate)
HBV
Hui score 3.148 + 0.167 x BMI + 0.088 x bilirubin - 0.151 x
albumin - 0.019 x platelet
Zeng score -13.995 + 3.220 log(α-2-macroglobulin) + 3.096
log(age) + 2.254 log(GGT) + 2.437 log(hyaluronate)
HIV-HCV
FIB-4 age (yr) x AST [U/L]/(platelets [109/L] x (ALT
[U/L])1/2
SHASTA index -3.84 + 1.70 (1 if HA 41-85 ng/ml, 0 otherwise) +
3.28 (1 if HA >85 ng/ml, 0 otherwise) + 1.58
(albumin <3.5 g/dl, 0 otherwise) + 1.78 (1 if AST >60 IU/L, 0 otherwise)
NAFLD
NAFLD Fibrosis Score (NFS) (-1.675 + 0.037 x age (yr) + 0.094 x BMI (kg/m2) + 1.13 x IFG/diabetes (yes = 1, no = 0) + 0.99 x AST/ALT ratio - 0.013 x platelet count (x109/L) - 0.66 x albumin [g/dl])
BARD score (BMI ≥28
Steato TestTM ALT, A2M, ApoA1, haptoglobin, total bilirubin,
GGT, total cholesterol, TG, glucose, age, gender and BMI
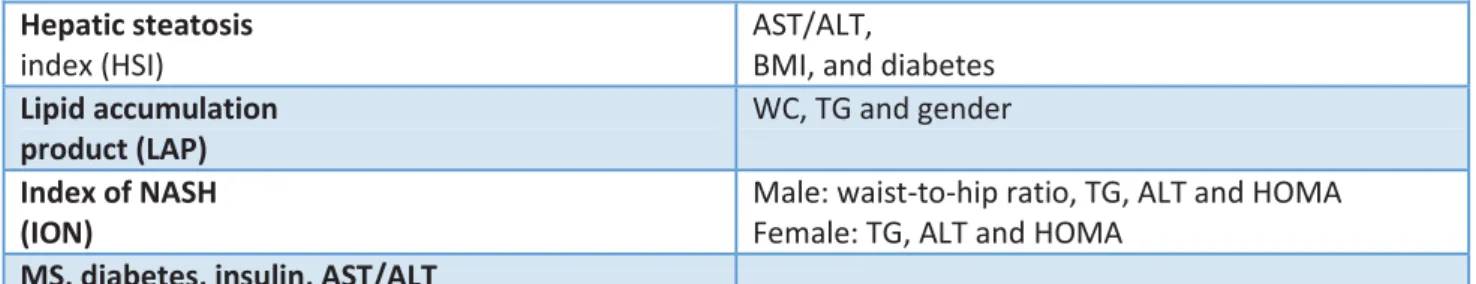
Hepatic steatosis
index (HSI)
AST/ALT,
BMI, and diabetes
Lipid accumulation product (LAP)
WC, TG and gender
Index of NASH (ION)
Male: waist-to-hip ratio, TG, ALT and HOMA Female: TG, ALT and HOMA
MS, diabetes, insulin, AST/ALT
Table 1: A2M a2-macroglobulin, ALD alcoholic liver disease, ALT alanine transaminase, AST aspartate
transaminase, ApoA1 apolipoprotein A-1, BMI body mass index, CHB chronic hepatitis B, CHC chronic hepatitis C, CLD chronic liver disease, GGT gamma-glutamyl transferase, LB liver biopsy, MRS magnetic resonance spectroscopy, MS metabolic syndrome, SLD suspected liver disease, TG triglycerides, US ultrasonography, WC waist circumference [71]
Several multi-parameter scores that combine direct and/or indirect serum markers were evaluated and some of these are commercially available. APRI (AST/platelet) and FibroTestTM have been studied the most. Two meta-analyses, which included 8,739 and 4,266 patients with chronic hepatitis C virus, reported good accuracy (> 80%) for the APRI in diagnosing significant fibrosis, but poor accuracy for the diagnosis of intermediate stages of fibrosis [67, 68]. APRI shows less diagnostic accuracy in the liver fibrosis stages caused by chronic HBV infection. The FibroTestTM consists of a combination of indirect markers. A meta-analysis that evaluated the diagnostic performance of FibroTestTM showed good diagnostic accuracy (> 80%) in diagnosing significant fibrosis (F METAVIR> 2) and liver cirrhosis (F = 4) in patients with chronic liver disease [69]. A study that included 1,307 patients with a viral infection (HCV 913, 284 HBV, HIV 110) and prospectively compared the FibroTestTM, Fibrometer, Hepascore and APRI, showed no significant difference between the various diagnostic methods in the diagnosis of significant fibrosis (AUROC 0.72- 0.78) and liver cirrhosis (AUROC 0.77-0.86) [70]. Several algorithms using a combination of serological markers to optimise the staging of liver fibrosis were evaluated. In a study that included 2,035 patients with chronic liver disease, the use of a sequential combination of APRI and FibroTestTM (SAFE biopsy) led to a reduction of 47% in the biopsies for diagnosing significant fibrosis and 82% in the diagnosis of cirrhosis of the liver [70]. Other combinations of algorithms, such as Fibropaca (a simultaneous combination of FibroTestTM, APRI and Forns-Index) and Leroy
(a simultaneous combination of APRI and FibroTestTM) showed comparable results in patients with HCV-related chronic liver disease.
LLIVER STIFFNESS IMAGING TECHNIQUES
Liver elasticity-based imaging techniques are divided into ultrasound-based techniques and 3-D magnetic resonance (MR) elastography [71].
Ultrasound elastography can currently be performed by different techniques, which are based on two physical principles: strain displacement/imaging and shear-wave imaging and quantification. Both strain elastography and SWE require mechanical excitation of tissue by manual compression (or cardiovascular pulsation and respiration), by the use of acoustic radiation force impulse (ARFI), or by a controlled external vibration. Strain elastography looks at the distribution of strain (measurement of tissue deformation) within a specified region of interest. SWE monitors the propagation of shear waves in tissues. The underlying principle for several, although not all, US-based techniques is that the velocity of a shear wave propagating through the liver is proportional to liver stiffness represented by the equation for Young’ s elastic modulus E (E=3rv2), where v is shear velocity and r is tissue density, assumed to be constant. Shear waves propagate faster in stiffer tissue.
Figure 1: Principle of elastography methods [72]
P
Physical principles
Shear waves are transverse (i.e. the particle movement is across the direction of travel, as occurs in the ripples of a water surface when it is disturbed); they are rapidly attenuated by tissue; they travel slowly (between 1 and 10 m/s) and are not supported by low viscosity liquids. Their speed is related to Young’s modulus of elasticity. Shear waves are produced by any mechanical disturbance and occur naturally from muscular movements (voluntary, cardiac etc.) as well as being induced by the ultrasound systems used to measure their speed.
x Point shear-wave elastography (pSWE): a small measurement box (usually 5x10mm) is set up within the tissue and readings made of the shear-wave speed.
x 2-D shear-wave elastography: there are multiple sequential pushing and measurement points, so that a single static SWE image may be built up and displayed as a colour-coded map of the shear-wave speed which is quantitative (a ROI gives the readouts).
x Another form of elastography that is currently available also uses ARFI, but any shear wave generated is ignored and instead the amplitude of the displacement generated in the vicinity of the pushing beam’s focus is displayed and used as a surrogate for the inverse of Young’s modulus. Such displacement lasts only milliseconds and an image must be built slowly from multiple positions of the pushing focus, producing a qualitative static elastogram [73]. A dynamic force is mandatory for generating a shear wave. Elastography methods are divided into quasi-static methods and dynamic methods. When an ultrasound transducer is used to displace the tissue surface, this is referred to as quasi-static compression. It is caused by manual compression and decompression.
In dynamic methods an acoustic radiation force impulse induced by a high-energy ultrasound beam creates a shear wave or elasticity measured indirectly in kPa.
Ultrasound uses elastography images to observe the tissue deformation determined by shear waves. Pressure on the tissue surface causes a variation in density, and the perturbations generated travel together as a longitudinal wave. The longitudinal wave velocity cl (about 1540ms-1) is determined almost entirely by the density ρ of the tissue and the elasticity of compression modulus K. In an ideal situation (an elastically homogeneous medium of infinite spatial extent) the (transverse) shear-wave propagation speed cs is determined by ρ and the shear elastic modulus G. Because in soft tissues G is much smaller than K, shear waves travel about 1,000 times slower than longitudinal waves, typically in the range 1 – 10ms1. Unlike longitudinal waves, ultrasonic shear-wave frequencies are attenuated rapidly in soft tissue. Hence very low frequencies, often below 1 kHz
(which includes static deformations), must be used for elastography. Moreover, non-viscous pure fluids do not propagate shear waves [73].
All current commercial elastography systems need to measure shear-wave tissue displacement. The various systems differ in how the displacement is used; it may be measured directly, converted to strain, or used to detect the time of arrival of shear waves and hence their speed.
Measurements of the shear modulus G and its close relative Young’s modulus E may be made non-invasively, if one can monitor the displacements of the tissue elements as a function of time as a shear wave passes multiple points along its path. For example, in TE and SWE, G is obtained from shear-wave speed measured as the difference in shear-wave arrival time at two or more points separated by known distances. In addition, both the percentage deformation (known as strain) and the displacement generated are directly dependent on the value of G for a given force, and both have been employed, in different elastography techniques, to display shear modulus contrast of tissues [73].
Q
Quasi-static method
In quasi-static strain imaging, axial and lateral tracking is applied between each pair of RF-echo frames and the lateral displacements are discarded leaving a sequence of axial displacement images. Each axial displacement image is then converted into a strain image by passing a moving window (the strain-estimation window) down each image line, to calculate the local axial gradient of displacement at each window position. The size of the strain-estimation window is chosen as a compromise between strain image resolution (small window) and good strain signal-to-noise ratio [73].
Dynamic methods
Dynamic methods also use the tissue displacement estimation techniques employed in SE but differ in the method of applying the force or in the way that displacement is used. The localised displacement induced by a focused acoustic radiation force impulse may be displayed directly.
Alternatively, propagation of a transient displacement may be used to determine shear-wave speed. The dynamic nature of the force is essential in both cases.
Acoustic radiation force can create a localised displacement of a few microns in the ultrasound axial direction, which decays in a few ms [74]. Sufficient force for this purpose can be generated with a standard ultrasound scanner at depths of many centimetres by a sequence of rapid bursts of long focused ultrasound pulses [75]. The displacement is measured at a known time after cessation of the push using RF-echo tracking, and displayed as a qualitative elastogram within a small box [76].
Transient elastography employs a brief push (a small “thump”) applied with an automated movement of the ultrasound transducer, which acts like a piston at the skin surface. The shear wave arises from the edge of the piston. A component of the wave converges on the ultrasound axis and after some distance travels down the axis at a speed close to the shear-wave speed. The shear displacement and depth is then measured using 1D correlation tracking methods, and the speed of the wave obtained from a displacement M-mode as the slope of a straight line. A special algorithm rejects displacement M-modes that are not linear enough. The shear-wave speed can be converted to a Young’s modulus value using the relation E=3 ρcs 2, and the measurement given in kPa.
The system lacks 2D image guidance of the measurement, and it is not possible to propagate the shear wave beyond fluid collections (ascites). It may be difficult to obtain sufficient signals in obese patients with the standard probe (3.5 MHz, 2mm vibration amplitude), although the failure rate has been reduced by the introduction of a dedicated XL probe (2.5 MHz, 3mm vibration amplitude). On the other hand, the use of the ribs for support when generating the intercostal transient shear wave limits the amount of prestress, which can be a confounding factor in elastography.
The transient surface displacement is also tightly controlled, as a single-cycle of a 50Hz wave. This is expected to help reproducibility of the measurements because tissue elasticity and hence
shear-acoustic radiation force, it is relatively easy to keep the ultrasound thermal and mechanical indices low.
SWE can be used to produce two- or three-dimensional quantitative images of shear-wave speed with a useful field of view (2D SWE or 3D SWE).
The acoustic radiation force focus is swept down the acoustic axis, so as to generate tissue displacements. This produces a shear wave in the shape of a cone with a shallow angle (and hence almost cylindrical), known as a Mach cone, that travels away from the push line, which spreads less and thus decays less rapidly with distance than that from a single pushing focus. An ultrafast scanner achieves an ultrasound frame rate of up to 20 kHz by transmitting a plane wave and focusing only on receive, so that each ultrasound echo image is created with a single transmit pulse. This high frame rate allows the shear waves to be followed in real time in 2D, and RF-echo tracking over a grid of points produces a displacement movie and small map of shear-wave time-of-arrival can be created. The process is repeated for a number of different push lines to create a final quantitative elasticity image in a box, which is presented as a colour overlay on the B-mode image in units of ms-1, or converted to Young’s modulus in kPa as for TE [77, 78]. The maximum size of the elastogram box is approximately 2–3 cm of side length with a linear transducer, and 9 x 4 cm with a convex transducer. Thus the system uses three frame rates: the standard B-mode echo image, a hidden ultrafast echo image used to track the displacement, and the shear-wave elastogram.
TRANSIENT ELASTOGRAPHY
This is a one-dimensional ultrasonographic method that relies on the FibroscanTM (Echosens, Paris, France) device, which measures the velocity of an ultrasound wave at low frequency (50 Hz) propagating through the liver. This speed is directly related to tissue stiffness.
TE was the first ultrasound-based elastographic technique for the liver, introduced in 2003, and has the largest body of evidence.
FibroscanTM measurements are performed with the patient in the supine position; the probe is placed on the skin surface in a lateral position using a right intercostal approach (usually between the 9th and 11th intercostal spaces). The operator then presses the button located on the probe to perform the measurement. Liver stiffness measurement is performed in a cylinder approximately 1 cm wide by 4 cm in length at between 25 and 65 cm beneath the surface of the skin. The software determines whether the measurement was successful, and if so, the machine does not show a value on the display. The result is considered valid if ten valid measurements are performed: if the success rate (success rate, ratio of valid measurements and total number of measurements) is above 60%; if the interquartile range (IQR that reflects the variability of measurements) is less than 30% of the median (M) of the measurements (IQR/M <0.30%).
The results are expressed in kiloPascals (kPa) and vary between 1.5 and 75 kPa, with normal values around 7 kPa, and higher values in men and patients with low or high body mass index (body mass index, BMI) [79,80]. The advantages of FibroscanTM are the speed of the procedure, the ability to have immediate results, and the possibility of testing both at the patient's bedside or in the clinic. It is also simple to use and can be performed by a nurse or technician after training. Nevertheless, FibroscanTM results must be interpreted according to the patient's clinical presentation, hepatopathy aetiology and laboratory parameters. Although the FibroscanTM has excellent inter- and intra-observer concordance (with an intra-class correlation coefficient of 0.98) [81,82], its accuracy is
lower in patients with higher transaminase levels. In the large case reported (13,369 examinations) [83], it was impossible to obtain a measurement result in 3.1% of cases, and in 15.8% of cases the results were not reliable (did not obtain the reliability criteria recommended by the manufacturer), mainly due to patient obesity or limited operator experience. Similar results were obtained in another study of 3,206 patients with a failure rate of 2.7% in measurements and an unreliability percentage of 11.6% [84].
Among the other parameters, IQR/M (Interquartile Range/Median) less than 30% has been suggested by the manufacturer to be the most important [85]. In one study [86] conducted on 1,165 patients, 798 of whom suffering from HCV-related chronic liver disease in which liver biopsy was used as the gold standard, in the multivariate analysis reliability of the results was tied to IQR/M increased to 30% and to liver stiffness measurement. It was observed that liver stiffness measurements higher than 7 kPa and IQR/M greater than 30% were associated with lower reliability of the results. However, higher reliability was observed in the group of patients with IQR/M lower than 30% regardless of the outcome of liver fibrosis. In order to reduce the number of patients with unreliable results due to obesity, a new probe was developed (XL, with 2.5 MHz transducer), enabling liver stiffness measurements at a depth between 35 and 75 mm [87, 88 89]. One study [89] conducted on 275 patients with chronic liver diseases (viral hepatitis 42%, 46% NAFLD) and BMI greater than 28 kg/m2, showed that failure in obtaining results was less frequent when they used the XL probe, compared with the standard M probe (1.1% vs 16%; p <0.00005). The study showed that unreliable results decreased with the XL probe in 25% of cases compared to 50% of cases with the M probe (p <0.00005) and the values obtained with the XL probe were lower than those obtained with the M probe.
FibroscanTM results are also difficult to obtain in patients with narrow intercostal spaces and almost impossible in patients with ascites [90]. Moreover, inflammation, extrahepatic cholestasis or congestion can interfere with liver stiffness measurements. Confounding effects that can lead to
of congestive heart failure and food intake. For this reason, FibroscanTM measurements should always be carried out with the patient having fasted for at least 2 hours [91-92-93-94]. The influence of steatosis on the results of FibroscanTM measurements is still under debate. Although some studies have shown that there is a correlation between the degree of steatosis and liver stiffness levels measured by FibroscanTM [95], more recent studies have denied this correlation [96, 97]. The FibroscanTM was initially validated for the assessment of patients with HCV-related chronic liver disease. Subsequent investigations that have been conducted have validated this method for other chronic liver diseases. In HCV in chronic liver disease, levels greater than 6.8-7.6 kPa liver stiffness are related to the presence of significant fibrosis (F2). The cut-off values that predict the presence of cirrhosis are between 11.8 and 13.3 kPa [98,99,100,101].
With regard to chronic HBV-related liver disease a study of 202 patients showed cut-off values of 7.2 and 11 kPa, respectively, for significant fibrosis and cirrhosis [102]. The areas under the curve were respectively 0.81 and 0.93 for significant fibrosis and cirrhosis of the liver. A study conducted on 140 patients with HBV-related liver disease and 317 patients with HCV-related liver disease [103] showed a higher correlation in patients with chronic HCV-related liver disease: r = 0.578 vs r = 0.408 (p = 0.02). The average stiffness values of the liver measured by FibroscanTM are similar for each stage of fibrosis in patients with chronic hepatitis B and C. However, a further study [104] conducted on 202 patients with chronic hepatitis C and 363 with chronic hepatitis B showed the same accuracy, sensitivity and specificity, and predictive value in patients with chronic hepatitis B and C. A study in an Asian population [105] showed that FibroscanTM-measured liver stiffness results were not affected by transaminase levels, while other studies showed a correlation [90]. In the studies conducted up to now, FibroscanTM results have not been accurate in differentiating between contiguous stages of fibrosis (especially in the F1 and F2 stages) but have shown greater sensitivity in differentiating between the absence of significant fibrosis and fibrosis and between significant fibrosis and cirrhosis. A meta-analysis showed a cut-off value of 7.6 kPa (AUROC average of 0.84) for significant fibrosis and an optimum cut-off value of 13 kPa (0.94 AUROC
average) for cirrhosis [98]. In a further meta-analysis, the optimum cut-off values were 7.3 kPa and 15 kPa for significant fibrosis and cirrhosis, respectively [106].
In chronic alcohol-based liver disease, there is coexistence with inflammation and fibrosis can affect the liver stiffness results measured by FibroscanTM. Several studies have found higher cut-off levels, compared to those seen in patients with viral hepatitis for the diagnosis of cirrhosis (19.5 kPa, 22.6 kPa) [107]. However, in these studies the patients enrolled had elevated transaminase levels. A study of patients with alcoholic hepatitis showed that liver stiffness levels measured by FibroscanTM decreased with the reduction in transaminases [108]. A greater decrease was observed in particular with the reduction in AST and no significant increase in liver stiffness was observed for values of AST levels <100 U/L.
Several studies have shown that the FibroscanTM is considered an important tool in assessing the severity of C virus recovery in patients undergoing liver transplantation [109].
The FibroscanTM was also tested to evaluate complications of liver cirrhosis like portal hypertension. For the evaluation of portal hypertension the invasive detection of the hepatic venous pressure gradient (HVPG) remains the gold standard. A value greater than 10 mmHg can indicate the presence of clinically significant portal hypertension and a value higher than 12 mmHg may indicate the risk of bleeding from oesophageal varices [110]. In this study, the ROC curves for predicting portal hypertension were 0.945 with cut-off values of between 13.6 kPa and 21 kPa. Furthermore, the study observed greater correlation of the FibroscanTM measurements when HVPG measurement was less than 12 mmHg. Another study evaluated 100 patients with chronic liver disease performing HVPG and FibroscanTM measurements on the same day and following them up for the next two years. The study results showed that FibroscanTM measurement had similar accuracy to HVPG measurement in assessing the presence of portal hypertension (AUROC 0.830 vs 0.845) [111]. The cut-off proposed for estimating the presence of oesophageal varices in the various studies performed varied between 19.8 kPa and 47.5 kPa (AUROC 0.72-0.78) [112, 113]. A
further study showed different cut-off values in order to estimate the presence of oesophageal varices depending on the aetiology [114].
A
ACOUSTIC RADIATION FORCE IMPULSE (ARFI)
The acoustic radiation force impulse is a phenomenon associated with the propagation of acoustic waves in a medium of attenuation. The ARFI system is integrated within a conventional ultrasound, and the region of interest (ROI) for elastography measurement can be chosen under the B-mode vision. The tissue is stressed using an acoustic pulse that propagates through it. The energy transferred to the tissue by the acoustic impulse generates a deformation of the tissue itself. Soft tissues are more elastic and deform more than a rigid tissue whose deformability is lower. The deformation associated with the propagation of an ultrasonic pulse is then followed by a relaxation process, after which the tissue returns to its original position. ARFI elastography is used in the Siemens Acuson S2000TM Ultrasound (Siemens AG, Erlangen, Germany) with a 4CI probe. The same principle is present in the Philips EPIQTM, Samsung, Hitachi and Esaote ultrasound systems. Results are expressed in metres per second (m/s). Like TE, this method gives better diagnostic results for liver cirrhosis and for the diagnosis of significant fibrosis. A meta-analysis that included 518 patients [115] with chronic liver disease (83% with chronic liver disease on a viral base) showed an AUROC value of 0.87 for the diagnosis of significant fibrosis, 0.91 for severe fibrosis and 0.93 for liver cirrhosis.
In another meta-analysis that included 36 studies (21 articles and 15 abstracts) for a total of 3,951 patients a value of 0.84 AUROCs was obtained and 0.91 for the diagnosis of significant fibrosis, severe fibrosis and liver cirrhosis, respectively [116]. The cut-off values suggested by the two meta-analyses were 1.34 to 1.35 m/s, 1.55-1.61 m/s, and 1.80-1.87 m/s for the diagnosis of significant fibrosis, severe fibrosis and liver cirrhosis, respectively. Studies comparing the two methods, FibroscanTM and ARFI, showed conflicting results. A recent meta-analysis [117] which included 13 studies with a total of 1,163 patients (11 articles and 2 abstracts) did not observe a significant
difference between the diagnostic reliability of ARFI and FibroscanTM. For the diagnosis of significant fibrosis, sensitivity and specificity were 0.74 and 0.83 for the ARFI, and 0.78 and 0.84 for the FibroscanTM, respectively. For liver cirrhosis diagnosis, sensitivity and specificity were 0.87 and 0.87 for the ARFI and 0.89 and 0.87 for the FibroscanTM, respectively. Reliable measurements were obtained in more patients with the ARFI system rather than with the FibroscanTM (98% versus 93%, respectively, P <0.001).
R
REAL TIME SHEAR-WAVE ELASTOGRAPHY
Real-time shear-wave elastography is performed using the AixplorerTM ultrasound system (SuperSonic Imagine S.A., Aix-en-Provence, France) with a convex probe (SC6-1) and it is also included in the GE and Toshiba ultrasound systems. In this method ultrasonic waves are created in the tissue by the radiant acoustic force generated by focused ultrasonic pulses. Ultrasonic waves then propagate through a given tissue and speed is then estimated using Doppler acquisition. The velocity of the sound waves can be used to calculate tissue stiffness by the formula E = pc2, where E is tissue elasticity (in kilopascal, kPa), p is tissue density (kg/m3) and c is the velocity of the tissue ultrasound waves (m/s). The speed estimate is then encoded using a colorimetric system by creating a quantitative image of two-dimensional shear wave tissue stiffness that is shown in a box in conventional B-mode images. The size and position of the shear-wave image is determined by the operator by positioning a circular region of interest (ROI) within the B-mode image. In addition to the tissue stiffness expressed in kPa, mean and standard deviation are calculated for the region of interest.
The first study published on this method that was compared with TE showed good diagnostic accuracy (AUROC 0.94 for significant fibrosis, 0.96 for severe fibrosis and 0.96 for cirrhosis) [118]. Another study [119] proposed a cut-off for F≥2 7.4 kPa (AUROC 0.91), for F≥3 8.7 kPa (AUROC 0.99) and for F = 4 9.2 kPa (AUROC 0.97).
A
ASSOCIATION BETWEEN FIBROSCAN AND SERUM MARKERS
Several algorithms have been proposed in which a combination of FibroscanTM and serum markers must be used to evaluate liver fibrosis. An algorithm that considers FibroscanTM and FibroTestTM (Castera/Bordeaux algorithm) was evaluated in order to optimise non-invasive diagnosis in patients with chronic hepatitis C [120]. According to this algorithm, if both methods are in agreement, hepatic biopsy is not needed; if liver biopsy is differentiated it could be ………should be performed. The combination of other elastographic methods and serum markers could be equally useful. Using such algorithms, biopsies could be reduced by 50-70%.
Figure 2: Castera/Bordeaux algorithm
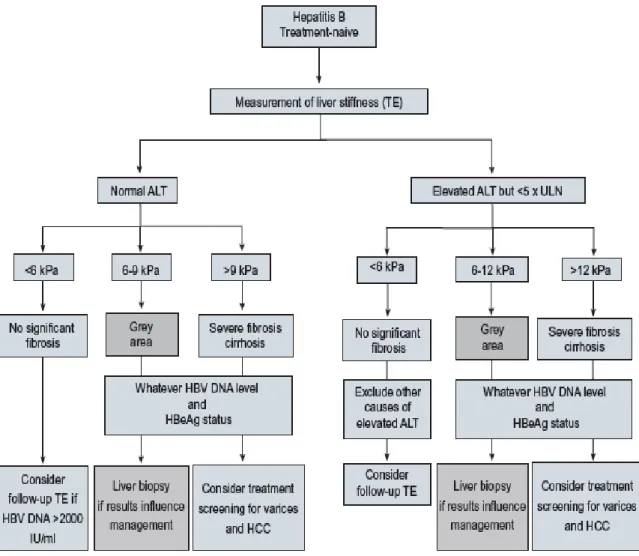
For patients with chronic Hepatitis B several algorithms were proposed [121-122]. The proposed algorithm is summarised above in the EASL guidelines [73].
ARFI Fibroscan Supersonic Shear Imaging FIBROSCAN + FIBROTES Disagree FS > 7.1 kPa and FT < 0.48 (n 48) F < 7.1 kPa and FT > 0.48 (n 29) FS failure (n 8) Agree FS > 7.1 kPa and FT < 0.48 (n 87) FS > 7.1 kPa and FT > 0.48 (n 129) APRI ELF FibroTest HOMA-IR Forns-Index
Figure 3: Algorithm in chronic Hepatitis B
P
PROGNOSTIC VALUE OF NON-INVASIVE TESTS
Shear-wave elastography and serum markers have shown good results in several studies in detecting the presence or bleeding of oesophageal varices by associating elastographic measurement, spleen size and platelet count. Recently it has been shown that splenic stiffness measured by shear-wave elastography has shown a better association with hepatic venous pressure, varicose veins and varicose veins and bleeding [123-124].
Several studies have shown an increased risk of developing hepatocellular carcinoma (HCC) in patients with chronic viral hepatitis with high FibroscanTM values. A recent study with 1,555 patients with chronic hepatitis B showed that FibroscanTM score improved the diagnosis of HCC.
Using a cut-off value of 11, FibroscanTM was able to exclude HCC development at 5 years with a high predictive value of 99-100% negative [125].
In a prospective study involving 1,457 patients with chronic hepatitis C, all patients underwent on the same day liver biopsy, FibroscanTM measurement and FibroTestTM, with FIB-4 and APRI serum markers at zero time and during a five-year follow-up. Patients with METAVIR score F3/F4 had a lower five-year survival rate compared to METAVIR F0/F2 patients. Similar results were obtained using FibroscanTM: patients with FibroscanTM values <9 and greater than 9.5 kPa had a 5 year survival rate of 77% and 96%, respectively. Patients with FibroTestTM values greater than 0.95 kPa had a five-year survival rate of 0%, while patients with FibroTestTM values below 0.75 kPa had a survival rate of 97%.
Comparable results were obtained in a study that combined FibroscanTM and FibroTestTM to evaluate five-year survival in patients with chronic Hepatitis B [126-127].
P
PORTAL HYPERTENSION
Portal hypertension is haemodynamically defined by an increase in the venous pressure gradient across the liver, calculated from its inflow through the portal vein versus its outflow through the hepatic veins. An increase in resistance to portal blood flow is the initial factor that leads to a rise in portal pressure. This resistance can be located at any point in the liver circulation, i.e. at the prehepatic, intrahepatic or post-hepatic level. In the Western world, 90% of cases of PH are due to advanced chronic liver disease (ACLD) or cirrhosis, which cause structural damage through fibrogenesis, parenchymal extinction and regeneration. PH then develops at the intrahepatic sinusoidal site. Other less common causes include vascular liver diseases, such as extrahepatic portal vein obstruction, thrombosis of the hepatic veins (Budd-Chiari syndrome, BCS) and idiopathic PH. Sinusoidal PH in patients with cirrhosis can be reliably and safely evaluated by measuring the hepatic venous pressure gradient (HVPG) via hepatic vein catheterization. An HVPG of up to 5 mmHg is considered normal; subclinical PH is defined by an HVPG of 6–9 mmHg; and
an HVPGP10 mmHg represents the ‘clinically significant’ PH threshold.4 When HVPG reaches 10 mmHg or above, PH can become symptomatic as patients can develop gastroesophageal varices and hyperdynamic circulation, increasing their risk of clinical decompensation. Upper gastrointestinal endoscopy is the best method to determine the presence of oesophageal and gastric varices, and allows the identification of additional signs used to stratify bleeding risk.
Liver stiffness measurement (LSM) accurately reflects liver fibrosis in CLD.17 In patients with CLD, fibrosis is the major component of increased intrahepatic vascular resistance leading to PH (as discussed above). Therefore, LSM has been studied as a possible surrogate for PH. The spleen undergoes parenchymal remodelling in patients with PH. This is partly attributable to passive congestion and increased arterial inflow, and partly because of increased hyperactive splenic lymphoid tissue and enhanced angiogenesis and fibrogenesis, leading to the progressive development of splenomegaly in most patients. Ultrasound studies showed that spleen vascular resistance (estimated by Doppler pulsatility and resistance indexes) is increased in patients with PH, and correlates with PH severity and complications. Spleen stiffness measurement (SSM) by ultrasound elastography could be an accurate non-invasive surrogate for PH, and devoid of the limitations of LSM. Studies comparing LSM and SSM (measured by TE in an adequate left intercostal space using technical conditions similar to those used for LSM) showed that the spleen is substantially stiffer than the liver in both healthy subjects and patients with chronic liver disease.
C
CONTROLLED ATTENUATION PARAMETER (CAP score)
Since ultrasound propagation is influenced by the presence of fat in the tissue, new software has been developed to quantify steatosis. This parameter is based on the ultrasonic properties of the radiofrequency signals that are retropropagated and acquired by FibroscanTM. It is called the Controlled Attenuation Parameter (CAP score) and is generated by a process based on vibration-controlled transient elastography (VCTE) [128-129]. The CAP measures the degree of ultrasound
attenuation by hepatic fat at the central frequency of the FibroscanTM M probe (3.5 MHz). Results are expressed in decibels per metre (dB/m).
Several studies reported that the CAP correlated fairly well with biopsy proven steatosis and significantly differentiated between S0, S1 and S2 patients. However, a significant difference could not be detected in subjects with advanced disease (S2–S3) [130-131].
Cut-off values vary from one study to another, but the cut-off values associated with significant steatosis (33% of hepatocytes) was almost always 250 dB/m. [132].
Another study reported that larger skin capsular distance (SCD), obesity and metabolic syndrome, when measuring CAP, may cause overestimation of steatosis [133-134-135-136-137]. A CAP algorithm for the FibroscanTM XL probe, specifically designed for the obese population, is being developed [139]. A recent study on 324 patients with biopsy-proven NAFLD found that CAP, directly related to steatosis and obesity, is independently linked to increased liver stiffness (LS) values, especially in patients with lower stages of fibrosis. A higher rate of false-positive LS results for the assessment of fibrosis by TE in patients in the higher CAP tertiles was noticed. The study also proposed a flowchart based on both LS restuls and CAP score [140].
M
METHODOLOGY
AIMS & OBJECTIVES
1. To correlate liver stiffness assessed by the Philips EPIQ 7TM ultrasound system, Siemens Acuson (ARFI) ultrasound system, and Echosens FibroscanTM (currently the best-validated technique), and compare the results of these three imaging techniques with histological results in patients suffering from chronic liver disease with different aetiologies.
2. To determine cut-off values of the liver stiffness (LS) measurements that correlate with the histological fibrosis stage.
3. To detect variations in liver stiffness (LS) measurements correlated with different parameters: diagnostic blood tests
blood pressure
anthropometric parameters: body mass index (BMI)
4. To correlate CAP score with the histological results of liver biopsy.
STUDY DESIGN
This is an imaging study to compare the results of three imaging techniques (Philips Shear Wave Ultrasound, Siemens Acuson ARFI and Echosens FibroscanTM) with the clinical diagnostic results of liver biopsies.
100 patients were studied using the Philips Ultrasound System, Siemens ARFI Acuson and FibroscanTM immediately prior to the liver biopsy.
INCLUSION CRITERIA:
x Able and willing to provide written informed consent; x Aged between 18 and 75;
x About to undergo a liver biopsy as part of standard routine clinical care, or if a liver biopsy has already recently been performed, is willing to attend for a specific research visit for the three scans;
x Willing to consent to medical notes and diagnostic test results being reviewed, captured, and recorded by the clinical research study team.
E
EXCLUSION CRITERIA:
x Unable or unwilling to give written informed consent; x Aged under 18 or over 75;
x No evidence of liver disease; x Pregnancy;
S
STUDY PROCEDURES
Ethical Approval
The study was performed in accordance with the principles of the Declaration of Helsinki and its
appendices and with local and national laws. Project-specific ethical approval was
successfully obtained on 3 December 2015 from the London City & East NRES Committee (REC reference 15/EE/0420). Full local Trust R&D approval was given on 3 March 2016 (Joint Research Compliance Office Reference N° 187875). This study was adopted as an NIHR CRN Portfolio study on 7 March 2016. Written informed consent was obtained from all patients.
ElastPQ
The Philips system EPIQ 7TM uses the C5- I Pure Waves transducer. Results can be displayed in m/s or in kPa. Fail-safe mode reduces false reading. The maximum penetration depth of ElastPQ was 8 cm and the region of interest (ROI) size measurement was depth dependent with 0.5 cm-1.5 cm at the depth of 4 cm. The ROI measurement and quantitative value of liver stiffness was displayed over a B-mode ultrasound image.
![Figure 1: Principle of elastography methods [72]](https://thumb-eu.123doks.com/thumbv2/123dokorg/8366509.135000/26.892.88.810.95.738/figure-principle-of-elastography-methods.webp)
![Table 2: Types of elastography [73]](https://thumb-eu.123doks.com/thumbv2/123dokorg/8366509.135000/31.892.95.803.105.939/table-types-of-elastography.webp)