Beyond
the Short Term
A Study of Past Productivity’s Trends
and an Evaluation of Future Ones
Jean-Paul Fitoussi
Robert J. Gordon
Stefano Micossi
Luigi Paganetto
Paola Parascandolo
Fabrizio Patriarca
Edmund S. Phelps
Fabrizia Peirce
Christopher Pissarides
Francesco Saraceno
Etienne Wasmer
LIGEPLUISS INTERNATIONAL GROUP ON ECONOMIC POLICYBeyond the Short Term
A Study of Past Productivity’s Trends
and an Evaluation of Future Ones
LIGEP
LUISS
INTERNATIONAL
GROUP
ON
ECONOMIC
POLICY
Edmund S. Phelps
Fabrizia Peirce
Christopher Pissarides
Francesco Saraceno
Etienne Wasmer
Robert J. Gordon
Stefano Micossi
Luigi Paganetto
Paola Parascandolo
Fabrizio Patriarca
Jean-Paul Fitoussi
ISBN 978-88-6105-162-1
Luiss University Press – Pola s.r.l. Viale Pola, 12 00198 Roma tel. 06 85225485 fax 06 85225236 www.luissuniversitypress.it e-mail [email protected]
This is the second report to be issued by a group of international economists brought together under the auspices of LUISS. LIGEP stands for LUISS International Group on Economic Policy. Its mandate was to consider problems of economic policy in the aftermath of the Global Crisis in the World, Europe and Italy.
The discontinuity brought over by the Great Recession and the economic problems of our time are putting into question our past knowledge, the tool kit which has become common to a vast majority of scholars. It is time to review what we really know and the degree of confidence we attach to it. Even if what we knew were more robust than this unexpected event would make us to believe, it should not di-spense us to assess the state of the art and to form new hypothesis, to venture new explanations. We have attempted to do that in our first report entitled After the Crisis, the Way Ahead.
In this second report, we take a long term view of the problem, in the light of the study of past pro-ductivity trends, in order to understand what could be the determinants of future growth, and especially of future productivity growth. Are we going back to past trend or rather are we evolving towards a “new normal”? Are there policy actions which could prepare for a better future?
The rule governing the functioning of the group is not unanimity, but vivid debates and persuasion. We want to come with strong conclusions but we also want that each of us endorses these conclusions. That is why the different contributions are not identified and the report collectively authored. For that to be achieved one of us was in charge of the last say. I thank very much all the members of the group for having given me this responsibility.
This report would not have been possible without the confidence and even the enthusiasm of both Massimo Egidi, the rector of LUISS, and Emma Macegaglia, the President of the University. From the outset they encouraged me to proceed, and gave to the group all the means it needed to achieve its aim. We are conscious of what we owe to them.
We have benefited from excellent research assistance by Fabrizio Patriarca, so excellent indeed that I decided to put him as a co-author of this report. Antra Bhat has been of great help to harmonize the English text.
Our special thanks are for the team of organizers: Laura Arrighi, Maria Silvia Ciola, and Maria Sole Micali. They have done a superb job to facilitate our work and to organize our meetings.
Last but not least, Corinne Allouch worked intensively to make up in a few days the final version of the report.
Introduction ... p. 9 Chapter 1
Productivity: basic Concepts, Historical Context, and Current Puzzles ... “ 19
1.1. Introduction ... “ 19
1.2. Definitions: Output per capita and Productivity are almost the same thing, but not quite ... “ 21
1.3. Alternating Intervals of Advantage and Disadvantage: the Contrasting History of Growth in the US and the EU-15 since 1960 ... “ 22
1.4. Explanations for the Overall Patterns in the Data: A Concise History ... “ 26
1.5. The headwinds that will slow Productivity Growth on both sides of the Atlantic ... “ 32
Chapter 2 The Sources of Productivity Growth ... “ 35
2.1. Introduction ... “ 35
2.2. The Role of Multi Factor Productivity ... “ 37
2.3. Europe’s Productivity Problem in Market Services ... “ 42
2.4. The Role of Culture and Institutions in the European problem of slow Productivity Growth ... “ 47
Chapter 3 Innovations ... “ 51
3.1. Introduction ... “ 51
3.2. R&D Investments and GDP ... “ 51
3.3. Innovation, Incentives, and Institutions in the US and Europe ... “ 55
3.4. Innovation, energy and environmental policies ... “ 58
Chapter 4 Productivity and the public sector ... “ 61
4.1. Introduction ... “ 61 4.2. Public investment ... “ 63 4.3. Human Capital ... “ 65 4.4. Institutions ... “ 66 4.5. Policy Prescriptions ... “ 68 Chapter 5 Growth and Productivity in the Italian Economy ... “ 69
5.1. Introduction ... “ 69
5.2. The Productivity Performance in Italy ... “ 71
5.2.1. The Role of the Service Sector ... “ 73
5.3. The Malfunctioning of Labour Market ... “ 74
5.3.1. Employment rate ... “ 76
5.3.2. Dualism in labour market ... “ 80
5.4. Human Capital and Educational System in Italy ... “ 84
5.4.1. The Italian higher education system can perform better ... “ 85
5.4.2 Granting universities more autonomy ... “ 89
5.5. Spreading Innovation into the Economy ... “ 89
5.6. Reforms to Foster Growth Rapidly ... “ 91
5.6.1 Rethinking industrial policy ... “ 91
5.6.2 Promoting competition among service providers especially in broadband and energy sectors ... “ 92
5.6.3 Reducing administrative burdens on businesses ... “ 93
5.6.4 Fully implementing Single Market legislation, in particular the services directive ... “ 94
Appendix Exit strategies in the labor market ... “ 99
Introduction
The world economy is struggling since 2008 to emerge from a crisis that has no precedent since the 1930s. The Luiss International Group on Economic Policy (LIGEP) has given, in 2010, its own assessment of the crisis. We warned that besides the policies needed to contrast the cyclical downturn, a serious effort was also needed to understand, and to address, the structural weaknesses that may impede future growth. The present volume is a first attempt at this understanding, by focusing on the ways to durably improve the capacity of the economy, and in particular of the European Union economy, to grow in a sustainable way. While there is much more in sustainable growth than just output and income, this report focuses on productivity and technical progress, one of the most evident sources of divergence in performance between the EU and the United States. In this report we step back and take a longer and broader view of productivity behaviour. If productivity drives output, what drives productivity? Why do the developed nations differ so much in their productivity performance? It is fairly easy to understand rapid productivity growth in many of the emerging economies as a process of catching up by importing capital and adopting technologies previously developed by OECD countries. It is harder to analyse the behaviour of countries, like the US, the EU-15, and Japan which have long operated close to the frontier of existing knowledge and technology.
How then can we explain that since the mid-1990s Western Europe experienced a substantially lo-wer productivity growth than the United States? For most EU countries the fall in productivity growth beyond US levels is usually traced to lower human capital accumulation, and a wealth of reasons going from rigidity in the labour and product markets to cultural attitude and faulty regulations. The crisis is further deepening the gap: the United States are since 2010 on a path of recovery (however unsteady and fragile it may be), while the EU has been stuck in a sovereign debt and banking crisis that substantially decreases public and private investment, and hence hampers the future potential for growth.
A casual look at the data reveals nevertheless that there is nothing ineluctable behind this divergence. For the entire post-war period, up to 1995, productivity in Western Europe grew faster than in the US; therefore, the report sets as its first objective the understanding of the reasons behind the turnaround of the mid 1990s and of the strengths and weaknesses of each “model”. Most explanations start from the leading role of the United States in the Information and Communication Technology (ICT) revolution. But the report takes the stance that what is actually more important are differences in the effectiveness with which computers, the internet, and the web have been embedded in the production processes of the industries using these innovations, particularly retail and wholesale trade and other marketed services.
The report reaches two conclusions that stand somewhat apart from the current literature. The first is that the success of the US in maintaining high productivity growth derives from a complex set of interacting factors, which go well beyond simple market deregulation. In particular, we document how the role of policy has been paramount. Ironically, for a country that has been suspicious of government involvement in the private economy, it is the United States that appears to demonstrate the closest links between government policy and technological leadership. Examples may go back to the nineteenth centu-ry, when land grants to railroads companies promoted the building of infrastructures. In the modern era, research support from the National Institutes of Health and the National Science Foundation are credited with post-war American leadership in pharmaceuticals and biomedical research, as well as basic research in sciences. Defence-funded research and government-funded grants have presided over the early emer-gence of American leadership in semiconductors, computers, software, biotech, and the Internet itself. Government antitrust policy is credited to the emergence of a software industry largely independent of computer hardware manufacturers. Last, but not least, the report stresses the role of educational policies,
where several sources of systemic US advantage stand out, most notably the mixed system of government- and private-funded research universities, the important role of US government agencies providing rese-arch funding based on a criterion of peer review, and the strong position in a worldwide perspective of US business schools and US-owned investment banking, accounting, and management-consulting firms. On this latter point, often invoked in the debate, so often indeed that it has become a cliché, the matter is far from clear. The finance models taught in these schools bear some responsibility in the financial crisis on the one hand, and on the other, it is difficult to consider that the shadow banking system has been so successful. The productivity in the US financial system seems rather to have been strongly over valuated.
Another factor which may explain the European lag in productivity is the peculiar constitution of Eu-rope which has impeded the use of policy instruments like industrial and exchange rate policies and limi-ted the use of traditional macroeconomic policy’s instruments. That the design of European institutions has fatal flaws is becoming more and more apparent in the context of the sovereign debt crisis. The conse-quence of the fiscal compact on productivity growth, for example, can’t be but negative as it is increasing the balance sheet recession of the private sector and reducing the capacity of the public sector to invest.
While emphasizing the role of policy in a broad sense in providing an innovation-friendly envi-ronment, the report also warns against the temptation to generalize, pointing out how the appropriate policies vary according to the sector, the country, or even the time period. For what concerns innovation and productivity growth, as most other domains in economics, one-size-does-not-fit-all. This is what makes skilful institution building and policy implementation necessary conditions for sustained growth.
The second main conclusion of the report is that it is necessary to avoid a one-sided critique of Europe and praise of the United States. There is a lot we do not know about the causes of productivity growth, and what we think we know depends on metrics on which we have faint confidence. Multifactor produc-tivity is rather a measure of our ignorance and it is affected by a myriad of variables, so many that we have an identification problem.
Besides, a number of factors point to a future slowdown of productivity growth in both areas, in-cluding the demographic effect of an ageing population, the effects of globalization in draining away previously high-paying jobs in manufacturing and other sectors, and the effects of the post-2007 world financial crisis that is leaving consumers, banks, and governments burdened with excess debt. Europe also shares with the US the most serious threat of all, coming from the nature of innovation itself. While the process of invention and innovation is clearly not dying out, it is becoming increasingly unlikely that future innovation will have the effect of the previous Great Inventions. In other words, we do not know where and when would emerge the third industrial revolution.
Some factors, on the other hand, point to a future disadvantage of the United States: the effect of ri-sing inequality is making the average growth rate of income in the US for the entire economy exceeds that of the “bottom 99%” by a substantial margin. There is thus an increasing gap between growth per capita and whatever measure of well-being we could design. This is a clear indication that the US growth regime is not sustainable. Another headwind holding back the US more than Europe is its poorly performing secondary education system and rampant cost inflation in higher education that is in part the cause of a steady decline in the US ranking in international league tables of college completion. Also the US is far behind Europe in implementing policies to cope with global warming, and promoting green growth, that may be, in the future, important sources of technological advances and productivity increases.
the report is structured as follows
The first chapter elicits the basic concepts and describes the relationship between output per capita and productivity since 1960, and then, in more detail, for the period since 1995. It inquires about the likely causes of the shifting growth rates of output and productivity in the US and in Western Europe over these different periods.
By definition there are only two ways for output per capita to rise, either through higher productivity or as a result of higher hours of work per member of the population. A striking aspect in the comparison between the two regions was a simultaneous transition after 1995. Europe’s growth of productivity moved from faster than the US to slower, while at the same time Europe’s growth of hours per capita moved from
slower than the US to faster. These opposing changes exactly cancelled out, so that European and US growth of output per capita was identical in the long period from 1977 to 2011, including the post-2007 period of the great financial crisis. Hence remarkably, the US productivity growth revival had absolutely no effect on the level ratio for output per capita, which remained anchored at 70 percent with no sign of any European slippage after 1995.
The second chapter builds on the literature on the sources of growth. Growth accounting is a longstan-ding method for decomposing output growth into its underlying sources, inclulongstan-ding changes in the quan-tity and quality of labour, quanquan-tity and quality of capital, and a residual usually called “multi-factor productivity”(MFP). This general introduction to the sources of growth is followed by a summary of conclusions from the more significant recent studies for both the US and the EU-15.
The chapter identifies a long list of reasons for differences in the behaviour of productivity growth in the United States and the EU-15, and to a lesser extent differences within the EU-15. Some of the reasons for slow productivity growth in Europe are not revealed at all by growth accounting or even by industry-level analysis as in the specific discussion on market services productivity gap. Instead, a substantial part of the European productivity growth problem may be hidden inside the slow rate of Multi Factor Produc-tivity (MFP) growth that, because of its residual nature is influenced by many factors and should not be taken as telling us something about technological change. Over the past 50 years European productivity has been held back by a long list of government interventions that lower the amount that each worker can produce. Examples include shop-closing rules that prevent shops from attaining their full efficiency by forcing them to remain empty for portions of the week; labor market regulations that prevent firms from firing employees who are no longer needed; and land-use regulations that protect small shops in the central city while preventing the construction of American-style “big boxes” like Wal-Mart and Target either in the middle of cities or on the periphery.
Hence the discussion of habits, culture and institutions focuses on the productivity-inhibiting aspects of attitudes, incentives and regulations. The chapter concludes with evidence that there was a change after 1995 in Europe toward fewer regulations, faster employment growth, but slower productivity growth, as inexperienced low-skill workers entered the labour force after previously being excluded by virtue of cultural attitudes, high taxes, or regulations. There was a change after 1995 in the US too. In retrospect the productivity revival was relatively short lived – say 1996-2003 – but the US labour market has radi-cally changed. Usually labour market flexibility is praised because it is supposed to help equilibrating the supply and demand for labour, thus keeping unemployment low. But since the stock market bubble of the early 2000s the increasing power given to management led in the US to savage cost cutting: a much more aggressive attitude in reducing employment in 2001-02 (and even more so later in 2008-09) than prior to 2000. A higher propensity to reduce labor hours in response to reductions in profits and stock prices was reflected in an unusual drop in labor hours relative to output, with the counterpart that output per hour increased more than would have been expected. This helps us to understand why the increase in the unemployment rate relative to the decline in output was about double in the US than what it was in Europe.
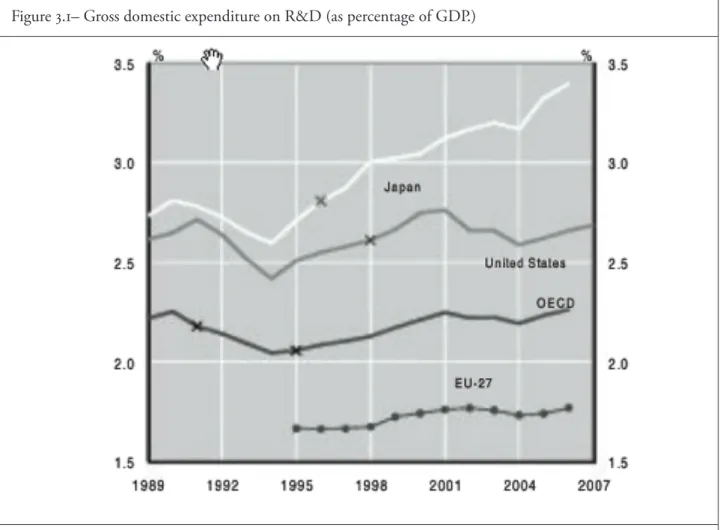
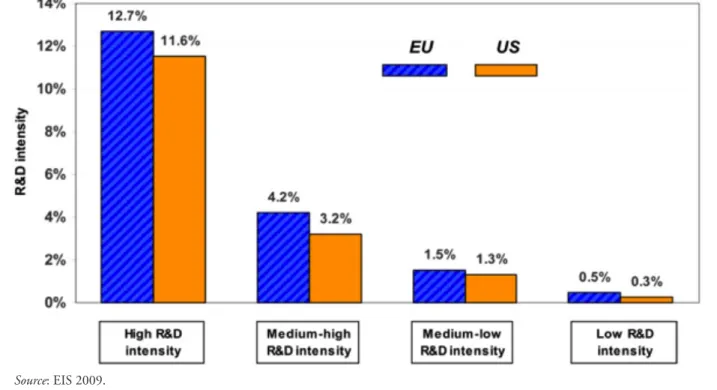
Chapter 3 addresses the specific issue of innovation and innovation policies. R&D trends and the sectoral structure of the economy seem to play an important role in explaining the divergence of the past 15-20 years. While the EU has an R&D intensity gap relative to the US in specific sectors, it also has a sectoral composition bias towards less R&D intensive sectors.
The highest intensity gap in absolute terms can be observed in the ICT sector and other non-transport equipment sector. The second highest relative gap emerges in commercial services where the intensity in the EU is one third of the corresponding figure for the US Sectors with a large gap in R&D tend to have a large gap in productivity growth as well.
The literature on innovation distinguishes between the initial invention and its subsequent deve-lopment and diffusion. A longstanding puzzle in the retardation of British economic growth after the 1870s is the fact that many inventions initially made by British inventors were brought to commercial success in the US, Japan, and elsewhere.
While predicting technological developments in advance is exceedingly difficult, there is ample lite-rature which points to particular national characteristics that help to explain, at least in retrospect, why particular inventions and industries came to be dominated by particular countries
Even in the dismal days of American pessimism during the years of the 1972-95, productivity slowdown, it was widely recognized that America’s private and state-supported research universities were its most successful export industry, at least as measured by its lead over other countries and its appeal for students from the rest of the world. The interplay among these research universities, government research grants, and private industry was instrumental in achieving American leadership in the ICT industry, and it was no coincidence that Silicon Valley happened to be located next to Stanford University or that ano-ther concentration of ICT companies in the hardware, software, and biotech industries was located in the Boston area near M.I.T. and Harvard. The most important aspect of public policy appears to have been the relatively unfocussed support of research and training by the US government
The literature on technological leadership omits a source of American advantage that is surely not insignificant. While language has little to do with domination in computer hardware (where indeed many of the components are imported), it is important for the American software industry that English long ago became the world’s leading second language in addition to being spoken as a first language by a critical mass of the world’s educated population. Another oft-neglected factor that should be discussed more often is the longstanding openness of the United States to immigration and the role of immigrants from India, East Asia, and elsewhere in providing the skilled labor that has been essential to the rise of Silicon Valley.
Chapter 4 investigates the role of the public sector in fostering productivity growth. That sector mainly affects growth and productivity through three channels. The first, and most straightforward, is public investment, and the building of infrastructure that enhance the productivity of the private sector. The chapter emphasizes how less than perfect substitutability of production factors, externalities and sunk costs, constitute reasons for direct involvement of the government in the accumulation of capital in the economy. In terms of physical capital the comparative advantage goes to European countries that in general have more modern and efficient infrastructures than the US. Externalities and market failures lead to a discrepancy between private and social returns. Every time that the social and private return of the provision of a given good diverges, there is under or over provision of that good. A number of investment projects (notably in infrastructures) have a large social return, while being not (or partially) profitable for individual private entrepreneurs. In that case market provision is insufficient, and there is room for public intervention.
Another aspect, also related to externalities and market failures, is transnational investment. This is particularly important in deeply integrated economies, like the European Union, where area-wide infra-structure development may become a bottleneck. In the European Commission’s intention, for example, the trans-European transport network (TEN-T) should become one of the cornerstones of the Europe 2020 Strategy.
A second factor which may distort the comparison of productivity growth at the disadvantage of Eu-rope is the way government production is measured. It is usually measured according to costs, i.e. on the assumption that productivity is stable. As, in general, government production is higher in Europe than in the US, this convention may lead to underestimate productivity growth in the former region. It also surely leads to underestimate the GDP of countries which have a “big government”. Privatization, say of the pension system, would result in higher profits for European’s financial services industry and lower benefits for European’s retirees. The higher profits would likely be reflected in an increase in GDP.
A recent report by the OECD (2008b) argues that in the next three decades the investment in infra-structures will need to grow considerably to keep the pace of economic growth. This is all the more true that most of the world growth will come from emerging countries where the stock of public capital is considerably lower, and hence its productivity higher. OECD (2008b) provides rough estimates of the investment need that, even with a very restrictive definition of physical infrastructures, range between 2.5% and 3.5% of GDP
The policy prescriptions of the report are then rather straightforward for what concerns the financing of infrastructure building (or maintenance). Public-Private-Partnership, increased user charges, increased involvement of other financing sources like pension funds. And the criticisms are also straightforward,
as the difficulty with infrastructures is their feature of public goods, that makes private and social returns diverge; it is unclear why would PPP emerge for non-rentable public works, unless substantial subsidies were given to firms, thus renewing the problem of costs for the budget constrained public actors
It seems then unavoidable that an increase of the public capital stock passes by an increase in public spending, reversing the trend observed in the past two decades especially in advanced economies. But how can this be made compatible with the, also unavoidable, public budget constraints? Two ways deserve to be explored, increased taxation and/or allowance for a golden rule of public finance which would permit investment to be financed out of public borrowing.
Where instead the US has an indisputable lead is the second channel identified by the report, human capital accumulation. In the provision of education and research the role of policy and of institutions appears to be crucial, as witnessed by the different paths of the US and of Europe recalled before. Educa-tion and technical training are well-known examples of public goods whose social return justifies public intervention even in presence of negative economic returns. The report further notices how the notion of human capital accumulation somehow blurs the traditional national accounting distinction between current and capital expenditure by the government. Why should the wages of teachers and professors be considered as being different from investment in bridges and railroads, when it comes to assessing the future capacity of the economy to produce income and well-being?
Last but not least, the role of the public sector in enhancing productivity growth is apparent in the institutions that foster (or hamper) innovation. A typical example is the US tradition of government se-curities regulation that forced public disclosure of information and of access of equity research analysts to internal company information, fostering a large and active market for public offerings, and this together with the relatively recent emergence of the venture capital industry provided ample finance for start-up companies. Another example is the (in) efficiency of the judiciary system that in some countries imposes upon firms high costs of doing business and, even more importantly, creates an environment of
uncer-tainty that reduces the incentives to risktaking and innovation.
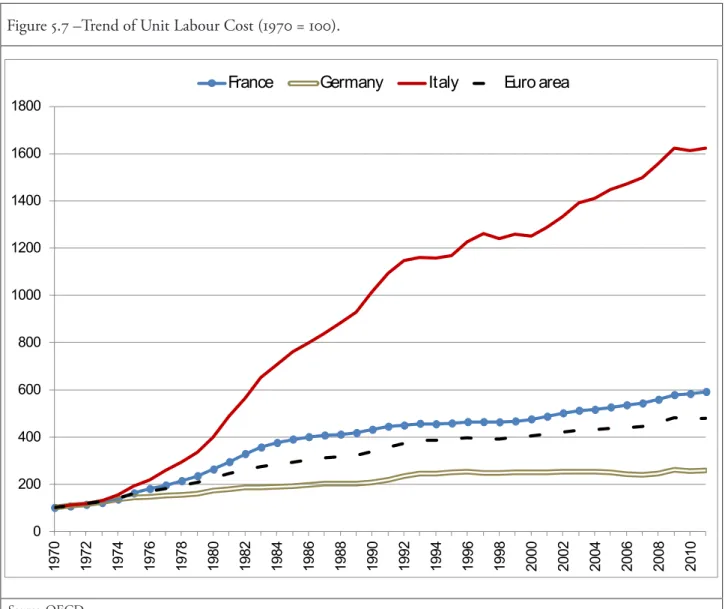
Chapter 5 deals with Italy, pointing out what are the sources of its difficulties in the past two decades, and noticing that often these sources date further back in time. Italian overall performance is weaker than the EU average. Until the mid-1990s the increasing productivity growth in Italy was sustained by a decli-ne of labour utilization and an increase of capital intensity due to high wages. The labour market reforms of the late 1990s and early 2000s raised employment, but this led to stagnation in productivity growth, as less skilled workers entered the labour market.
Italy constitutes an interesting case study, because most of its features fit in the framework laid in chapters 1 and 2. Since the 90s a number of institutional features explain the low levels of investment per worker, R&D expenditure, and productivity. The chronic instability of public finances led to increased uncertainty for firms, and to recurrent corrective measures that curtailed public investment. Wrong in-centives were also given by subsidies and wage support schemes that resulted in excessive risk taking by private and public enterprises. Furthermore, taxes on incomes and profits have constantly risen to reach nowadays European peak levels, in exchange for services of dismal quality.
Italy’s policy, in effect, aimed at maintaining real incomes, employment and production exactly where they were by increasing public expenditure which placed a tremendous burden on the public sector and publicly owned companies, impeding flexible adjustment. The public finance problem was worsened by the introduction of generous pension and health benefits, enacted in the late 1970s and early 1980s in order to mitigate social conflict. These benefits were partly financed through higher sales and labour taxa-tion which contributed even more to increasing the already excessive labour costs and accelerated labour shedding.
A main inhibiting factor in Italian policy was the perpetuation of a “three legs subsidy system” made up of incentives, extraordinary wage support schemes (cassa integrazione straordinaria and mobilità) and extraordinary administration proceedings (amministrazione straordinaria) provided to public and private companies. Within this framework, protection of domestic companies has also been ensured by means of closed public procurement (around 14% on annual GDP) and a contracting system for engineering and infrastructure works that has systematically favoured local companies often violating European rules, delayed new technology adoption, and fuelled rampant corruption by politicians and administrators.
They contributed to maintain industry specialization in less technological sectors – despite the presen-ce of some highly competitive industries – with prevalenpresen-ce of labour intensive industries, low innovation and relatively low knowledge intensity
In this context, the adverse effect of high taxation on private investment decisions is likely to have been compounded by the acute uncertainty generated by changes in tax rates and tax rules.
The reports provides industry level evidence showing that both in trade and in business services, ho-tels and restaurants, personal and public services productivity is on average lower than in the European counterparts.
The lagging productivity growth in Italy can be explained primarily by scale of operations (the predo-minance of small and medium enterprises), land and product market regulation, labour barriers including tax wedges and wage regulations and infrastructure gap.
The reports points at institutions also to explain the dismal performance of the labour market. Wo-men’s participation rate is kept low by insufficient provision of welfare services such as child care and fa-mily benefits, while distorted incentives in the pension system and insufficient investment in active labour market policies keep young and senior citizens away from the labour market.
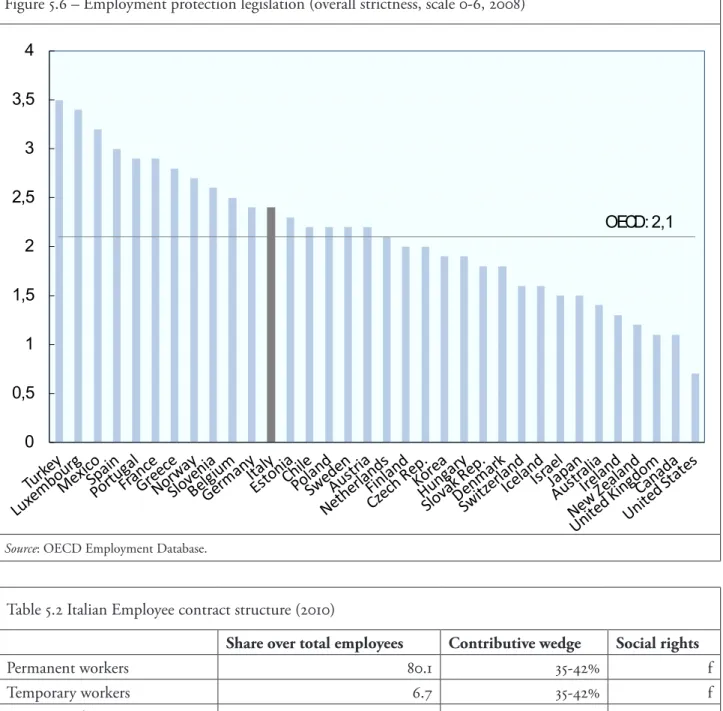
Contrary to common wisdom, the Italian labour market is not particularly rigid on average. Nevertheless, it is strongly dualistic, with a majority of highly protected workers that carry high gross labour costs (both di-rectly in terms of high fiscal and contributive wedge and indidi-rectly in terms of social rights and firing costs). At the other extreme we find temporary workers with lower firing costs, fiscal wedge and social security charges. This dualistic structure distorts the incentives of firms, which tend to hire non-protected workers because of the economic and regulatory benefits of temporary contracts. This in turn reduces incentives for human capital investments, and temporary employment creation tends to be in low-skill areas.
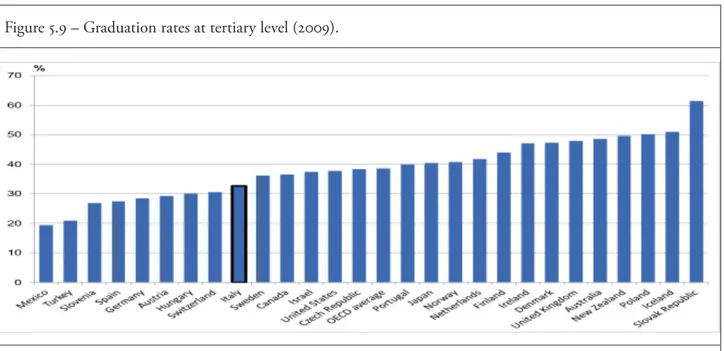
The chapter concludes by considering human capital and the educational system, also responsible for low productivity growth. The Italian labour market seems to be unable to absorb tertiary degree holders in similar proportions to other EU countries while its university system is in turn characterized by low tertiary attainment. The report also points out that the Italian system is unable to attract foreign students as well as foreign faculty/researchers, and that wage premia of graduates in Italy are lower than in Europe, although there are significant gender differences. The important skill mismatch contributes to the low productivity of the system as a whole.
In spite of this, Italian research remains of good quality, even if the channels of transmission to the firm sector are inefficient, leading to poor diffusion of innovation. Cooperation between universities and business is discouraged by several factors such as high costs, risk-aversion, a weak innovation culture and lack of institutional capacity to support inventions.
Italy performs especially poorly in “human resources” (which measures the availability of a high-skil-led and educated workforce) and in “firms investments”: private R&D expenditure only reaches 0.67% of GDP against the EU average of 1.23% and public expenditure for R&D in Italy stands at 0.54% of GDP against 0.76% in EU27.
Last, but not least, industrial policy is also incapable to foster productivity growth. In particular, and especially in a period of recession and fiscal consolidation such as the present, facilitating access to credit should be part of industrial policy. In Italy the productive system is dominated by SMEs and non-banking means are relatively scarce since equity financing continues to play a modest role in the Italian context compared to other EU countries. Therefore, direct support to firms and, more importantly, constant attention to a proper functioning of the credit system, become paramount. The scarce public resources should also be allocated to the sectors in which the potential for productivity growth is larger (business services, ICT, etc.), and in which Italy can more easily fill the gap with other European countries.
The crisis appears to have acted as a catalyst for structural reforms. The OECD Going for Growth 2012 analysis points out that, compared to the pre-crisis period, the Italian responsiveness to the recom-mendations addressed to OECD countries has greatly increased. A lot has been done especially since 2011. It is likely that these reforms, notably the reduction of regulatory barriers to competition, streng-thening incentives for innovation and labour market reforms, will address the delay of productivity per-formance in Italy, both in the whole economy and in the services sector.
policy recommendations
The focus of the report is on productivity and potential growth, and as such it is more concerned with the long than with the short run. In short we are trying to figure out what are the policy measures which may lead to an increase in potential productivity growth. It is worth emphasizing that an increase of a few tenths of points would have considerable effects on growth per capita in the medium and long runs. Unfortunately there is no magic recipe to reach such a goal, at least for what concern advanced economies. But doubts do not imply paralysie. Whatever the limitation of our knowledge, it is not empty.
The challenge is therefore to design and implement policies aimed at improving the long run potential growth rate of the economy, in a context of depressed short/medium growth.
Although the US economy is far from being a model (as the report points out at length), its produc-tivity growth in the past decades has been globally superior to the EU average. The report emphasizes, with no pretence of being original, a mix of institutions, of human capital accumulation, and of industrial policies that explain this superior performance.
The comparison between EU countries and the US, nevertheless, allowed us to highlight at least three features that are less commonly discussed in the literature.
The first feature is linked to the dynamics of hours worked. Chapter one runs counter most of the literature trying to explain the crossing of trend productivity growth in the US and in the EU, in the mid 1990s. Instead of (or in addition to) the different diffusion of the internet revolution, whose importance is probably overstated, the report highlights a social transition that happened later in Europe (especially in Mediterranean countries) than in the United States.
Prior to the mid 1990s the European social model was characterized by low employment and partici-pation rates (in particular among women), and a reduction of working hours that accompanied the incre-ase of productivity. Reforms in the 1990s changed this model, trying to adapt to changing environmental conditions, and to associate increased productivity with increased employment. A number of changes have been implemented: the reform of pension systems (notably with higher retirement age), induced by longer life expectancy; policies supporting female and youth employment, through incentives to part-time work and the creation of flexible contracts; the effect of immigration flows on labor supply; All these factors have changed the position of labor supply and demand curves. The objective of full employment, that inspired national reforms but also EU policies had a negative effect on productivity dynamics. The entry on the labor market of less qualified workers, and more intensive use of capital goods, have nega-tively affected wages and competitiveness of the European productive system. But it had a fairly positive impact on well-being as employment is one of the main objective factors determining it.
This perspective opens the way to a number of prescriptions for policy makers:
() Investment is of course a key factor. Reducing capital intensity would have a negative impact on productivity; therefore the challenge is to increase employment at constant capital intensity. Capital accumulation must accompany employment growth. The previous LIGEP report highlighted how investment in Europe has been insufficient in the current crisis. The present report suggests that this is likely to cause even more serious problems in the future capacity of the economy to grow. The report further emphasizes that the tight constraints that member States face with regards to their public finances calls for a serious European infrastructure building effort, much larger in size and in scope than the one the recent European summits have agreed upon.
() As for private investment, the report suggests that both public and private credit flows need to be improved, especially in countries that rely on credit more than on capital markets, like Italy. The credit crunch is widely discussed as one of the major factors that prevent the recovery of the Euro-pean economy. The report argues that it is also an obstacle to productivity growth in the long run. A better access to finance is thus a crucial instrument for allowing European firms, especially small and medium sized enterprises to invest. But this supposes to resolve the rampant European banking crisis which caracterises the Euro area today.
() Several European countries have devised measures to reduce labour costs and to avoid disinvestment in firm specific human capital by encouraging and subsidizing part time employment. These policies have given to Europe a decisive advantage vis à vis the US in smoothing the evolution of
ment. They should be pursued and generalized to southern countries where the rate of unemploy-ment has reached unacceptable levels. To the extent that these policies are alike internal devaluation, they should be coordinated at the European level.
() What the recent period taught us is that the outcome of employment policies depends also of the balance of power between firms and workers. If more flexibility is desirable to adapt to changing circumstances, it should not come at the expense of economic security. The European policy makers should devise labour market reforms keeping an eye on the bargaining power of the workers. () The changing European social model also calls for a broader rethinking of the labor-life cycle. So
far the only response our economies have been capable to give to higher life expectancy has been in-creasing the number of years spent at work. It may be worth to consider incentives to schooling and late entry in the labor market as complementary policies. Indeed, the more educated the labor force, the fewer of them will be doing arduous low-skilled work. Professionals like to work longer because their work is rewarding and fulfilling. So the larger the percentage of the population is educated, the higher retirement ages can be.
The second feature of the report that emerges as peculiar is linked to MFP growth. The break-up by sec-tor shows that Market Services account for a large part of the transatlantic gap in productivity, and more importantly were the main factor behind the crossing of productivity trend lines in the 1990s. The report highlights that this is explained by poor MFP dynamics rather than intensity or productivity of single factors. However, once Europe is disaggregated by country groups, the dismal performance of this sector results to be a prominent feature of Southern Countries while Northern Countries have achieved remark-able improvements, in particular where important reforms have been realized.
Among market services, the retail industry is the most important example: low productivity in that sector is on one side due to different urban development and transportation models (that favour small scale businesses rather than large shopping malls as in the US); on the other, it is due to oligopolistic practices, excess of red tape and regulation, corporatism, and scarce incentives to innovation (e.g. e-commerce). These limits, flagrant in the retail sector, are in fact common to most of the services sector. This calls for a series of policy prescriptions:
() The first and most obvious is of course to streamline regulation and to enhance competition through contrast to oligopolistic practices, reduction of red tape, and most importantly fighting corporatist practices.
() The second is to adapt the infrastructure system to enhance the logistics, and thus the productivity, of the diffuse retail trade network of EU countries. It has to be emphasized that “Infrastructure” is a term with a broad definition – it encompasses everything in the external environment that makes a person or a business firm more productive.
() The third is to transform the ‘weakness’ of the small scale retail network in ‘strength’, through the development of quality and value added and incentives to craftsmanship, while at the same time transferring as much as possible to large distribution the commerce of low added value goods. These prescriptions, specific to retail trade, can be generalized to other service sectors, like for example tourism, where the insufficiencies of Infrastructures and of better organization (for example of the trans-port network) at the European scale is flagrant. This of course relates to prescription 1 above, giving hints as of how a European infrastructure network should be built.
A word of caution is in order. We have identified four sectors -- wholesale trade, retail trade, financial services, and business services – where European productivity lags behind its US counterpart. This lag is mostly explained by the differing trends in MFP, a variable which is in some ways a measure of our igno-rance. It is likely that our ignorance is deeper that what we think. In effect, much of the increase in GDP today occurs not as a result of, say, an increase in the number of cars purchased, but of their quality and
our metrics is poor for measuring quality1. For material productions we may use some conventions which
allow us to account for quality improvement, as we do when we use hedonic prices for computers. But
the difficulty is compounded when we deal with services. Whereas for manufactures it is easy to define
the unit purchased, this is much harder for many services2. This difficulty has long been recognized and
it implies that for the service sector, especially for complex services, the quality question will be much harder to resolve. And precisely, we have identified the sectors where European productivity is lagging as wholesale trade, retail trade, financial services, and business services. A modicum of historical sensitivity would tell us that we were wrong in our measurement of output and productivity for the financial sector in the US. Business services are complex services, and we have to go deep into the details of the compari-son before coming with a robust conclusion. Even in the retail sector, it is not so easy to define the unit purchased. Our conclusions are thus to be taken with caution, hoping that in the future better metrics will allow us to be more precise.
The third theme that emerges from the report also pertains to MFP and technical progress. The re-port emphasizes the two pillars that sustain the US leadership in innovation and growth: on one side an efficient system of private financing of invention and innovation (mostly through private equities and venture capital) and on the other an important role for government policies. Europe has largely been on the opposite path, with absent (or harmful) government policies, and inefficient financing.
() The first policy prescription is therefore to enhance or more often develop the capacity of the system to finance innovation whose returns are uncertain and/or distant in time; in more extreme cases, in-centives should be designed to induce firms to face short term losses in return from investment that is rentable only in the long run. Environmental technologies are a typical example. It is doubtful that such an objective could be reached without an explicit industrial policy.
() Tertiary education is instrumental to raise productivity. Because of globalization, Europe’s industry specialization is changing: employment is shifting from primary and basic manufacturing sectors to knowledge-intensive activities which require high-skilled workforce. As a result, investment in tertiary education becomes essential as it contributes to increase a country’s ability to innovate. The European system is lagging behind the US one, because the search for formal equality comes often at the expenses of quality. In devising reforms of the university system, Europe should aim at substantial equality that is meritocracy. Some features of the US system may be imitated and some others have to be rejected. In particular, meritocracy should not be limited among the higher income deciles of the population (whose weight is increasing among the students of the top universities). At the contrary, student from poor families have to be helped on order to concour on equal footing with the others. () The report also emphasizes the need of a bidirectional exchange between the education system and the productive sector (private and public alike), that in Europe is limited by regulation and by cor-poratism.
Chapter 1
Productivity: Basic Concepts, Historical Context,
and Current Puzzles
1.1 introduction
While both the US and Europe suffered acutely from the 2007-09 world financial crisis and began their recoveries at roughly the same time in mid-2009, their path of recovery has diverged in 2011 and 2012. Fiscal austerity measures imposed in several European countries have tilted them back into recession, whi-le the US has delayed its fiscal reckoning and, partly as a result of continuing fiscal stimulus and very easy monetary policy, has experienced a slow but steady recovery. To the extent that this divergence, between a recovery in the US and renewed recession in parts of Europe, extends beyond 2012 for several more years, it will widen the longstanding gap between per capita output in the US and in Europe. Notice that this divergence has nothing to do with the fundamentals determinants of potential growth but much to do with the way Europe is dealing with the sovereign debt crisis, imposing almost everywhere restrictive fiscal policies and structural reforms in the hope that present recession will boost future growth.
The fundamental driver of output growth (when growth is allowed for) is the growth of labour
pro-ductivity1. For the entire post-war period up to 1995, productivity in Western Europe, hereafter the
“EU-15” (the pre-2004 members of the EU) grew faster than in the US In what Europeans sometimes call the golden years between 1945 and 1973, rapid European productivity growth mainly reflected catching up to American technology that the US was able to adopt between 1914 and 1945, while Europe was suffe-ring from wartime destruction and interwar economic chaos. Between 1973 and 1995, Europe continued to catch up in its level of productivity until 1995 where it reached 92 to 95 per cent of the US level. In this period the main driving force was not particularly rapid European growth but rather the widely discussed and somewhat puzzling US productivity growth slowdown. In the 80s, productivity growth in the US was on average 0, 80 per cent. But it is worth remembering that at that time, Europe was admiring US performances because of its higher “employment content” of growth.
After 1995 Europe’s productivity growth fell behind that of the US in two stages, first during the
relatively prosperous years 1995 -20072 and in a second phase during the post-2007 years of the financial
crisis. The current divergence of paths, with renewed recession in parts of Western Europe and continued recovery in the US, threatens to further worsen Europe’s relative productivity performance.
In this report we step back and take a longer and broader view of productivity behaviour. If produc-tivity drives output, what drives producproduc-tivity? Why do the developed nations differ so much in their pro-ductivity performance? It is fairly easy to understand rapid propro-ductivity growth in many of the emerging economies as a process of catching up by importing capital and adopting technologies previously
develo-1 In times of depression, as the 30s teach us, productivity stagnates as a consequence of the deficiency in global demand. The actual evolution of productivity thus depends also of demand factors. The relationship to which we refer assumes that no distorting factors are coming from the demand side. Cf. Jean-Paul Fitoussi, Anthony B. Atkinson, Olivier J. Blanchard, John S. Flemming, Edmond Malinvaud, Edmund S. Phelps and Robert M. Solow: Pour l’emploi et la cohésion sociale, Presses de la Fondation Nationale des Sciences Politiques, 1994.
2 Europe’s strategy was in effect to decrease the cost of labour through payroll tax reductions and wage moderation in order to allow the hiring of less skilled workers.
ped by OECD countries. It is harder to analyse the behaviour of countries, like the US, the EU-15, and Japan which have long operated close to the frontier of existing knowledge and technology. This report examines productivity growth in the so-called “rich nations,” both differences among groups of countries and also changes in behaviour over time. Most of the emphasis is on contrasts between the US and the EU-15, with occasional references to the Japanese experience.
This section of the report begins by clarifying the relationship between output per capita and produc-tivity, which are almost the same concept, but not quite. We recognize that the measures of the economy’s total real output used to define both the standard of living and productivity are imperfect, and that there are many aspects of the standard of living that are neglected in the output statistics. Differences in the time paths of the basic concepts are examined for the post-war period going back to 1960, and then in more detail for the shorter period since 1995. The chapter summarizes the consensus in the literature as to what caused the shifting growth rates of output and productivity over these different eras.
The outstanding puzzle in recent years, at least for 1995-2007 prior to the financial crisis, is why Eu-rope’s productivity growth slowed down while that of the US speeded up. This chapter summarizes some of the broader causes in the recent literature. Among the possible causes of the transatlantic disparity is the leading role of the US in the internet revolution, partly in the innovation of hardware and more importantly software. More important are differences in the effectiveness with which computers, the in-ternet, and the web have been implemented in the industries using these innovations, particularly retail and wholesale trade and other marketed services. Some of the causes include differences in regulations between the US and the EU-15 and within the EU-15 itself, involving such issues as land-use planning, product-market regulations, and labour-market regulations. The report avoids a one-sided critique of Europe and praise of the United States.
The final section identifies six “headwinds” that may slow future economic growth and that have impacts differing in the US and EU-15. The effect of rising inequality distorts the data, making the average growth rate of income in the US for the entire economy exceed that of the “bottom 99%” by a substantial margin. Another headwind holding back the US more than Europe is its poorly performing secondary education system and rampant cost inflation in higher education that is in part the cause of a steady decline in the US ranking in international league tables of college completion. Also the US is far behind Europe in implementing policies to cope with global warming, and any movement in the US toward a carbon tax will hinder future growth. Europe shares in common with the US other headwinds, including the demographic effect of an ageing population that will reduce future growth in hours of work per capita, the effects of globalization in draining away previously high-paying jobs in manufacturing and other sectors, and the effects of the post-2007 world financial crisis in the form of consumers, banks, and governments burdened with excess debt.
The most serious threat of all, however, comes from the nature of innovation. Steady future GSP
growth at the past rate of 1.5 or 2 per cent per year is not guaranteed.3 That rate of growth in the past
140 years has been achieved by a cluster of innovations, mainly in the late 19th century, which brought the world electricity, the internal combustion engine, running water, and indoor plumbing, and all of the supplementary innovations that were made possible after that – household appliances, manufactu-ring machinery, motor vehicles, airplanes, superhighways, supermarkets, suburbs, and air conditioning. While many of these inventions took a century or more to be fully developed, they can be characterized as “one-time-only” inventions, i.e., changes that would not be repeated endlessly into the future. Speed accelerated from that of a horse to that of a Boeing 707 in 1958, but has not increased further since then. Central heating and air conditioning have made it possible to maintain room temperatures evenly (at 70 degrees F or 21 °C) in summer and winter, but we can’t make the climate any more comfortable than that. There was virtually no economic growth between the Roman Empire and Britain in 1750, and then the world got used to a steady burst of innovations since then. But, while innovation is clearly not dying out, it is becoming increasingly unlikely that future innovation will have the effect of the previous Great Inventions in brightening the evening, speeding transport, eliminating household drudgery, and bringing comfortable indoor temperatures.
1.2
definitions: output per capita
and productivity are almost the same thing, but not quite
The concept of labour productivity, often called simply “productivity,” is almost the same as output per capita, but not quite. The latter, by definition, divides output by the population, whereas productivity divides the same measure of output by the total number of hours worked in a year by all the employees. Thus if each employee works 40 hours per week for 50 weeks per year, then he or she contributes 2,000 hours per year. If there are 10 million such employees in a country, total hours are equal to 20 billion. If real GDP is $1,000 billion, then productivity is $50 per hour.
By definition there are only two ways for output per capita to rise, either through higher productivity or as a result of higher hours of work per member of the population. Throughout history people have shown their preference to work fewer rather than more hours, and so to make possible a reduction in hours for more vacations and days off, on average productivity rises somewhat more rapidly than output. This was particularly true in Western Europe between 1960 and 1995, when hours per person declined
substantially, holding back growth in GDP relative to the growth in productivity.4 This relationship also
extends to comparisons across countries. When the EU-15 are compared as a unit with the United States, they enjoyed faster productivity growth than the US between 1970 and 1995, and in fact their producti-vity almost caught up to the US level over that interval, but their output per person languished at about 70 percent of the US level. This difference was due by definition to a decline in EU-15 hours per person by about 30 percent relative to the United States.
After 1995 the relationship changed. Hours in Europe rose relative to the US but productivity growth
slipped back5, primarily because Europe did not share in the post-1995 US productivity growth revival
that is usually interpreted as a benefit of the internet and the invention of the world-wide web in the late 1990s. Why Europe reaped fewer benefits from web-related innovation is one of the main productivity puzzles that we explore here, building on a rich literature to which both Europeans and Americans have made important contributions.
The behaviour of hours per person can move in either direction, and thus we have witnessed eras in which productivity grew more rapidly than output per capita for decades and when the reverse was true. A leading example of fast growth in output per capita and slow growth in productivity occurred in the US between 1965 and 1990, which was the interval when the role of women was revolutionized. Social atti-tudes changed from the assumption that women would stay home with their children to the new culture that women would work and have full-life careers, with only relatively short intervals of labour-force exit to bear children and take care of them while young. Output per capita could rise faster than productivity, simply because hours of work per capita increased as women entered market work.
The entry of females into the labour force proceeded more slowly in the EU-15 and in 1985 the participation rate of Spanish women was only half that of Swedish women. As a result, the increased participation of women that dominated the behaviour of hours per person in the US was instead domi-nated in Europe during 1970-95 by a move to a shorter work week, earlier retirement, longer vacations, and a higher unemployment rate. After 1995, as we shall see, this contrast was reversed, and the EU-15 experienced an almost exactly offsetting increase in their growth of hours and employment relative to the US combined with a decrease in their relative growth in productivity. Subsequently we will discuss the extent to which there was after 1995 in Europe a trade-off between faster employment growth and lower productivity growth. If so, then Europe’s productivity problems after 1995 did not just involve a slow adaptation of the benefits of computers and the internet, but rather the outcome of a social transition that had occurred earlier in the US than in Europe, particularly in the Mediterranean countries.
4 An hour not worked because of longer vacations, a shorter work week, higher unemployment, and lower labor-force participation does not automatically create an equally valuable hour of leisure. Hours of work generate large amounts of tax revenue that hours of leisure do not, and some hours (particularly those of the unemployed) are less valuable than the after-tax value of work. See Gordon (2011a).
1.3
alternating intervals of advantage and disadvantage: the contrasting history of growth in the us and the eu-15 since 1960
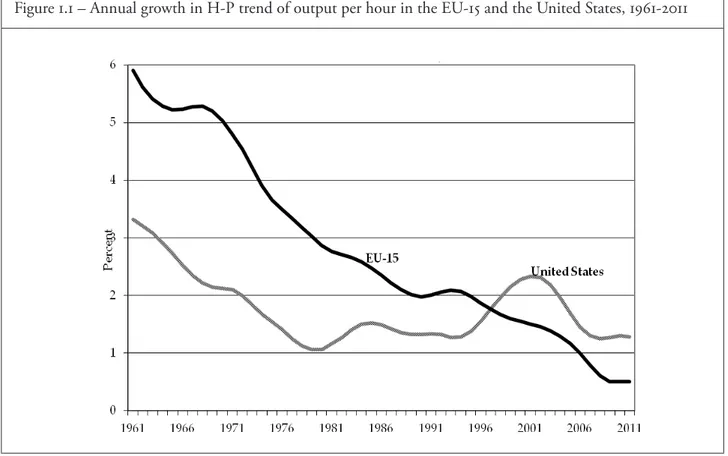
The differing history of growth in per capita output versus productivity in the EU-15 and the US can be clarified if we look at a series of graphs, all of which plot the data from 1960 to 2011. Figure 1.1 exhibits growth in productivity in the EU-15 and in the US, showing much faster growth in the EU-15 in the 1960s, a growth slowdown for both the EU-15 and the US between 1960 and 1980. After 1980 EU-15 growth continued to outpace that of the US, which experienced a low growth plateau from the late 1970s to 1995, but the margin between rapid EU-15 growth and slower US growth continued to narrow. The margin by which EU-15 growth exceeded that of the US fell from three percentage points in the late 1960s, to two percentage points in the late 1970s, to less than one percentage point between 1985 and
1995.6 After 1995 the relationship flipped around; Europe’s productivity growth continued to decelerate
while that in the US rejuvenated between 1995 and 2002. However, this US revival did not last, and by 2007-11 the growth path had returned to roughly the same relatively low pace as during 1986-96. US productivity growth was notably better than in the EU-15 not just during the pre-crisis years of 1997-2007, but also during the post-2007 years of the financial crisis, recession, and recovery.
Figure 1.1 – Annual growth in H-P trend of output per hour in the EU-15 and the United States, 1961-2011
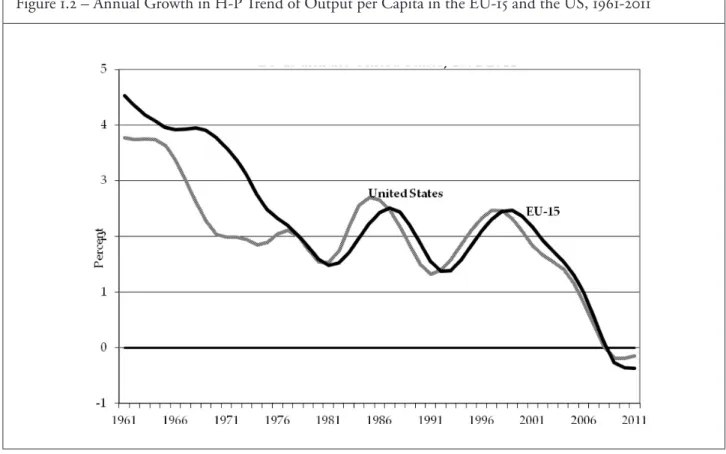
Figure 1.2 shows for the same period the smoothed growth rates of output per capita in the EU-15 as contrasted with the US; the volatile year-to-year changes in growth rates are smoothed by the same technique as in Figure 1.1. This graphical depiction of output growth is surprisingly different than the previous graph displaying productivity growth. Growth of output per capita in the EU-15 slowed down to the American rate by 1977 and did not exceed it thereafter. In fact the EU-15 slowdown from 4 to 2 percent growth during 1971 to 1977 echoes the same slowdown in the US that happened a few years earlier between 1964 and 1970. After 1977 Figure 1.2 evokes the song “Me and My Shadow,” because EU-15 growth of smoothed output per capita almost exactly mimics the US growth rate of one or two
6 Growth in both productivity and output per-capita are quite volatile from year-to-year. The data graphed in Figures 1.1 and 1.2 are trends extracted from the annual data using the Hodrick-Prescott method with a smoothness parameter of 100.
years earlier. There were short-lived revivals in 1983-89 and 1994-2000 on both sides of the Atlantic, fol-lowed by a relentless slide down to negative growth of output per capita after 2008. Because growth in EU-15 and US output per capita was so similar between 1977 and 2011, the level of EU-15 output per capita failed to make any progress in catching up to the US level.
Figure 1.2 – Annual Growth in H-P Trend of Output per Capita in the EU-15 and the US, 1961-2011
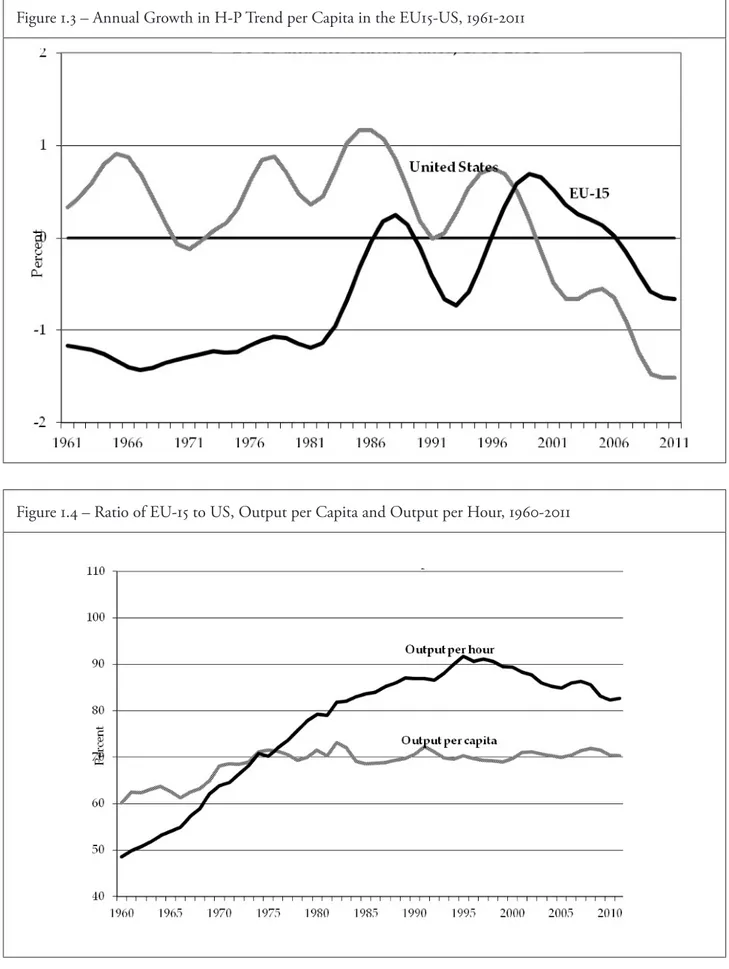
By definition, output per capita equals productivity times hours per capita. That same definition means that, since output per capita growth in Figure 1.2 was virtually identical after 1977, differences between the EU-15 and the US in productivity growth shown in Figure 1.1 must have been offset by the opposite pattern of growth rates of hours per capita. Thus it is no surprise that the EU-15 productivity growth ad-vantage of 1977-95 of Figure 1.1 is offset by a shortfall of growth in hours per capita over the same period in Figure 1.3. In fact EU-15 smoothed hours per capita had a negative growth rate of more than minus one percent for more than two decades between 1961 and 1982.
For the decade after 1995 the two lines in Figure 1.3 form the shape of an “X” in which the US growth rate collapses while the EU-15 growth rate soars upward, at least temporarily. Throughout 2000-2011, the smoothed growth rate of US hours per capita is negative. This explains at least in the arithmetic sense why the US was able to achieve a much better productivity performance in the past 15 years without gain-ing any further advantage in the margin by which its output per capita exceeds that in Europe.
Thus the growth rates examined so far are for smoothed changes in productivity, output per capita, and hours per capita. We can also look at the ratio of the actual level of these variables in the EU-15
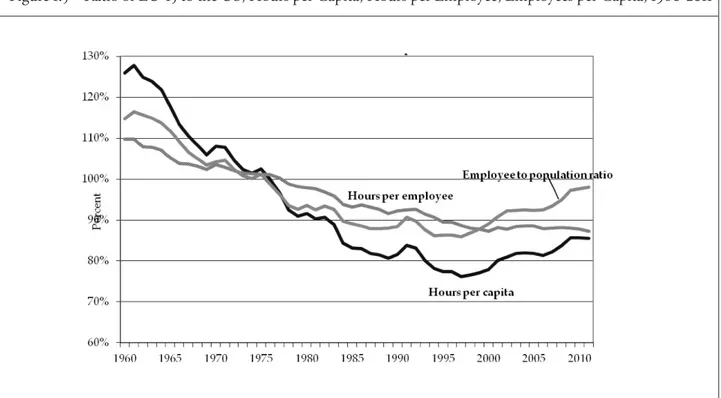
rela-tive to their values in the US7 As shown in Figure 1.4 by 1995 European productivity had reached 91.7
percent of that of the United States and then by 2011 slipped back to 83.0 percent. Three European countries exceeded the US level for a few years during the 1990s: France was at 103.6 percent in 1995,
7 Working-age population and hours can be compared directly across countries. However, output in one country can be compared to another only by adopting a uniform set of prices for each good or service. The available data provide two alternative international price weighting schemes; these are the “G-K” (Geary-Khamis) weights calculated in 1990 dollars and the “E-K-S” (Eltetö, Köves, and Szulc) weights calculated in 2008 dollars. All data on productivity, output per capita, and hours per capita come from the Groningen economy wide database, now housed at the Conference Board. See http://www.conference-board.org/economicdatabase/.
while Belgium achieved a ratio of 108.1 percent and the Netherlands a ratio of 105.0 percent. All three of these nations had fallen back under 100 percent of the US level by 2011.
Figure 1.3 – Annual Growth in H-P Trend per Capita in the EU15-US, 1961-2011
Figure 1.4 – Ratio of EU-15 to US, Output per Capita and Output per Hour, 1960-2011
The grey line in Figure 1.4 displays the EU-15 ratio to the US of output per capita, using the same defini-tion of output as the black productivity line. Just as the smoothed growth rates of Figure 1.2 displayed
an amazing similarity after 1977, so the ratio in Figure 1.4 is extremely stable after 1977, varying only between 69 and 72 percent. Short-lived upward movements in the ratio such as in 1981-83 reflect US recessions, while intervals when the ratio slipped below 70 percent are the counterpart of prosperous peri-ods in the US such as 1985-90 and 1997-2000. The small bulge in the ratio in 2008-09 suggests that the recession associated with the world financial crisis was more severe in the US than in the EU-15.
The diverging behavior of the two lines in Figure 1.4 is consistent with a decline before 1995 in the ratio of hours per capita in the EU-15 relative to the US and a reversal after 1995. The solid line in Figure 1.5 displays the epochal drop in that ratio from 126 percent in 1960 to 76 percent in 1997, followed by a recovery to 86 percent in 2011. What caused these movements? Once again, definitions help to clarify these changes. Hours per capita by definition equals employment per capita times hours per employee. Employment per capita declines either when there is a rise in the unemployment rate, as occurred in Europe after the mid-1980s, or if labor-force participation declines. Hours per employee can decline as a result of more weeks of vacation, fewer work days per week, or fewer number of work hours per day. Since Figure 1.5 plots ratios of these variables to the US, a downward movement could also reflect an increase for the US, including its rise in female labor-force participation between 1965 and 1990.
Figure 1.5 – Ratio of EU-15 to the US, Hours per Capita, Hours per Employee, Employees per Capita, 1960-2011
All of these factors help to account for the divergent behavior of hours per capita in the EU-15 relative to the US The solid black line in Figure 1.5 displays the steady decline in the ratio of EU-15 to US hours per capita from 1960 to about 1997, followed by a modest recovery in two phases, 1997-2003 and then again in the recession period 2008-11. The two components of the hours per capita ratio are also plotted in Figure 1.5. The solid grey line is employment per capita, and the dashed grey line is hours per employee. The EU-15 to US ratio of employment per capita fell steadily from 1960 to 1995, with a few cyclical bumps along the way, but then it recovered substantially after 1997. The final phase of this recovery after 2007 occurs in part because both employment and labor-force participation fell much more in the US than in Europe in the aftermath of the world financial crisis. The decline in the plotted ratio for hours per employee was quite steady from 1960 to 2000, but in the past decade the decline has stopped and the ratio has settled down to a plateau of about 88 percent.
The time-series plots of the five ratios in Figures 1.4 and 1.5 are summarized in Table 1.1, which displays both levels and growth rates for 1960, 1973, 1995, 2007, and 2011. Because the intervals are of different lengths, we focus here on the annual growth rates shown in the bottom four lines of Table 1.1.
The first column shows that the European level of output per capita grew much faster than the US level from 1960 to 1973, then inched up slightly further by 2007 and then declined slightly back to the 1995 ratio by 2011. The growth rates in the second column show the much greater speed of catching up of the productivity ratio through 1995, followed by a slow decline through 2007 and more rapid decline during 2007-11.
Table 1.1 – Levels and growth rates of Output and Labour Utilization: Ratio of EU-15 to US, 1960-2011
Output
per Capite Outputper Hour Hoursper Capite
Hours per
Employees Employee per Capite Levels 1960 60.1 48.6 126.0 109.8 111.4 1973 68.2 69.0 102.3 101.4 100.8 1995 70.4 91.7 77.3 89.6 86.3 2007 71.5 86.3 82.2 88.0 93.4 2011 70.4 82.6 85.5 87.2 98.0
Annual Growth Rates
1960-1973 1.0 2.7 -1.6 -0.6 -0.8
1973-1995 0.1 1.3 -1.3 -0.6 -0.7
1995-2007 0.1 -0.5 0.5 -0.2 0.7
2007-2011 -0.4 -1.1 1.0 -0.2 1.2
Source: Conference Board Total Economy Database, accessed April 2012
The third column shows the steady decrease in the ratio of hours per capita between 1960 and 1995, fol-lowed by a significant recovery. The mirror-image behavior of the second and third columns after 1973 has elicited interest in the idea of a trade-off between hours and productivity growth, which we explore further below. As shown in the fourth column hours per employee also declined relatively steadily from 1960 to 1995, followed by a much smaller rate of decline after 1995. Employment per capita exhibits a similar decline through 1995 and a more dramatic turnaround after 1995. In fact, the ratio of EU-15 to US employment per capita has almost returned to the level of 1973, in part reflecting the dismal US labor market of the last several years.
1.4
explanations for the overall patterns in the data: a concise history
The data charts and table discussed in the previous section pose a number of questions. For each of the major in-tervals (1960-73, 1973-95, 1995-2007, 2007-11) we observe faster or slower growth in the EU-15 and/or the US in productivity, output per capita, and hours per capita. Sometimes the two sides of the Atlantic display an identical performance, such as for 1977-2012 the growth rate of output per capita in Figure 1.2 or the ratio of the level of per-capita output in Figure 1.4. Most of the time, however, the US and EU-15 behave quite differently. This section provides a broad overview of explanations, organized around several puzzles suggested by the charts. This section ends with a summary of the major factors that appear to mat-ter for productivity growth, and in subsequent sections we relate these factors to the more formal setting of growth accounting introduced in the last section. Does growth accounting provide deep explanations or is it merely an accounting device?