03 July 2021
AperTO - Archivio Istituzionale Open Access dell'Università di Torino
Original Citation:
Numerical comparison between energy and comfort performances of radiant heating and cooling systems vs. air systems
Published version:
DOI:10.1080/10789669.2011.578700 Terms of use:
Open Access
(Article begins on next page)
Anyone can freely access the full text of works made available as "Open Access". Works made available under a Creative Commons license can be used according to the terms and conditions of said license. Use of all other works requires consent of the right holder (author or publisher) if not exempted from copyright protection by the applicable law. Availability:
This is the author's manuscript
This is an author version of the contribution published on:
Questa è la versione dell’autore dell’opera:
Numerical comparison between energy and comfort performances of radiant
heating and cooling systems vs. air systems
HVAC&R Research, volume 18, issue 4, 2012
DOI: 10.1080/10789669.2011. 578700
The definitive version is available at:
La versione definitiva è disponibile alla URL:
http://dx.doi.org/10.1080/10789669.2011.578700
Numerical comparison between
energy and comfort performances of
radiant heating and cooling systems
vs. air systems
ABSTRACT
A comparison between energy performance, simulated by means of the EnergyPlus building simulation programme, of two air systems (all-air and fan coil) and radiant heating and cooling floors/ceilings is developed in this work for various European climates (Milan, Frankfurt, London, Madrid, Athens, Helsinki, Moscow) and carried out on a reference building, selected among DOE commercial building new construction benchmarks. The comparison is focused on the analysis of energy sources and CO2 emissions at equivalent thermal comfort quality levels in the various cases. The adoption of a radiant system, and of an appropriate primary energy system, always results in a reduction of energy sources exploited, of costs for energy wares purchased and of carbon dioxide emissions. The greatest reductions can be achieved in climates where the energy demand for cooling is greater than the energy demand for heating. The paper also focuses on the discussion of the procedure to be adopted when a comparison between air systems and radiant systems is implemented.
INTRODUCTION AND PURPOSE OF THE WORK
Hydronic radiant panels represent a successful solution to be adopted if you want to achieve at the same time high thermal comfort levels and significant energy savings. At the beginnig the applications were for heating purposes, expecially with radiation floor techonologies; after, the use of radiant systems has been extended also to cooling purposes and different solutions of radiant cooling floors and ceilings have been developed.
Nowadays, hydronic radiant panels are a consolidated climatisation technique: they are widely used in Europe, and in North America the number of applications is continuously increasing.
As it is well known, the principles of radiant systems were already adopted in ancient times (Olesen et al. 2002), but only at the beginning of 1950 they were discovered and applied as building heating systems.
Mistakes, both in the design procedure and in the installation phase, have been done in some of the first applications. These mistakes have generated a preliminary obstacle for the diffusion on the market of the radiant technique; on the other hand, they have stimulated the developments of specific researches addressed to the characterisation of heat exchange mechanisms bewteen the heating/cooling radiant surface and the surrounding indoor environment.
Moreover, the progresses on the material science allowed the adoption of safer and more flexible solutions aimed at provinding easier installations: plastic (polyethylene and polypropylene) pipes, modular radiant panels, etc (Babiak et al. 2007) have been used.
At the same time, significant improvements have been carried out in the “theory of radiant climatisation”: dedicated design methods have been defined (Causone et al. 2010a) and dyninamic energy simulation sofware tools have been developed or adapted to take into account the peculiarities of radiant systems (Strand and Pedersen, 2002).
The high comfort level provided in the indoor environment by radiant systems is a recognised successful feature. In term of thermal comfort, this is achieved by the preminent use of radiative heat exchanges between panel and occupants/walls. To assure indoor air quality, radiant systems are typically coupled with a Dedicated Outdoor Air System (DOAS). DOAS is an important element to be foreseen in the radiant panel design. In fact, the ventilation system plays a fundamental role because, in addition to guarantee the desired ventilation air flow rate, it keeps under control the humidity, avoiding condensation problems on the cooled surface of the panel (Conroy and Mumma 2001). Radiant panels can be used as the unique climatisation system only when their heating/cooling efficiency is higher than the total hetaing/cooling load. As their efficiency is limited by the maximum/minimum allowed surface temperature, when loads overcome the panel efficiency, the supplied ventilation air is coupled, expecially in cooling mode (Jeong and Mumma 2006).
As mentioned above, the great interest in radiant systems is due to the capability of maintaing high thermal comfort levels, by using a fluid at a moderate temperature (low temperature heating and high temperature cooling, Babiak et al. 2007). This allows to exploit greater conversion efficiencies of primary
energy systems (condensing boilers, heat pumps, liquid chilling packages, etc.). However, the actual energy savings depend strictly on the careful design and control of the radiant system, on the selection and sizing of the primary systems, on the climate and on the other influecing boundary conditions (Olesen and Mattarolo 2009).
The main aim of this work is to is to provide an assessment of the benefits that can be achieved by a radiant system in heating and cooling mode in terms of carbon dioxide emissions and energy savings, expressed in terms of delivered energy and source energy. This is done by means of a comparison between a system based on a radiant floor/ceiling for heating and cooling and a reference conventional all-air system, analyzed in various European climates. The performance of the systems is simulated by means of a building energy simulation programme.
PROBLEM DEFINITION AND DISCUSSION
Comparing the energy consumed by radiant and all-air systems for a particular building may appear quite simple from a procedural point of view, but at a deeper investigation some problems arise affecting energy consumption assessment. The main aspects are here summarized:
- thermal comfort depends on air temperature and on mean radiant temperature (combined into the operative temperature), while the control of the systems is usually carried out by air temperature (Olesen 2001; Olesen 2002; Simone 2009; Berglund et al. 1994);
- radiant systems are not only HVAC components but also envelope components affecting the energy balance;
- radiant systems are both radiant and convective equipment, while the HVAC reference system is a convective only equipment (e.g. fan coil, VAV damper and inlet, etc.) (Causone et al. 2010; Spitler 2009)
- the controlling equipment thermal inertia (radiant, all-air) varies, while the controlled system thermal inertia (the indoor thermal environment) is constant (Olesen 2002; Babiak et al. 2007).
As regards the first aspect, for the same air temperature, the thermal comfort conditions guaranteed by a radiant system are better than those of a convective system, since the operative temperature is higher (or lower in summer condition) than the one of an enclosure equipped with a convective system (Olesen 2002). The operative temperature can be considered as a basic indicator of thermal comfort in rooms with moderate values of relative humidity and air velocity. It is expressed as the weighted average of air
temperature and of mean radiant temperature: it depends on both convective and radiant room heat loads. As shown in previous works by Simmonds (1994, 1996) the mean radiant temperature substantially affects thermal comfort conditions: therefore, it is not effective to contrast radiant loads with convective loads. Radiant systems contrast radiant loads with radiant loads, while air systems contrast radiant loads with convective loads: as a result, with air systems, a lower thermal comfort is obtained with the same room reference air temperature. A correct comparison can be made only if the same operative temperature, or better thermal comfort conditions, are guaranteed in both cases (see the “Thermal comfort analysis” paragraph). To face this problem, in this numerical study a thermostatic control based on operative temperature was selected. In EnergyPlus simulation tool, an object called “ZoneControl:Thermostat:OperativeTemperature” was used. It allows to perform a control based on the thermostatic operative temperature, which is a quantity calculated by the software as the avarage between the mean radiant temperature and the air temperature of the zone. This enabled to perform the energy simulations assuming a thermostatic control based on the calculated operative temperature.
The second aspect is easily neutralized through an enclosure with the same thermal insulation for both systems (this is not obvious for various reasons: the radiant systems always require an insulation layer that may not be present in the reference building; the insulation is placed also in internal constructions; the radiant system, even if well insulated, may loose heat towards the external side of the building when it represents an envelope component).
The third aspect deals with how the HVAC equipments are taken into account in heat balance calculation. Calculation methods were developed to integrate into the air heat balance method (which is the heat balance solution algorithm used by EnergyPlus and applied in the present work) a radiant heating and cooling model (Strand and Pedersen, 2002): the radiant system affects the surface temperature of a floor/ceiling/wall and it enters the radiative and the convective heat balance of the enclosure. The problem of the convective/radiative nature of the air conditioning equipment is more important for heating and cooling load calculations than for energy requirement calculations (ASHRAE 2009).
As regards the last aspect, different energy requirements of the radiant system and of the reference system may be obtained as a result of equipment control and thermal inertia. This aspect is particularly important with low loads and in mid seasons, when mild and cold day may alternate and an equipment with
a low thermal inertia may assure a better performance than high inertia equipments. To overcome this drawback, a suitable control strategy should be selected for the radiant system (Olensen 2002). Practical examples of control strategies for both heating and cooling by means of a floor radiant heting system are discussed by Simmonds (1994), while Leigh and MacCluer (1994) provided a comparative study of varius approaches for radiant floor heating system control.
Within this picture, scope of this work is not only to carry out a comparison between the energy and environmental performances of radiant systems and a reference system, but also to provide a procedure to be followed when this comparison is performed.
METHODS
The energy models of both buildings, one case study equipped with the reference system and the other equipped with the radiant system and a dedicated outdoor air system, were built and simulated into the energy simulation software EnergyPlus v. 3.1.0. The software is based on the air heat balance method to determine the loads of each building thermal zone and can model the most common systems and equipments.
The modelling of the low temperature radiant heating/high temperature radiant cooling system is performed in EnergyPlus by means of an object modeling a circuit of hot/ cold fluid through pipes embedded in a floor, ceiling or wall. The embedded heat source or sink is included into the one dimensional heat transfer which is calculated through the conduction transfer function method. The full description about the radiant equipment simulation can be found on Strand and Pedersen (2002) and on the Engineering Reference of the EnergyPlus manual.
Typical weather conditions of Rome, Milan, London, Frankfurt, Madrid, Athens, Helsinki and Moscow locations refer to the IWEC (International Weather for Energy Calculation) database of climatic data.
The building benchmark model
One of the DOE new construction commercial building benchmarks was adopted as a reference building. The selected building is the “small size office”: a one floor rectangular office building, with a total floor area of 511 m2 (5500 ft2) It is partitioned and modelled into 5 conditioned zones (height 2.74 m
(8.99 ft)): one central zone and four perimeter zones and ; moreover, there is an unconditioned attic. The internal gains, the building schedules of occupancy, electric equipment and electric lighting and the building envelope characteristics are those of the benchmark model.
As regards the building envelope characteristics, the thermal resistance of the walls, roofs and windows is doubled when Helsinki and Moscow locations are simulated.
The reference system #1: all-air system
The reference air conditioning system is a multi-zone variable air volume (VAV) system with reheat coils in each thermal zone (Figure 1a). In heating mode, in each conditioned zone a VAV damper and reheat box adjusts the flow rate and temperature of the air supplied as a consequence of the heating load. In cooling mode, the air is provided at the central air loop at 13 °C (55.4 °F) and then distributed into the zones; the VAV dampers adjust the flow rate. The thermostat set point is a dual set point with dead band based on the values of 21 °C (69.8 °F) (with a set back at 15,6 °C (60 °F)) for heating and 25,5 °C (77.9 °F) (with a set back at 30 °C (86 °F)) for cooling.
A thermostatic control based on operative temperature was selected in order to perform the comparison between air system and radiant systems. The thermostat object controls the flow rate of the radiant system on the basis of a calculated operative temperature. This temperature is an avarage between air temperature and mean radiant temperature of the zone.
In addition to the thermostat, a humidistat controls the relative humidity of the core zone, providing humidification (by means of an electric steam humidifier placed in the main air loop) when relative humidity falls below 45 % and dehumidification (by means of the cooling coil placed on the main air loop) when the relative humidity increases above 60%. As a consequence, the relative humidity of the zone is always between 45% and 60%.
Figure 1. Control loops of a) All-air system. b) Fan coil. c) Radiant system + DOAS and primary system#2.
There are two water loops, one for the hot water and one for the chilled water, set at the design temperature of 80 °C (176 °F) and 7 °C (44.6 °F) respectively. These temperatures were selected in order to
limit the sizes of the heating and cooling coils and heat exchangers. The loops are fed respectively by a condensing boiler and an air-cooled vapor compression chiller equipped with a reciprocating compressor. The characteristics of the primary system equipment are summarized in the table 1. In this table the rated efficiencies are listed, while the actual efficiencies depend on the part load and operation conditions (fluid temperatures, etc…) at each time step. The design air and water loops flow rates, the sizes of the coils, fans and the other primary and secondary equipment are autosized by the simulation program EnergyPlus.
The reference system #2: fan coil system
The performance of a fan coil reference system (figure 1b) was also compared to the performance of the radiant systems. Each conditioned zone has a forced air unit that is a four pipes fan coil that is modeled separately by means of a heating coil, a cooling coil, a constant volume fan and an outdoor air mixer. The outdoor air flow rate is set equal to the fresh air ventilation requirement, that is fixed in the benchmark specifications and equal in all the various systems that were simulated.
The thermostat set point is, as in the previous case, a dual set point with dead band based on the values of 21 °C (69.8 °F) (with a set back at 15,6 °C (60 °F)) for heating and 25,5°C (77.9 °F) (with a set back at 30 °C (86 °F)) for cooling.
Also in this case, a thermostatic control based on the operative temperature was selected in order to perform the comparison between the fan coil system and the radiant systems.
In a fan coil system, there is no possibility to perform a air humidification, so the indoor air relative humidity is not controlled during the heating season. During the cooling season, even if the indoor air relative humidity is not mechanically controlled (there is not a humidistat that senses the indoor conditions and activate the system response) the air – which is a mixture of outdoor air and recirculated indoor air – is partly dehumidified while passing through the cooling coil of the fan coil.
There are two water loops, one for the hot water which serves the various heating coils of the forced air units and one for the chilled water which serves the various cooling coils of the forced air units. The hot water is supplied to the heating coils and to the cooling coils respectively at 80 °C (176 °F) and 7 °C (44.6 °F). As usual, these temperatures were selected in order to limit the sizes of the heating and cooling coils.
Similarly to the plant of the all-air system, the two loops are fed respectively by a condensing boiler and an air-cooled vapor compression chiller equipped with a reciprocating compressor. The characteristics
of the primary system equipment are the same of table 1. The mean seasonal efficiency of these converters may vary as a consequence of the actual working conditions in the fan coils system. The water loops flow rates, the sizes of the coils and fans are autosized by the simulation program EnergyPlus.
The radiant floor/ceiling system
In this case the building is equipped with a radiant heating and cooling floor or ceiling (both cases are analyzed) system, coupled with an air system that is used only for ventilation and humidification/dehumidification purposes (Figure 1c). The two zone equipment works together to condition the air of each zone: the priority is assigned to the hydronic radiant system. The thermostat set point schedules and control are the same of the VAV case.
The radiant floor is situated above an existing slab floor. It is placed over an insulation layer of 20 cm (7.87 in.). The hydronic tubing diameter is 17 mm (0.669 in.) and is contained in a gypsum mortar layer of 3.5 cm (1.38 in.). The floor finishing is a ceramic tile.
The radiant ceiling is a closed ceiling of 23 mm (0.906 in.) depth, made of a graphite layer between a steel sheet (towards the conditioned zone) and a wood plate. The hydronic tubing is made of PE and has a diameter of 10 mm (0.394 in.).
Both floor and ceiling are variable flow low temperature radiant systems; the inlet water temperature is fixed to 55 °C (131 °F) for heating and to 18 °C (64.4 °F) for cooling.
The main air stream is similar to the one for the reference case, but there is only outside fresh air and supplies the zones with constant air flow which totals 0.275 m3/s (582.7 cfm). In the cooling mode for the air conditioning system, the primary air may be supplied at temperatures below the indoor air temperature set point to avoid a waste of thermal energy for post-heating after the cooling and dehumidification stages.
The reason of the use of a ventilation system coupled to the radiant systems is the necessity to both: - provide the fresh air to the building (windows are sealed and in any case natural ventilation will be uncontrolled);
- control the indoor air humidity ratio, which is not only important with reference to the occupants’ thermal comfort, but extremely important in the cooling mode for the continuous operation of radiant ceilings and floors and avoid water condensation. The water vapour condensation is avoided because the air system keeps the air relative humidity below 60%; at 60% RH and 24 °C (75.2 °F) air temperature, the dew
point air temperature is approx 15 °C (59 °F) and since the radiant floor/heating is fed by water at 18 °C (64.4 °F) the condensation never occurs.
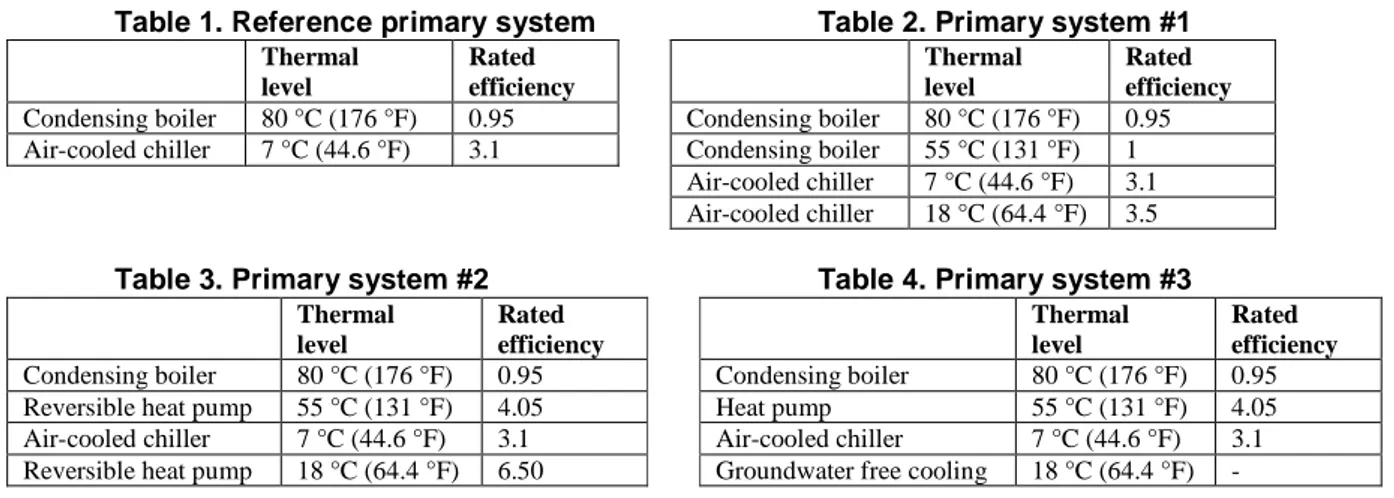
Three different primary systems were considered. The first one (table 2) is designed similarly to the baseline system: a condensing boiler and an air-cooled chiller are used to cover the radiant floor/ceiling hot water and chilled water loops. These two converters are different to the others that serve the air loop, thus exploiting the benefits of a moderate fluid working temperature for both the boiler and chiller. A second primary system (table 3) has a high efficiency ground source reversible heat pump that serves for radiant heating and cooling, thus taking advantage not only of moderate working temperatures of the fluids but also of constant temperature heat source and sink. Finally, a third option (table 4) is to consider the possibility of covering the radiant system cooling energy demand by means of a ground/pond water free cooling.
Table 1. Reference primary system Table 2. Primary system #1
Table 3. Primary system #2 Table 4. Primary system #3
RESULTS: THERMAL COMFORT ANALYSIS
Even though the set point temperature schedules and control types of the air conditioning systems are always the same, the behaviour of each system (due to the thermal inertia of the heat transfer components, the flow rate control, etc…) is different and may lead to slightly different air temperatures and
heating/cooling energy demand, especially in the case of a dual set point with a dead band.
Since the final scope is contrasting the energy consumed by different systems over a long period of time, a long term thermal comfort analysis, for Rome location, based on the simulated data, was developed in order to demonstrate that the level of thermal comfort guaranteed by the two systems is the same. This does not mean that the thermal comfort conditions, nor the air temperature, are always strictly equal between the three simulations (all-air, rad floor, rad ceiling) but it allows a comparison to be made. The long term thermal comfort analysis is based on the operative temperature of the core zone of the building and was evaluated as reported in the standard EN 15251 (CEN, 2008). Among the three categories of thermal comfort quality, category II was selected because it coincides with the satisfactory level of previous international standards (e.g. EN ISO 7730) and is adopted worldwide when thermal comfort is concerned (e.g. – 0.5 < PMV < + 0.5). A performance index (PI) associated with the category represents the percentage of values of operative temperatures during occupied hours that fall within the acceptability range of the category. An indoor environment is supposed to belong to a certain category when PI is at least 90%. Thermal level Rated efficiency Thermal level Rated efficiency
Condensing boiler 80 °C (176 °F) 0.95 Condensing boiler 80 °C (176 °F) 0.95 Air-cooled chiller 7 °C (44.6 °F) 3.1 Condensing boiler 55 °C (131 °F) 1
Air-cooled chiller 7 °C (44.6 °F) 3.1 Air-cooled chiller 18 °C (64.4 °F) 3.5 Thermal level Rated efficiency Thermal level Rated efficiency
Condensing boiler 80 °C (176 °F) 0.95 Condensing boiler 80 °C (176 °F) 0.95 Reversible heat pump 55 °C (131 °F) 4.05 Heat pump 55 °C (131 °F) 4.05 Air-cooled chiller 7 °C (44.6 °F) 3.1 Air-cooled chiller 7 °C (44.6 °F) 3.1 Reversible heat pump 18 °C (64.4 °F) 6.50 Groundwater free cooling 18 °C (64.4 °F) -
Figure 2a. Thermal comfort PI for the all-air system, winter.
Figure 2b. Thermal comfort PI for the all-air system, summer.
Figure 3a. Thermal comfort PI for the fan coil system, winter.
Figure 3b. Thermal comfort PI for the fan coil system, summer.
Figure 4a. Thermal comfort PI for the radiant floor system, winter.
Figure 4b. Thermal comfort PI for the radiant floor system, summer.
Figure 5a. Thermal comfort PI for the radiant ceiling system, winter.
Figure 5b. Thermal comfort PI for the radiant ceiling system, summer.
The frequency of the occurrence of the operative temperatures are reported in figures 2 to 5. In each figure the performance index for category II (20,0° – 24,0° C for winter thermal comfort and 23,0° - 26,0° C for summer thermal comfort) is indicated (winter season lasts from 15th November to 15th March, summer season lasts from 15th May to 15th October). From the thermal comfort analysis, it can be deduced that the thermal comfort level is equal among the various systems because the category II performance index is always greater than 90 %.
RESULTS: ENERGY ANALYSIS
Provided that both radiant heating and cooling systems guarantee the same quality level of thermal comfort with respect to the all-air systems, the comparison between the reference systems and the radiant system was made in terms of:
• energy delivered to the zone, that is the energy supplied by primary systems to the secondary system equipment;
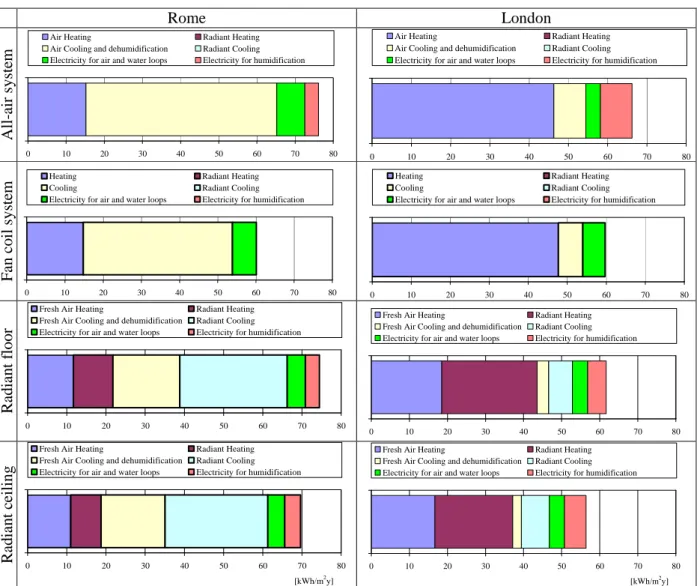
Comparison in terms of delivered energy
The heating energy, cooling energy (at various thermal levels) and electricity that are required by the demand side components (coils, pumps, fans, etc.) of the air and water loops are reported in details, as an example, for Rome, London, Frankfurt and Madrid locations in tables 5 to 8, and are reported in a graphical comparison by means of a bar graph, where the delivered energy is divided by the conditioned floor area, in tables 9 to 10. Compared to the all-air system, the radiant systems for Rome show lower energy requirements for air and water circulation in the loops (fans and pumps). While the energy for heating has increased, compared to the all-air system, a reduction of 11% and 15% respectively for radiant floor and radiant ceiling can be obtained in the delivered cooling energy for space cooling, fresh air cooling and humidity control of the indoor environment.
The fan coil system has generally an energy requirement equal (e.g. in London and Frankfurt locations) or lower than the all-air system (e.g. Rome and Madrid locations). This latter case occurs for mild climates when the cooling energy is greater than the heating energy, because the fan coils provide only a partial dehumidification of the outdoor air, contrarily to the all-air system. This fact has to be taken into consideration also when comparing the delivered energy requested by the fan coil system to the delivered energy requested by the radiant systems. Again, this is particularly evident in mild climates (see for example the case of Rome) where the energy needs for space cooling and air dehumidification are greater than in cold climates. In general, for the fan coil systems the absence of the air humidification in winter season is one of the reasons of a generalized lower total delivered energy requirement.
The comparison between radiant floor and radiant ceiling also points out that the radiant ceiling energy requirement is smaller due to the lower thermal inertia of the terminal equipment that allows a finest thermostatic control, thus minimizing the overheating and the overcooling and the related energy requirements. This is true in particular for climates in which the cooling requirements are relevant (e.g. Madrid). For radiant floor and ceiling systems there is also a general reduction in the electricity for air and water movement in the loops.
Comparison in terms of site energy, source energy, operation cost and CO2 emissions
In table 11 the site energy consumed (natural gas and electricity), the source energy, the cost for energy sources purchased and the carbon dioxide emissions are reported, for Rome location, for the
reference system and for the radiant floor. For each indicator, the percentage reduction with respect to the all-air system is evaluated; each of the three different primary systems (# 1, 2 and 3) is considered.
Primary system # 2 has a high efficiency ground source reversible heat pump, thus taking advantage not only of moderate working temperatures of the fluids but also of constant temperature heat source and sink. Primary system # 3 is similar to the system # 2 but covers the radiant system cooling energy by means of a ground/pond water free cooling. The reductions in all the three indicators are quite important (up to the 50% and still greater for the radiant ceilings) not only as an effect of the greater efficiency of the primary system installed. Looking through the results of all the locations, for the primary system #2, reported in table 12, it should be noted that the reductions vary as a function of the weighting factors for electricity assumed from Hastings and Wall (2007). In the case of radiant ceilings, the reductions are still greater (up to 60%) because there is also a reduction in the energy requirements of the secondary system.
Table 5. Rome location
Delivered energy [kWh] All-air system Fan coil system Radiant floor Radiant ceiling
Air Heating Energy (80 °C (176 °F)) 7759 7560 5979 5630
Radiant Heating Energy (55 °C (131 °F)) 0 0 5142 3948
Air Cooling and dehumidification Energy (7° C (44.6 °F)) 25561 19963 8733 8345
Radiant Cooling Energy (18 °C (64.4 °F)) 0 0 14003 13395
Electricity for air (fans) and water (pumps) loops 3748 3192 2348 2206
Electricity for humidification 1847 0 1833 2058
Table 6. London location
Delivered energy [kWh] All-air system Fan coil
system
Radiant floor Radiant ceiling
Air Heating Energy (80 °C (176 °F)) 23671 24386 9457 8552
Radiant Heating Energy (55 °C (131 °F)) 0 0 12808 10428
Air Cooling and dehumidification Energy (7 °C) 4163 3201 1541 1147
Radiant Cooling Energy (18° C) 0 0 3176 3780
Electricity for air (fans) and water (pumps) loops 1890 2923 2059 2011
Electricity for humidification 4109 0 2481 2901
Table 7. Frankfurt location
Delivered energy [kWh] All-air system Fan coil system
Radiant floor
Radiant ceiling
Air Heating Energy (80 °C (176 °F)) 28394 30567 12199 10453
Radiant Heating Energy (55 °C (131 °F)) 0 0 17435 14242
Air Cooling and dehumidification Energy (7 °C (44.6 °F)) 7479 6018 2599 2146
Radiant Cooling Energy (18 °C (64.4 °F)) 0 0 5109 5552
Electricity for air (fans) and water (pumps) loops 2431 3187 2137 2061
Electricity for humidification 5757 0 3170 3541
Table 8. Madrid location
Delivered energy [kWh] All-air system Fan coil system
Radiant floor
Radiant ceiling
Air Heating Energy (80 °C (176 °F)) 12049 11592 7599 6932
Radiant Heating Energy (55 °C (131 °F)) 0 0 7700 6055
Radiant Cooling Energy (18 °C (64.4 °F)) 0 0 13099 12946 Electricity for air (fans) and water (pumps) loops 5104 4555 2402 2224
Table 9. Delivered energy results for the Rome and London locations
Rome
London
A
ll
-a
ir
s
y
st
em
0 10 20 30 40 50 60 70 80Air Heating Radiant Heating
Air Cooling and dehumidification Radiant Cooling Electricity for air and water loops Electricity for humidification
0 10 20 30 40 50 60 70 80
1
Air Heating Radiant Heating
Air Cooling and dehumidification Radiant Cooling Electricity for air and water loops Electricity for humidification
F
an
c
o
il
s
y
st
em
0 10 20 30 40 50 60 70 80Heating Radiant Heating
Cooling Radiant Cooling
Electricity for air and water loops Electricity for humidification
0 10 20 30 40 50 60 70 80
1
Heating Radiant Heating
Cooling Radiant Cooling
Electricity for air and water loops Electricity for humidification
R
ad
ia
n
t
fl
o
o
r
0 10 20 30 40 50 60 70 80Fresh Air Heating Radiant Heating
Fresh Air Cooling and dehumidification Radiant Cooling Electricity for air and water loops Electricity for humidification
0 10 20 30 40 50 60 70 80
1
2
Fresh Air Heating Radiant Heating
Fresh Air Cooling and dehumidification Radiant Cooling Electricity for air and water loops Electricity for humidification
R
ad
ia
n
t
ce
il
in
g
0 10 20 30 40 50 60 70 80 [kWh/m2y]Fresh Air Heating Radiant Heating
Fresh Air Cooling and dehumidification Radiant Cooling Electricity for air and water loops Electricity for humidification
0 10 20 30 40 50 60 70 80
1
[kWh/m2
y]
Fresh Air Heating Radiant Heating
Fresh Air Cooling and dehumidification Radiant Cooling Electricity for air and water loops Electricity for humidification
Table 10. Delivered energy results for the Frankfurt and Madrid locations
Frankfurt
Madrid
A
ll
-a
ir
s
y
st
em
0 10 20 30 40 50 60 70 80 90 1Air Heating Radiant Heating Air Cooling and dehumidification Radiant Cooling Electricity for air and water loops Electricity for humidification
0 10 20 30 40 50 60 70 80 90 100
1
[kWh/m2
y]
Air Heating Radiant Heating
Air Cooling and dehumidification Radiant Cooling Electricity for air and water loops Electricity for humidification
F
an
c
o
il
s
y
st
em
0 10 20 30 40 50 60 70 80 90 1Heating Radiant Heating
Cooling Radiant Cooling
Electricity for air and water loops Electricity for humidification
0 10 20 30 40 50 60 70 80 90 100
Heating Radiant Heating
Cooling Radiant Cooling
Electricity for air and water loops Electricity for humidification
R
ad
ia
n
t
fl
o
o
r
0 10 20 30 40 50 60 70 80 90 1Fresh Air Heating Radiant Heating
Fresh Air Cooling and dehumidification Radiant Cooling Electricity for air and water loops Electricity for humidification
0 10 20 30 40 50 60 70 80 90 100
1
2
Fresh Air Heating Radiant Heating
Fresh Air Cooling and dehumidification Radiant Cooling Electricity for air and water loops Electricity for humidification
R
ad
ia
n
t
ce
il
in
g
0 10 20 30 40 50 60 70 80 90 [kWh/m2y]Fresh Air Heating Radiant Heating
Fresh Air Cooling and dehumidification Radiant Cooling Electricity for air and water loops Electricity for humidification
0 10 20 30 40 50 60 70 80 90 100
1
[kWh/m2
y]
Fresh Air Heating Radiant Heating
Fresh Air Cooling and dehumidification Radiant Cooling Electricity for air and water loops Electricity for humidification
Table 11. Rome location results (baseline system and radiant floor)
System description Energy sources [kWh] Primary Energy [kWh] Energy Cost [€] CO2 emissions [kgCO2] Natural gas 8094 8094 566.58 1627 Electricity 24103 52304 3856.48 11087 All-air system (baseline) Total 60398 4989.64 12714 Natural gas 10816 Electricity 12122 Total 37120 2696.61 7750 Primary system #1
Compared to all-air system – 39% – 46% – 39%
Natural gas 5920
Electricity 11169
Total 30157 2201.50 6328
Primary system #2
Compared to all-air system – 50% – 56% – 50%
Natural gas 5920 Electricity 8709 Total 24818 1807.79 5196 Radiant floor Primary system #3
Compared to all-air system – 59% – 64% – 59%
Table 12. Results for all the locations (with the primary system #2)
Rome Milan London Frankfurt Madrid Athens Helsinki Moscow Natural gas* 8094 22514 24769 29717 12572 5369 43728 44147 Electricity§ 24103 21226 13446 18791 33939 34402 15199 17678 A ll -ai r CO2 emiss.# 12714 14289 12643 18187 19497 32041 16389 22663 Natural gas* 7872 24886 25461 31975 12076 4963 45153 46535 Electricity§ 22092 17128 10040 13357 27467 30624 9731 12300 F an co il CO2 emiss.# 11744 12881 10841 15109 16161 28559 13941 18948 Natural gas* 5920 10851 10392 12237 7999 5527 22539 25511 Electricity§ 11169 13078 9104 11729 15194 14409 11161 12600 R ad fl o o r CO2 emiss.# 6328 8197 7278 10083 9205 14079 10111 14955 Natural gas* 5574 9683 9002 10486 7296 5199 17466 18440 Electricity§ 10912 10984 8818 11071 14000 13440 10275 11286 R a d ce il in gCO 2 emiss.# 6140 7621 6836 9304 8466 13141 8648 12510 * measured in kWh § measured in kWhe # measured in kg DISCUSSION
From this study, it can be deduced that the adoption of a radiant system coupled with a suitable primary energy system, always results in a reduction of exploited energy sources, of purchased energy ware costs and of carbon dioxide emissions in comparison with an all-air system. The greatest reductions in carbon dioxide emissions (up to 60%) can be achieved in climates where the energy demand for cooling is higher than the energy demand for heating. In cold climates the reductions is smaller but always up to 20-30 %. Similar considerations can be made by comparing radiant system performance and fan coils. Since the latter has an electricity requirement always lower than an all-air system (the highest reduction can be
appreciated for Madrid location), the reductions in energy sources consumptions and CO2 emissions
achievable by a radiant system are slightly lower than in the previous cases, but still at least 30%.
ACKNOWLEDGEMENT
This work was developed as a part of a wider research contract carried out by TEBE Research Group of Politecnico di Torino about radiant system energy performances and funded by the UPONOR Italy.
REFERENCES
ASHRAE. 2009. Fundamentals volume of ASHRAE Handbook, Chapter 18: Nonresidential cooling and heating load calculations, American Society of Heating, Refrigerating and Air-Conditioning Engineers, USA.
Babiak, J, Olesen, B W and Petráš, D. 2007. Low temperature heating and high temperature cooling. RHEVA Guidebook n. 7.
Berglund, L G and Berglund, H N. 1994. Comparison of operative temperature to air temperature thermostats in a super-insulated residence with some passive solar heating. Proceeding of the Cold Climate HVAC ’94 Conference: 421-429
Causone, F, Corgnati, S P, Filippi, M and Olesen, B W. 2010a. Solar radiation and cooling load calculation for radiant systems: definition and evaluation of the Direct Solar Load. Energy and Buildings 42 (3) 2010, 305–314.
Causone, F, Corgnati, S P, Fabrizio, E and Filippi, M. 2010b. Radiant systems. Technical guide. UPONOR CEN. 2008. EN 15251. Indoor environmental input parameters for design and assessment of energy
performance of buildings addressing indoor air quality, thermal environment, lighting and acoustics. Brussels: European Standardization Committee.
Conroy, C.L. and Mumma, S.A. 2001. Ceiling radiant cooling panels as a viable distributed parallel sensible cooling technology integrated with dedicated outdoor air systems. ASHRAE Transactions 107 (1): 578-585.
Hastings, R and Wall, M (eds). Sustainable solar housing. Earthscan: Sterling (UK), 2007.
Jeong, J.-W. and Mumma, S. 2006. Designing a dedicated outdoor air system with ceiling radiant cooling panels, ASHRAE Journal, 9:56-66.
Leigh, S.B. and MacCluer C.R. 1994. A comparative study of proportional flux-modulation and various types of temperature-modulation approaches for radiant floor-heating system control, ASHRAE Transaction, vol. 100 (1): 1040-1053.
Olesen, B W. 2001. Control of floor heating and cooling systems. Proceeding of Clima 2000 Conference, Napoli.
Olesen, B W. 2002a. Control of slab heating and cooling systems studied by dynamic computer simulations, Proceedign of AICARR conference, Milano.
Olesen, B W. 2002b. Radiant floor heating in theory and practice, ASHRAE Journal 7:19–24.
Olesen, B and Mattarolo, L. 2009. Thermal comfort and energy performance of hydronic radiant cooling systems compared to convective systems, Healthy Buildings 2008, Syracuse (NY).
Simmonds, P. 1994. Control strategies for combined heating and cooling radiant systems, ASHRAE Transaction, vol. 100 (1): 1031-1039.
Simmonds, P. 1996. Practical applications of radiant heating and cooling to maintain comfort conditions, ASHRAE Transaction, vol. 102 (1): 659-666.
Simone, A. 2009. The influence of radiant temperature on peoples comfort and control of heating and cooling systems. Ph.D Thesis. Università degli Studi di Palermo (Italy).
Spitler, J D. 2009. Load Calculation Applications Manual. American Society of Heating, Refrigerating and Air-Conditioning Engineers, USA.
Strand, R K and Pedersen, C O. 2002. Modeling radiant systems in an integrated heat balance based energy simulation program, ASHRAE Transactions 108 (2):1–9.

![Table 11. Rome location results (baseline system and radiant floor) System description Energy sources [kWh] Primary Energy](https://thumb-eu.123doks.com/thumbv2/123dokorg/8183998.127357/19.892.122.791.176.528/location-results-baseline-radiant-description-energy-sources-primary.webp)
