2020-08-28T10:27:55Z
Acceptance in OA@INAF
Age of the magnetically active WW Psa and TX Psa members of the beta Pictoris
association
Title
MESSINA, Sergio; R. Santallo; T. G. Tan; P. Elliott; G. A. Feiden; et al.
Authors
10.1051/0004-6361/201628514
DOI
http://hdl.handle.net/20.500.12386/26930
Handle
ASTRONOMY & ASTROPHYSICS
Journal
601
Number
DOI:10.1051/0004-6361/201628514 c ESO 2017
Astronomy
&
Astrophysics
Age of the magnetically active WW Psa and TX Psa members
of the
β
Pictoris association
S. Messina
1, R. Santallo
2, T. G. Tan
3, P. Elliott
4,5, G. A. Feiden
6, A. Buccino
7,?, P. Mauas
7,
R. Petrucci
8,9, and E. Jofré
8,91 INAF–Catania Astrophysical Observatory, via S.Sofia, 78 95123 Catania, Italy
e-mail: [email protected]
2 Southern Stars Observatory, Pamatai, Tahiti, French Polynesia, France 3 Perth Exoplanet Survey Telescope, 6000 Perth, Australia
4 European Southern Observatory, Alonso de Cordova 3107, Vitacura Casilla 19001, Santiago 19, Chile 5 School of Physics, University of Exeter, Stocker Road, Exeter, EX4 4QL, UK
6 Department of Physics, University of North Georgia, 82 College Circle, Dahlonega, GA 30597, USA 7 Instituto de Astronomía y Física del Espacio (IAFE-CONICET), Buenos Aires, Argentina
8 Observatorio Astronómico de Córdoba, Laprida 854, X5000BGR, Córdoba, Argentina 9 Consejo Nacional de Investigaciones Científicas y Técnicas (CONICET), Argentina
Received 15 March 2016/ Accepted 13 December 2016
ABSTRACT
Context.There are a variety of different techniques available to estimate the ages of pre-main-sequence stars. Components of physical pairs, thanks to their strict coevality and the mass difference, such as the binary system analyzed in this paper, are best suited to test the effectiveness of these different techniques.
Aims.We consider the system WW Psa+ TX Psa whose membership of the 25-Myr β Pictoris association has been well established by earlier works. We aim to investigate which age-dating technique provides the best agreement between the age of the system and that of the association.
Methods.We have photometrically monitored WW Psa and TX Psa and measured their rotation periods as P = 2.37 d and P = 1.086 d, respectively. We have retrieved their Li equivalent widths from the literature and measured their effective temperatures and luminosities. We investigated whether the ages of these stars derived using three independent techniques, that is based on rotation, Li equivalent widths, and the position in the HR diagram are consistent with the age of the β Pictoris association.
Results.We find that the rotation periods and the Li contents of both stars are consistent with the distribution of other bona fide members of the cluster. On the contrary, the isochronal fitting provides similar ages for both stars, but a factor of about four younger than the quoted age of the association, or about 30% younger when the effects of magnetic fields are included.
Conclusions.We explore the origin of the discrepant age inferred from isochronal fitting, including the possibilities that either the two components may be unresolved binaries or that the basic stellar parameters of both components are altered by enhanced magnetic activity. The latter is found to be the more reasonable cause, suggesting that age estimates based on Li content are more reliable than isochronal fitting for pre-main-sequence stars with pronounced magnetic activity.
Key words. stars: activity – stars: late-type – starspots – binaries: general – stars: low-mass
1. Introduction
The two stars WW Psa and TX Psa form an interesting magneti-cally active, pre-main-sequence pair in the β Pictoris association. Thanks to their proximity to the Sun (d= 20.75 pc) and to their angular separation (ρ= 3600), both components are spatially re-solved allowing measurement of their individual physical param-eters. Considering that this system is a well established member of the β Pictoris association, whose most recent age determina-tion based on the lithium depledetermina-tion boundary (LDB) modeling is quoted as 25 ± 3 Myr (Messina et al. 2016), we explore whether a similar age for both components of this system is also retrieved by other age determination techniques based, specifically, on the
? Visiting Astronomer, Complejo Astronómico El Leoncito
oper-ated under agreement between the Consejo Nacional de Investigaciones Científicas y Técnicas de la República Argentina and the National Uni-versities of La Plata, Córdoba and San Juan.
lithium equivalent width (EW), the rotation period that we mea-sured for both components, and the position in the Hertzsprung-Russell (HR) diagram. The circumstance in which both compo-nents of the system are coeval but with different basic properties offers the advantage of putting further constraints on the age de-termination techniques.
The star WW Psa (HIP 112312, GJ 871.1 A, RA =
22:44:57.97, Dec= −33:15:01.7, J2000.0) is a very active M4V dwarf (Shkolnik et al. 2009) in the Piscis Austrinus constellation at a distance d= 20.75±0.25 pc as measured by Gaia (Gaia Col-laboration2016). Strong Ca H&K and X-ray emission were de-tected, respectively, byBeers et al.(1996) and byThomas et al.
(1998) in the ROSAT All-Sky Survey (1RXS 224457.7-331506).
Song et al.(2002) andTorres et al.(2006) have not detected the Li line in their spectra of WW Psa.
The star TX Psa (GJ 871.1 B, RA = 22:45:00.05, Dec = −33:15:25.8, J2000.0) is a very active M4.5V dwarf. Flare
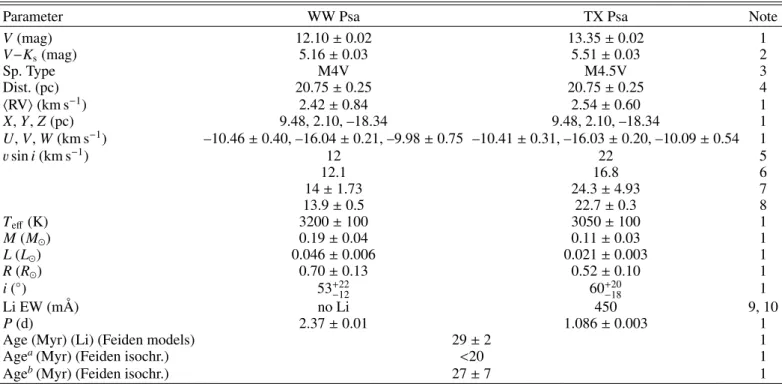
Table 1. Physical properties of WW Psa and TX Psa.
Parameter WW Psa TX Psa Note
V(mag) 12.10 ± 0.02 13.35 ± 0.02 1 V−Ks(mag) 5.16 ± 0.03 5.51 ± 0.03 2 Sp. Type M4V M4.5V 3 Dist. (pc) 20.75 ± 0.25 20.75 ± 0.25 4 hRVi (km s−1) 2.42 ± 0.84 2.54 ± 0.60 1 X, Y, Z (pc) 9.48, 2.10, –18.34 9.48, 2.10, –18.34 1 U, V, W (km s−1) –10.46 ± 0.40, –16.04 ± 0.21, –9.98 ± 0.75 –10.41 ± 0.31, –16.03 ± 0.20, –10.09 ± 0.54 1 v sin i (km s−1) 12 22 5 12.1 16.8 6 14 ± 1.73 24.3 ± 4.93 7 13.9 ± 0.5 22.7 ± 0.3 8 Teff (K) 3200 ± 100 3050 ± 100 1 M(M ) 0.19 ± 0.04 0.11 ± 0.03 1 L(L ) 0.046 ± 0.006 0.021 ± 0.003 1 R(R ) 0.70 ± 0.13 0.52 ± 0.10 1 i(◦) 53+22−12 60+20−18 1 Li EW (mÅ) no Li 450 9, 10 P(d) 2.37 ± 0.01 1.086 ± 0.003 1
Age (Myr) (Li) (Feiden models) 29 ± 2 1
Agea(Myr) (Feiden isochr.) <20 1
Ageb(Myr) (Feiden isochr.) 27 ± 7 1
Notes.(a)If single stars;(b)if unresolved binaries.
References. 1) This work; 2) 2MASS; 3)Shkolnik et al.(2009); 4) Gaia Collaboration (2016); 5)Christian & Mathioudakis(2002); 6)Torres et al.
(2006); 7)Jayawardhana et al.(2006); 8)Bailey et al.(2012); 9)Song et al.(2002); 10)Torres et al.(2006).
activity on this star was first detected by Kunkel (1972), and moderate Ca H&K emission subsequently reported by
Beers et al. (1996). TX Psa exhibits very large Li EW (450 ± 20 mÅ,Torres et al. 2006; 290 ± 30 mÅ,Song et al. 2002).
Measurements of the projected rotational velocity (see Table1) indicate that both stars are fast rotators. Indeed, WW Psa has a photometric rotation period P = 2.3546 d (Pojmanski 1997;Messina et al. 2010), as inferred from the analysis of the All Sky Automated Survey (ASAS) photometric time series and TX Psa has a rotation period P = 1.086 d as measured in the present study. Fast rotation, enhanced magnetic activity, high Li abundance (in the case of TX Psa) all suggest that these are very young stars.
Song et al. (2002), on the basis of common proper mo-tions, first proposed that WW Psa and TX Psa may be com-ponents of a binary system with angular separation ρ = 3600 (∼747 AU) and also members of the young β Pictoris association (Song et al. 2003). Membership was subsequently suggested by
Zuckerman & Song(2004),Torres et al.(2006), and finally con-firmed byShkolnik et al. (2012). Using the Gaia parallax and average radial velocities (see Table 1) we computed updated Galactic space and velocity components (see Table 1) that are consistent with those expected for β Pictoris members (see, e.g.,
Mamajek & Bell 2014), consolidating the fact that these stars are bona fide members of the β Pictoris association.
A summary of the physical properties of WW Psa and TX Psa retrieved from the literature and derived in this work is given in Table 1. One aspect that makes this system very in-teresting is the fact that its components straddle the Li deple-tion boundary of the β Pictoris associadeple-tion (e.g.,Binks & Jeffries 2014;Malo et al. 2014b;Messina et al. 2016) with the primary component WW Psa almost completely depleted and the sec-ondary component TX Psa on the Li un-depleted side of the
boundary (Li EW = 450 mÅ). Another interesting aspect con-cerns the star’s age. In fact, the isochronal age inferred by
Song et al.(2002), as well as that estimated in this work, are significantly younger than the age inferred from the ensemble members of the β Pic association, for example, 21 ± 9 Myr (Mentuch et al. 2008), 24 ± 4 Myr (Binks & Jeffries 2016), 22 ± 3 Myr (Mamajek & Bell 2014), 26 ± 3 Myr (Malo et al. 2014b), or 25 ± 3 Myr (Messina et al. 2016).
To use age-dating tecnhiques based on rotation and Li EW, which is also affected by rotation, and to compare the calculated ages with the above mentioned estimates, we have carried out a photometric monitoring campaign. This enabled us to measure the rotation period of TX Psa, and to confirm the already known rotation period of WW Psa.
2. Observations
We carried out photometric monitoring of WW Psa and TX Psa in 2014 and 2015 at three different observatories.
2.1. Siding Spring Observatory (SSO)
We observed the system with a 32-cm f/7.4 Ritchey-Chretien telescope at the Siding Spring Observatory (31◦1602400S, 149◦030 5200E, 1165 m a.s.l., Australia). The telescope is
equipped with a ST8-XME CCD camera (9 µm pixels size, and a plate scale of 0.800/pixel), has a corrected 13.60× 20.40 field
of view and mounts BVR filters. Our photometric monitoring was carried out from September 19 to November 2, 2014 for a total of 21 nights. On each night we collected on average three consecutive frames in the V filter for a total of 57 frames us-ing an integration time of 180 sec per frame. We used tasks
Table 2. Properties of the selected comparison stars.
Name RA (J2000) Dec (J2000) Vmag
C1 TYC 7501 1270 1 22:45:17.60 −33:10:43.65 13.791
C2 2MASS J22454487-3313241 22:45:44.87 −33:13:24.19 12.542
C3 TYC 7501 1081 1 22:45:40.68 −33:18:30.85 12.503
Notes.(1)FromHøg et al.(2000);(2)determined in the present work;(3)APASS (Munari et al. 2014).
within IRAF1for bias correction and flat fielding, and the tech-nique of aperture photometry to extract magnitude time series for the targets and for other stars detected in the frames, that were selected as candidate comparison stars.
We identified two stars that were found to be non-variable and were used to build an ensemble comparison (C1 and C2 in Table 2). We measured a standard deviation σC1−C2= 0.006 mag
in their differential light curve over the 21 nights. The magni-tudes of WW Psa and TX Psa were computed differentially with respect to the ensemble comparison.
After averaging the three consecutive differential magnitudes obtained on each night (collected within a time interval of about 15 min), we obtained 21 average V-band differential magnitudes for each component of the binary system for the subsequent anal-ysis. The average standard deviation associated with the nightly averaged magnitudes is σV = 0.004 mag, which we consider as
our photometric precision. 2.2. CASLEO
We had two additional nights of observation, 18 and 20 November, 2014, at the Complejo Astronómico El Leoncito (CASLEO) Observatory (31◦4705700S, 69◦180 1200W, 2552 m
a.s.l., San Juan, Argentina). We used the Horacio Ghielmetti Telescope (THG) which is a 40-cm f/8 remotely-operated MEADE-RCX 400 Ritchey-Chretien telescope, equipped with an Apogee Alta U16M camera and Johnson UBVRI and Clear filters. The CCD has 4096 × 4096 pixels, 9 µm pixel size, a plate scale of 0.5700/pixel, and a 490× 490field of view (Petrucci et al.
2013). We used the B, V, R, and I filters and collected a total of 37 frames per filter. Data reduction and magnitude extraction were carried out as outlined in Sect. 2.1. Only V filter data were used together with V filter data from SSO for the subsequent analysis. The standard deviation of the averaged nightly magni-tudes is σV = 0.004 mag, which we consider as our photometric
precision.
2.3. PEST observatory
The most recent data were collected at the Perth Exoplanet Sur-vey Telescope (PEST) Observatory (31◦580 S, 115◦470 E, 24 m a.s.l., Perth, Australia). We used the 30-cm f/10 Meade LX200 SCT telescope with focal reducer yielding f/5 equipped with a SBIG ST-8XME CCD camera and a filter wheel loaded with BV(RI)c and Clear filters. Focusing was computer controlled
with an Optec TCF-Si focuser. The image scale obtained is 1.200/pixel and the field of view is 310× 210. Observations were
collected with the Rcfilter using 120 s integration time.
Obser-vations were carried out from July 14 to September 7, 2015 for a total of 9 nights during which we achieved a total of 593 frames.
1 IRAF is distributed by the National Optical Astronomy Observatory,
which is operated by the association of the Universities for Research in Astronomy, inc. (AURA) under cooperative agreement with the Na-tional Science Foundation.
On each night WW Psa and TX Psa were observed for up to nine consecutive hours. Unlike SSO and CASLEO, frame reduction (dark subtraction and flat-fielding) and aperture photometry were carried out using an automatic pipeline based on C-Munipack (ver. 2.0.16) and optimized for PEST data. After averaging con-secutive magnitudes (collected within a time interval of about 30 min) we obtained 48 average R-band magnitudes for the sub-sequent analysis. The average standard deviation is σRc= 0.0025
mag for both targets, which we consider to be our photometric precision. Differential magnitudes of the targets were obtained using an ensemble comparison consisting of C1, C2, and C3 (see Table2).
3. Rotation period search
3.1. Photometric data
We used the Lomb-Scargle (Scargle 1982) and Clean
(Roberts et al. 1987) periodogram analyses to search for sig-nificant periodicities in the WW Psa and TX Psa photometric timeseries related to their stellar rotation periods. Use of two independent approaches allows us to be more confident in the interpretation of the results of the periodogram analysis.
The results of our analysis for WW Psa and TX Psa are plot-ted in Figs.1and3, respectively, for the data collectedat SSO and CASLEO in 2014 and in Figs. 2 and 4, respectively, for the data collected with PEST in 2015. In the top-left panels we plot the photometric timeseries versus the heliocentric Julian day (HJD), in the top-middle panel we plot the normalized Lomb-Scargle periodogram, where the red dotted line represents the spectral window function relative to the data sampling, and the horizontal dashed line indicates the power level corresponding to a false alarm probability FAP= 1%, which is the probability that a power peak of that height simply arises from Gaussian noise in the data. The FAP was estimated using a Monte-Carlo method, that is, by generating 1000 artificial light curves obtained from the real one, keeping the date but permuting the magnitude val-ues. In the top-right panel, we plot the Clean periodogram where the power peak arising from the light rotational modulation dom-inates, whereas all secondary peaks, arising from the aliasing, are effectively removed. For WW Psa, our analysis finds that the stellar rotation period is P= 2.37 ± 0.01 d in the 2014 data time series. Following the prescription ofLamm et al.(2004), the un-certainty in the period can be written as
∆P = δνP2
2 , (1)
where δν is the finite frequency resolution of the power spec-trum and is equal to the full width at half maximum of the main peak of the window function w(ν) computed together with the LS periodogram and P is the rotation period found by the LS pe-riodogram. If the time sampling is not too non-uniform, which is the case related to our observations, then δν ' 1/T , where T is the total time span of the observations. In the bottom panel, we plot the light curve phased with the rotation period. The light
Fig. 1. Top-left panel: V-band magnitude timeseries of WW Psa versus heliocentric Julian day collected at Siding Spring Observatory and CASLEO. Top-middle panel: Lomb-Scargle periodogram (solid line). The power peak corresponding to the rotation period P= 2.37 d is marked with a small red line above it. The dotted red line indicates the window spectral function, whereas the horizontal dashed line represents the power level corresponding to a FAP= 0.01. Top-right panel: clean periodogram. Bottom panel: light curve phased with the rotation period. Red bullets are data from CASLEO. The uncertainty associated with each point is smaller than the symbol size.
Fig. 2.Same as Fig.1, but with data collected at PEST Observatory.
curve of WW Psa has a peak-to-peak amplitude∆V = 0.09 mag and shows two light minima arising from active regions sepa-rated in longitude. The uncertainty associated with each point is smaller than the symbol size.
In Fig.2, we show the results for WW Psa obtained from the data collected with PEST in 2015. In this case, our analysis finds that the stellar rotation period is P = 2.346 ± 0.005 d, which is similar to the one found from the data collected in 2014.
The peak-to-peak light curve amplitude in the R band is∆R = 0.08 mag. The small difference between the two rotation peri-ods may arise either from the effect of active regions growth and decay or from presence of surface differential rotation.
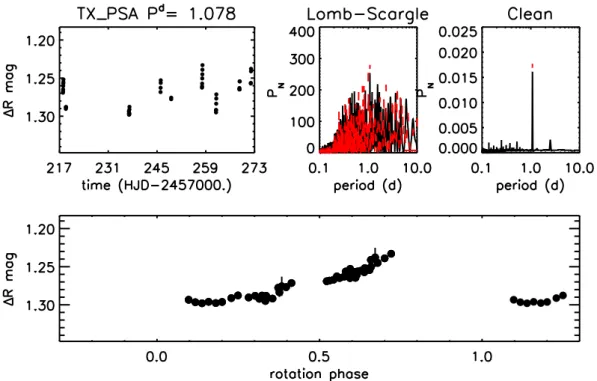
Our analysis of the TX Psa photometric time series finds that the stellar rotation period is P = 1.086 ± 0.003 d in the data collected in 2014. In Fig.3, we note that the power peak corre-sponding to the rotation period is separated by the 1d peak of
Fig. 3.Top-left panel: V-band photometric timeseries of TX Psa (bullets) versus heliocentric Julian day. Red open squares represent the C1−C2 time series. Top-middle panel: Lomb-Scargle periodogram (solid line). The power peak corresponding to the rotation period P= 1.086 d is marked with a small red line above it. The dotted red line indicates the window spectral function, whereas the horizontal dashed line represents the power level corresponding to a FAP= 0.01. Top-right panel: clean periodogram. Bottom panel: light curve phased with the rotation period. Red bullets are data from CASLEO.
Fig. 4.Same as Fig.3, but with data collected at PEST Observatory.
the spectral window function, and is preserved after cleaning by the CLEAN algorithm. The light curve of TX Psa in 2014 had a peak-to-peak amplitude of∆V = 0.04 mag.
In Fig.4we show the results for TX Psa obtained from the data collected with PEST in 2015. In this case, our analysis finds that the stellar rotation period is P = 1.078 ± 0.006 d, which is in agreement with the one found in 2014. The phased light curve from PEST shows that data is not available at some parts of the phase. So ∆R might actually be larger than 0.07 mag.
The comparison between this peak-to-peak amplitude and that measured in 2014 (∆V = 0.03 mag) denotes a significant in-crease in the activity level. Moreover, we note that the amplitude of spot induced photometric variability in the V-band is larger than that in the R-band.
3.2. Spectroscopic data
We retrieved a series of high-precision radial velocity mea-surements of both components from Bailey et al. (2012). The
Fig. 5.Top-left panel: radial velocity of TX Psa versus heliocentric Julian day. Top-middle panel: Lomb-Scargle periodogram (solid line) with indication of the power peak corresponding to the rotation period P= 1.080 d. The dotted red line indicates the window spectral function, whereas the horizontal dashed line represents the power level corresponding to a FAP= 0.02. Top-right panel: clean periodogram. Bottom panel: RV curve phased with the rotation period. The red solid line represents the sinusoidal fit with the rotation period.
average values are hRVi= 3.09 ± 0.13 km s−1and hRVi= 2.03 ±
0.17 km s−1 for WW Psa and TX Psa respectively. The mea-sured dispersions have the same order of magnitude as those arising from magnetic activity jitters at infrared wavelengths (Bailey et al. 2012). We performed Lomb-Scargle and Clean pe-riodogram analyses of these series. Whereas, in the case of WW Psa, our analysis did not find any evidence of significant peri-odicity at confidence levels larger than 80%; in the case of TX Psa, we detected a power peak at P= 1.081 ± 0.005 at 99% con-fidence level. When RV values are phased with this period (see Fig.5), we find a peak-to-peak amplitude of 0.48 km s−1against an average precision of 0.06 km s−1. The similarity between this
period and the rotation period (actually, in the case of Lomb-Scargle the RV and photometric periods are equal), suggests that the radial velocity variation is induced by the stellar activity.
4. The targets’ physical properties
We used literature optical and IR photometry to build the observed spectral energy distribution (SED). In the case of WW Psa, we retrieved Near-UV and Far-UV magni-tudes from GALEX (Bianchi et al. 2011), UBVRI magni-tudes from Koen et al. (2010), JHK magnitudes from the 2MASS point source catalog (Cutri et al. 2003), and W1–W4 magnitudes from ALLWISE (Cutri et al. 2013). In the case of TX Psa, we retrieved near-UV and far-UV magnitudes from GALEX (Bianchi et al. 2011), BVRI magnitudes from
Casagrande et al. (2008) and Koen et al. (2010), JHK magni-tudes from the 2MASS point source catalog (Cutri et al. 2003), and W1−W4 magnitudes from ALLWISE (Cutri et al. 2013).
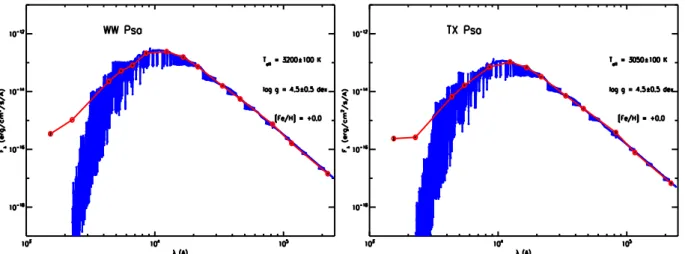
The SEDs were fitted using the Virtual Observatory SED Analyser (VOSA; Bayo et al. 2008) with a grid of theoretical spectra from the BT-NextGen Model (Allard et al. 2012) with effective temperatures ranging from 2700 K to 4000 K, surface
gravities from log g= 3 dex to log = 5 dex and fixing the metal-licity to the average value [Fe/H] = +0.0 dex observed among other members of the same association (see, e.g.,Mentuch et al. 2008) using solar abundances revised byAsplund et al.(2009). The best fit by means of a χ2 minimization is obtained with
a model of Teff = 3200 ± 100 K and log g = 4.5 ± 0.5 dex
for WW Psa, whereas for TX Psa with a model of Teff =
3050 ± 100 K and log g = 4.5 ± 0.5 dex (see Fig.6). For both targets we find no evidence of IR excess, whereas a significant far- and near-UV flux excess is observed. Owing to their excess, fluxes in the U, near-UV, and far-UV bands were excluded from the fitting procedure.
5. Age of the system
In recent years a number of studies have provided es-timates for the age of the β Pictoris association (see,
Macdonald & Mullan 2010;Malo et al. 2014b;Mamajek & Bell 2014;Binks & Jeffries 2016;Messina et al. 2016). The ages es-timated from these studies range from 21 to 26 Myr, with the most recent estimate of 25 ± 3 Myr by Messina et al. (2016) based on the LBD modeling after decorrelating the Li EW from the effects of stellar rotation. Only the estimate of 40 Myr by
Macdonald & Mullan(2010) significantly deviates from the av-erage. In this study we intend to explore whether the ages of both WW Psa and TX Psa are consistent with the β Pictoris associa-tion average of 25±3 Myr based on three independent age-dating techniques; namely Li EW, rotation rates and position in the HR diagram.
5.1. Age from lithium abundance
The Li abundance is the first age dependent quantity that we exploit to infer the age of WW Psa and TX Psa. To date, the fit of the LDB represents the most reliable absolute age-dating
Fig. 6.Spectral energy distributions of WW Psa and TX Psa. Red bullets are the observed fluxes, whereas the blue line represents the BT-NextGen best fit models as found by VOSA analysis.
Fig. 7. Left panel: distribution of Li EW among members of the β Pictoris association with WW Psa and TX Psa marked in red. Right panel:
Li EWs for WW Psa and TX Psa with Li depletion models (solid lines) taken from Feiden (2016) corresponding to the ages of 27 Myr and 30 Myr.
technique.Messina et al.(2016) measured an age of 25 ± 3 Myr for the β Pictoris association by fitting the hot side of the LDB, using the Dartmouth models ofFeiden(2016) that include the effects of magnetic fields. Whereas inMessina et al.(2016) all bona-fide members were considered, WW Psa and TX Psa in-cluded, in this investigation we check whether the ages of the individual stars WW Psa and TX Psa are in agreement or not with the age inferred for the whole association.
In the left panel of Fig.7, we note that WW Psa is in the re-gion of the Li EW distribution occupied by completely depleted stars, whereas the lower-mass component TX Psa is in the re-gion occupied by un-depleted stars. In the right panel of Fig.7, we compare the Li EW of both components with the predictions of the Dartmouth evolutionary models. These models were com-puted for solar metallicity and for an equipartition magnetic field strength in the range 2500 < hB feqi< 3000 G. Model effective
temperatures were transformed into V−Kscolors using the
em-pirical Teff − V − Ks relation from Pecaut & Mamajek (2013)
valid for young 5–30 Myr stars. Then, to make the compari-son with the observations, we transformed the model Li abun-dance into Li EW. For this purpose, we have used the curves of growth fromZapatero Osorio et al.(2002). They are valid in the effective temperature range 2600 < Teff < 4100 K and for
1.0 < A(Li) < 3.4. A more detailed discussion on the model-ing with theFeiden(2016) and theBaraffe et al.(2015) models is given in Messina et al. (2016). We find that the observed Li EWs are best fitted by evolutionary models in the age range from
27 Myr to 30 Myr. We refer the reader toMessina et al.(2016) for a more detailed discussion of LDB modeling.
This age inferred from LDB fitting is slightly older but still comparable within the uncertainties with the age of the whole association. However, it is worth noticing the extreme model dependency of such ages. In fact, if one instead adopts non-magnetic models then a much younger age is derived (see e.g.,
Messina et al. 2016).
We note that rotation has a key role in the Li depletion mechanism. First, Soderblom et al. (1993) using the projected rotational velocity of 125-Myr Pleiades members found strong evidence that fast rotators are less depleted than slow rota-tors. Similar results have been recently found byBouvier et al.
(2016) in the young 4-Myr NGC 2264 open cluster. The same Li depletion-rotation connection has been found byMessina et al.
(2016) among the members of the β Pictoris association. In that study such correlation is, however, only well established for the β Pictoris members on the hot side of the LDB. On the contrary, in the Li gap and in the cool side of the LDB, where WW Psa and TX Psa are positioned, the significance of this correlation is not large. Therefore, the possible impact of rotation on the Li EW difference found between WW Psa and TX Psa cannot yet be firmly established and the fitted values of Li EW are the ob-served ones, not decorrelated from rotation. It is worth noting that contrary to the observational evidence, theoretical studies (Eggenberger et al. 2012) predict that the inclusion of rotation
Fig. 8.Distribution of rotation periods of single stars and components of wide binary/triple systems in β Pictoris association. Circled symbols are stars hosting a debris disk. The filled blue squares indicate the positions of WW Psa and TX Psa. Solid and dotted lines represent polynomial fits to the median period distribution and to its upper and lower boundaries (fromMessina et al. 2017b).
results in a global increase of the lithium depletion during the pre-main-sequence.
5.2. Age from stellar rotation
Stellar rotation is the second age dependent parameter that we use to check if the rotation periods of WW Psa and TX Psa are consistent with those of other members of the β Pictoris associ-ation. Low-mass stars in young clusters and associations exhibit a distribution of rotation periods that primarily depends on age, mass, and among other factors on the initial rotation period and the disk lifetime. Starting from the higher-mass F and G stars, the width of the period distribution progressively decreases as far as the age increases (see, e.g., Mamajek & Hillenbrand 2008), by an age of about 0.6 Gyr a one-to-one correspon-dence is reached between mass and rotation period (see, e.g.,
Delorme et al. 2011).
This means that at the age of β Pictoris the distribution of rotation periods overlaps with the period distributions of other clusters and associations either younger or older by few tens of Myr. In contrast to the technique based on the LDB, owing to the width of period distribution at any given mass and the uncer-tainty associated with the age of the benchmark association and clusters, a precise absolute age measurement of WW Psa and TX Psa based on rotation period is not possible. Nonetheless, we can check whether their rotation periods fall within the distribution of all other bona-fide members or are outliers.
In Fig.8, we plot the period distribution of single stars and wide (separation >80 AU) components of binary or triple systems that are all members of the β Pictoris association.
Messina et al.(2017b) found that components of binary and mul-tiple systems with separation larger than 80 AU have a rotation period distribution indistinguishable from that of single stars.
Rotation periods and single or binary nature are retrieved from the catalog of rotation periods of β Pic members (Messina et al. 2017a). We see that the rotation periods of WW Psa and TX Psa fall on the distribution’s lower boundary separating slow rotating single stars and wide components of binary and mul-tiple systems from fast rotating close binary systems (separa-tion <80 AU). Considering that the radii of WW Psa and TX Psa are still contracting and, consequently, their rotation periods are spinning up, the rotation tells us that the system may have an age slightly older but still compatible with that of the β Pictoris asso-ciation, if they are effectively single stars. However, since WW Psa and TX Psa also fall on the upper boundary of the distribu-tion of close binary and multiple members, we may be dealing with two components that are themselves unresolved close bi-naries. Therefore, the rotation periods of WW Psa and TX Psa are compatible with those of other bona fide members, although there is some hint of a possible unresolved binary nature of both components.
5.3. Age from isochrone fitting
Luminosity and effective temperature are the last age dependent quantities that we fit with isochrones to infer the age of WW Psa and TX Psa. The observed magnitude, distance, and bolo-metric correction are used to derive the luminosity that, together with the effective temperature, allows us to compare the posi-tions of both components on the Hertzsprung-Russell (HR) di-agram with isochrones from different evolutionary models. We adopt for WW Psa and TX Psa the most recent trigonometric distance d = 20.75 ± 0.25 pc provided by Gaia (Gaia collabo-ration2016). Using their brightest (and presumably unspotted) observed magnitudes V = 12.10 ± 0.02 mag and V = 13.35 ± 0.02 mag (derived from ASAS time series;Pojmanski 2002), and
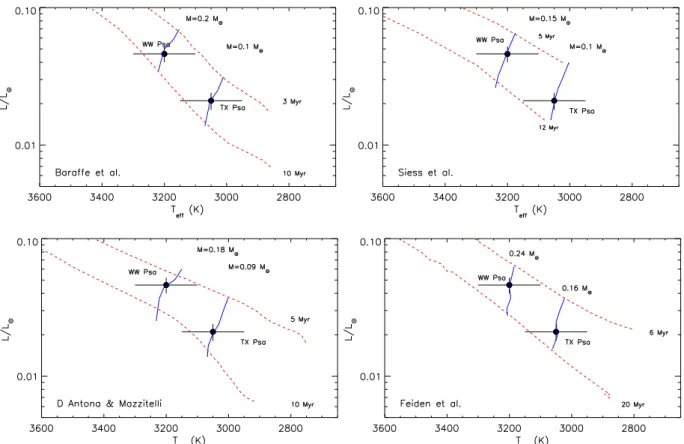
Fig. 9.The HR diagrams. Dashed lines are isochrones whereas blue solid lines are the evolutionary tracks. Models are from Baraffe et al. (2015)
(top left panel), Siess et al. (2000) (top right panel), D’Antona & Mazzitelli (1997) (bottom left panel), and Feiden et al. (2016) (bottom right panel).
the bolometric corrections BCV= −2.43 ± 0.05 mag and BCV=
−2.82 ± 0.05 mag, taken fromPecaut & Mamajek (2013) and corresponding to effective temperatures inferred from the SED fits (see Sect. 4), we infer the luminosities L= 0.046 ± 0.006 L
and L = 0.021 ± 0.003 L respectively (adopting Mbol, =
4.74 mag and Teff = 5777 K fromCox 2000).
In Fig.9, WW Psa and TX Psa are compared with a grid of isochrones and mass evolutionary tracks taken from di ffer-ent evolutionary models. We find that both componffer-ents have an age in the range 3–10 Myr according toBaraffe et al.(2015), in the range 5–12 Myr according toSiess et al.(2000), in the range 5–10 Myr accorging to D’Antona & Mazzitelli (1997), and in the range 6–20 Myr according toFeiden(2016). Only the Dart-mouth models ofFeiden(2016), where also the effects of
mag-netic fields are included, predict an older age but not older than 20 Myr. The inferred masses, as typed in Fig.9, are in the range 0.15–0.24 M for WW Psa and in the range 0.09–0.16 M for
TX Psa, depending on the adopted model.
All models provide ages significantly younger than the quoted 25 ± 3 Myr age of the β Pic association. The discrep-ancy is only partly mitigated in the Dartmouth models, show-ing that the magnetic fields play some role in these very ac-tive stars through inhibition of stellar convection, which results in stars with larger radius and higher luminosity at a given age, with respect to non-active stars. This residual age discrep-ancy suggests that some other physics, such as starspots (e.g.,
Somers & Pinsonneault 2015;Jackson & Jeffries 2014) is prob-ably missing in the stellar evolution models. We note that the po-sition in the HR diagram of WW Psa and TX Psa, which makes them to appear over luminous with respect to the adopted age of 25 ± 3 Myr, is not peculiar of these stars but also shared by other β Pictoris members of similar effective temperatures (see, e.g., Fig. 4 inMessina et al. 2016).
5.4. Unresolved binary hypothesis
We investigate the possibility that WW Psa and TX Psa may be unresolved binary stars using the available information from RV measurements and imaging. The radial velocities of both components have been monitored quite extensively.Elliott et al.
(2014) measured the RV for both components. Here, we report the updated values hRVi = 0.95 ± 1.35 km s−1 and hRVi = 3.2 ± 1.0 km s−1 for WW Psa and TX Psa, respectively, which
were re-calculated using an M dwarf mask that improved the cross-correlation-function fit with respect toElliott et al.(2014). Briefly, the CORAVEL-type numerical mask was originally cre-ated from a stellar spectrum. The spectrum is converted to a nu-merical mask so that the continuum has a value of 0 and the ab-sorption lines have the value one at their peak. The mask is then convolved with the observed spectrum of desired target to create the cross correlation function. The quoted uncertainties are cal-culated from the standard deviation of individual radial velocity measurements, as opposed to direct measurement uncertainties. It is true that the associated uncertainties are larger than those presented inElliott et al. (2014). However, from the recalcula-tion of the radial velocities using the M-type template there was more variability in the resultant values. This could be explained by a better match of the numerical mask with the observed spec-tra combined with the effect of star spots that can mimic radial velocity variance (seeLagrange et al. 2013).
From the literature we retrieved the following RV mea-surements for WW Psa: RV = 2.2 km s−1 (Torres et al. 2006);
the average values hRVi = 3.087 ± 0.134 km s−1 (Bailey et al. 2012); RV= 3.2 ± 0.5 km s−1 (Shkolnik et al. 2012) and RV = 2.9 ± 0.6 km s−1 (Malo et al. 2014a). Whereas for TX Psa
we retrieved: RV = 2.4 km s−1 (Torres et al. 2006); hRVi = 2.031 ± 0.168 km s−1 (Bailey et al. 2012); RV = 2.2 km s−1
2 4 6 8 10 log P (day) 0.01 0.1 1 Mass-ratio
0.1 1 10 Phys. sep. (au)100 1000 10000 100000
2 4 6 8 10 log P (day) 0.01 0.1 1 Mass-ratio
0.1 1 10 Phys. sep. (au)100 1000 10000 100000
Fig. 10. Companion detection probabilities (contours from red (100%), to white (0%), in 5% color levels) for WW Psa (left) and TX Psa (right)
with mass ratio versus orbital period (day)/physical separation (AU). We note that both x- and y-scales are logarithmic.
(Delorme et al. 2012). Based on these measurements, we have the following average values hRVi = 2.42 ± 0.84 km s−1 for
WW Psa and hRVi= 2.54 ± 0.60 km s−1and for TX Psa. Both standard deviations are larger than the uncertainties associated with the single measurements and, as discussed earlier, also larger than the expected RV variations due to jitters generated by the magnetic activity, which in the infrared are of the or-der of 0.15 km s−1. However, the possibility of Keplerian origin of the low-amplitude RV variations remains quite marginal. In fact,Elliott et al.(2014), from a study of hundreds of stars, find a standard deviation of 3 km s−1 as the criterion for significant
radial velocity variation.
Both components have also been observed with high-spatial resolution high-contrast imaging. Delorme et al. (2012) ob-served both components with NACO/VLT finding no presence of companions at mass ratios larger than about 0.1 and at a projected separation larger than about 10 AU (or less for TX Psa). Similar results were achieved by Biller et al. (2013) and
Elliott et al.(2015) who observed TX Psa with NICI/Gemini and
NACO/VLT, respectively.
In Fig.10, we plot the detection limits from simulated bina-ries (dark red is 100% detection, white is 0%) as a function of separation and mass ratio for WW Psa (left) and TX Psa (right). The companions would therefore have to have a mass-ratio < 0.1 (or a separation smaller than ∼10 AU for WW Psa and smaller than ∼1 AU for TX Psa) for them to be missed so far, whereas it is unlikely that the companions are equal mass. Detection limits from RV measurements were derived using multi-epoch obser-vations followingTokovinin(2014). For high-contrast imaging, we converted the angular separation-versus-contrast to physical separation-versus-mass ratio, using the targets distance and the evolutionary models ofBaraffe et al.(2015). We used the detec-tion limits described inElliott et al.(2016); combining 2MASS photometry (Cutri et al. 2003) and proper motions (UCAC4, PPMXL, NOMAD: Zacharias et al. 2013, 2004; Roeser et al. 2010), for the widest parameter space (>300).
The single nature of WW Psa and TX Psa is supported also by considerations concerning the position in the HR di-agram and the photometric behavior. In Fig.11 we plot the luminosities of WW Psa and TX Psa, after correction of the observed magnitude by ∆V = 0.75 mag assuming both stars consist of unresolved equal-mass components. The isochronal fitting was carried out using the same models mentioned in the previous Sect. 5.3. We find that depending on which model
is adopted amongBaraffe et al.(2015),Siess et al.(2000), and
D’Antona & Mazzitelli(1997), the ages of both components can be older than about 6 Myr but not older than 20 Myr. The Dart-mouth models provide the best fit with an age of 27 ± 7 Myr, in agreement with the estimated age of the association, despite the quite large uncertainty.
Therefore, the ages of these stars estimated from isochronal fitting with Baraffe et al., Siess et al., and D’Antona & Mazzitelli models are still much younger than the age of the β Pictoris as-sociation. An agreement is found only with the magnetic Dart-mouth models, but with the unlikely assumption of equal-mass components. Assuming a mass ratio <0.1, also the Dartmouth models predict too young ages. Concerning the photometric be-havior, equal-mass components would exhibit similar levels of magnetic activity and likely would equally contribute to the ob-served variability making both rotational periods to appear in the periodogram. On the contrary, we detected only one period. Therefore, the secondary undetected components should have lower luminosities giving a negligible contribution to the ob-served variability. We note that, if the secondary components have lower masses and, therefore, redder colors, then the pri-maries should be slightly bluer than observed. This circumstance would shift the position of WW Psa and TX Psa in the period-color diagram toward bluer V−Ks color, positioning both stars
in the region occupied by close binary systems (see Fig. 7). This would better fit the rotational properties of both components that are on the boundary between single and close binaries in the period-color diagram.
To summarize, assuming that WW Psa and TX Psa are unre-solved close binaries with mass-ratio <0.1 results in better agree-ment with the quoted age of the β Pictoris association. How-ever, even in this hypothesis both stars remain more luminous or cooler than predicted by a 25-Myr isochrone.
5.5. Effects by spots hypothesis
Both stars are very active as demonstrated by the significant NUV and FUV flux excesses and by the photometric variabil-ity. The maximum amplitude of the photometric variability mea-sured in our campaign is∆V = 0.09 mag and ∆V = 0.07 mag for WW Psa and TX Psa, respectively.
These amplitudes provide a lower limit to the fraction of stel-lar photosphere covered by spots, since additional spots evenly distributed in longitude might be present, without contributing to
Fig. 11.As in Fig.9, but where WW Psa and TX Psa are considered as primary components of unresolved systems with equal-mass components. the light rotational modulation but increasing the total covering
fraction. The inclination of the stellar rotation axis can also keep the observed variability at a low level, even in the cases when the covering fraction is significant.
For WW Psa we derive (from luminosity and effective tem-perature) a stellar radius R = 0.70 ± 0.13 R that combined
with the stellar rotation period P = 2.37 ± 0.01 d provides the inclination of the stellar rotation axis i◦ = 53+22−12 (adopting hv sin ii = 12 ± 1.1 km s−1; see Table1).
Similarly, for TX Psa we derive a stellar radius R= 0.52 ± 0.10 R that combined with the rotation period P = 1.086 ±
0.003 d gives an inclination of the stellar rotation axis i◦= 60+20 −18
(adopting hv sin ii= 21±3 km s−1; see Table 1). Uncertainties on
radius and inclination are computed according to the propagation of error on all involved quantities.
The two components of this physical pair are found to have similar inclinations of their rotation axes that act to reduce any spot’s visibility and, consequently, the amplitude of the rota-tional modulation. Therefore, both components may have a sig-nificant fraction of their photosphere covered by spots while still producing a light curve amplitude not larger than∆V = 0.09 mag and∆V = 0.07 mag for each component, respectively.
In a recent series of papers by Somers & Pinsonneault (see, e.g.,Somers & Pinsonneault 2015) the impact of starspot activ-ity on the mass and age of pre-main-sequence stars as inferred from isochronal fitting were investigated. Their models demon-strate that when a significant fraction of the surface is covered in starspots, stars are displaced toward lower masses and e ffec-tive temperatures in a HR diagram. As a consequence, spotted stars appear younger and less massive than they effectively are. According to their predictions, in the case of WW Psa, the de-rived mass should be increased by a factor from 1.3 to 2.0 and its age by a factor from 1.8 to 6.0 if the covering fraction ranges
from 15% to 50% at an age of 10 Myr. Such correction factors decrease at increasing age.
The use of the Dartmouth models that incorporate the effects of magnetic fields mitigates the age discrepancy, indicating that magnetic activity in these stars might plays some role in altering basic parameters such as effective temperature and luminosity. However, these models do not provide the expected ages of these very red stars.
6. Conclusions
We have carried out a multi-site multi-epoch photometric mon-itoring campaign of WW Psa and TX Psa. This monmon-itoring has allowed us to confirm the already known rotation period of WW Psa and to measure for the first time the rotation period of TX Psa (P = 1.086 d). Moreover, we estimated effective tempera-tures of both components by fitting stellar atmospheric models to the SEDs using archival optical and near-IR photometry. We explore if the measured rotation periods, the Li EW available from the literature, and position on the HR diagram, which are all age dependent, are consistent with the age of 25 Myr of the β Pic association inferred by, for example,Messina et al.(2016) with the LDB fitting technique. We find that both the rotation periods, which are compared with the period distribution of the other association bona fide members, and the Li EWs, which are compared with the evolutionary models of Feiden(2016), are similar to the values measured in equal-mass members of the β Pictoris association. On the contrary, the isochronal fitting of luminosities and effective temperatures in the HR diagram in-fer an age for this system significantly younger than the quoted age of 25 Myr. We probe the possibility that the discrepancy may arise from unresolved binary nature of both components. How-ever, this possibility is supported neither by RV studies nor from imaging and simulations nor from the photometric variability
behavior. The use of models that incorporate the effects of mag-netic fields significantly mitigates the age discrepancy. However, since the discrepancy still remains, we conclude that some other physics not taken into account plays a key role in determining the observed luminosity and temperature effective of these very low mass stars.
Acknowledgements. Research on stellar activity at INAF- Catania Astrophysical Observatory is supported by MIUR (Ministero dell’Istruzione, dell’Universitá e della Ricerca). This research has made use of the Simbad database, operated at CDS (Strasbourg, France). This publication makes use of VOSA, developed un-der the Spanish Virtual Observatory project supported from the Spanish MICINN through grant AyA2011-24052. SM thanks Lison Malo for providing updated values of space and velocity components. We are especially grateful to the ref-eree whose comments helped us to significantly improve our analysis and the paper quality.
References
Allard, F., Homeier, D., & Freytag, B. 2012,Phil. Trans. R Soc. Lond. Ser. A, 370, 2765
Asplund, M., Grevesse, N., Sauval, A. J., & Scott, P. 2009,ARA&A, 47, 481
Bailey, III, J. I., White, R. J., Blake, C. H., et al. 2012,ApJ, 749, 16
Baraffe, I., Homeier, D., Allard, F., & Chabrier, G. 2015,A&A, 577, A42
Bayo, A., Rodrigo, C., Barrado Y Navascués, D., et al. 2008,A&A, 492, 277
Beers, T. C., Rossi, S., Ulrich, D., & Wilhelm, R. 1996,AJ, 112, 1188
Bianchi, L., Kang, Y. B., Efremova, B., et al. 2011,Ap&SS, 335, 249
Biller, B. A., Liu, M. C., Wahhaj, Z., et al. 2013,ApJ, 777, 160
Binks, A. S., & Jeffries, R. D. 2014,MNRAS, 438, L11
Binks, A. S., & Jeffries, R. D. 2016,MNRAS, 455, 3345
Bouvier, J., Lanzafame, A. C., Venuti, L., et al. 2016,A&A, 590, A78
Casagrande, L., Flynn, C., & Bessell, M. 2008,MNRAS, 389, 585
Christian, D. J., & Mathioudakis, M. 2002,AJ, 123, 2796
Cox, A. N. 2000, Allen’s astrophysical quantities (New York: AIP Press; Springer)
Cutri, R. M., Skrutskie, M. F., van Dyk, S., et al. 2003, in the IRSA 2MASS All-Sky Point Source Catalog, NASA/IPAC Infrared Science Archive Cutri, R. M., et al. 2013, VizieR Online Data Catalog: II/328
D’Antona, F., & Mazzitelli, I. 1997, Mem. Soc. Astron. Ital., 68, 807
Delorme, P., Collier Cameron, A., Hebb, L., et al. 2011,MNRAS, 413, 2218
Delorme, P., Lagrange, A. M., Chauvin, G., et al. 2012,A&A, 539, A72
Eggenberger, P., Haemmerlé, L., Meynet, G., & Maeder, A. 2012,A&A, 539, A70
Elliott, P., Bayo, A., Melo, C. H. F., et al. 2014,A&A, 568, A26
Elliott, P., Huélamo, N., Bouy, H., et al. 2015,A&A, 580, A88
Elliott, P., Bayo, A., Melo, C. H. F., et al. 2016,A&A, 590, A13
Feiden, G. A. 2016,A&A, 593, A99
Gaia Collaboration (Brown, A. G. A., et al.) 2016,A&A, 595, A2
Høg, E., Fabricius, C., Makarov, V. V., et al. 2000,A&A, 355, L27
Jackson, R. J., & Jeffries, R. D. 2014,MNRAS, 445, 4306
Jayawardhana, R., Coffey, J., Scholz, A., Brandeker, A., & van Kerkwijk, M. H. 2006,ApJ, 648, 1206
Koen, C., Kilkenny, D., van Wyk, F., & Marang, F. 2010,MNRAS, 403, 1949
Kunkel, W. E. 1972, Information Bulletin on Variable Stars, 748 Lagrange, A.-M., Meunier, N., Chauvin, G., et al. 2013,A&A, 559, A83
Lamm, M. H., Bailer-Jones, C. A. L., Mundt, R., Herbst, W., & Scholz, A. 2004,
A&A, 417, 557
Macdonald, J., & Mullan, D. J. 2010,ApJ, 723, 1599
Malo, L., Artigau, É., Doyon, R., et al. 2014a,ApJ, 788, 81
Malo, L., Doyon, R., Feiden, G. A., et al. 2014b,ApJ, 792, 37
Mamajek, E. E., & Bell, C. P. M. 2014,MNRAS, 445, 2169
Mamajek, E. E., & Hillenbrand, L. A. 2008,ApJ, 687, 1264
Mentuch, E., Brandeker, A., van Kerkwijk, M. H., Jayawardhana, R., & Hauschildt, P. H. 2008,ApJ, 689, 1127
Messina, S., Desidera, S., Turatto, M., Lanzafame, A. C., & Guinan, E. F. 2010,
A&A, 520, A15
Messina, S., Lanzafame, A. C., Feiden, G. A., et al. 2016,A&A, 596, A29
Messina, S., Millward, M., Buccino, A., et al. 2017a,A&A, 600, A83
Messina, S., Lanzafame, A. C., Malo, L., et al. 2017b, A&A, submitted Pecaut, M. J., & Mamajek, E. E. 2013,ApJS, 208, 9
Petrucci, R., Jofré, E., Schwartz, M., et al. 2013,ApJ, 779, L23
Pojmanski, G. 1997,Acta Astron., 47, 467
Pojmanski, G. 2002,Acta Astron., 52, 397
Roberts, D. H., Lehar, J., & Dreher, J. W. 1987,AJ, 93, 968
Roeser, S., Demleitner, M., & Schilbach, E. 2010,AJ, 139, 2440
Scargle, J. D. 1982,ApJ, 263, 835
Shkolnik, E., Liu, M. C., & Reid, I. N. 2009,ApJ, 699, 649
Shkolnik, E. L., Anglada-Escudé, G., Liu, M. C., et al. 2012,ApJ, 758, 56
Siess, L., Dufour, E., & Forestini, M. 2000,A&A, 358, 593
Soderblom, D. R., Jones, B. F., Balachandran, S., et al. 1993,AJ, 106, 1059
Somers, G., & Pinsonneault, M. H. 2015,ApJ, 807, 174
Song, I., Bessell, M. S., & Zuckerman, B. 2002,ApJ, 581, L43
Song, I., Zuckerman, B., & Bessell, M. S. 2003,ApJ, 599, 342
Thomas, H.-C., Beuermann, K., Reinsch, K., et al. 1998,A&A, 335, 467
Tokovinin, A. 2014,AJ, 147, 86
Torres, C. A. O., Quast, G. R., da Silva, L., et al. 2006,A&A, 460, 695
Zacharias, N., Urban, S. E., Zacharias, M. I., et al. 2004,AJ, 127, 3043
Zacharias, N., Finch, C. T., Girard, T. M., et al. 2013,AJ, 145, 44
Zapatero Osorio, M. R., Béjar, V. J. S., Pavlenko, Y., et al. 2002,A&A, 384, 937