How much Globalization is there in the World Stock Markets
and where is it?
Gianni Nicolini
University of Rome “Tor Vergata” Faculty of Economics Researcher in Banking and Finance
Ekaterina Dorodnyk University of Rome “Tor Vergata”
Faculty of Economics
PhD in Banking and Finance – PhD Candidate [email protected]
ABSTRACT
Globalization, as the process of integration of national economies into
the international economy through trade, foreign direct investment,
capital flows, migration and the spread of technology, has been
analyzed by academic literature in different manners. Anyway a
comprehensive analysis in a worldwide perspective that compares all
the main stock markets' performances in a long term period misses.
In this paper, the authors try to fill this gap by a correlation analysis
applied to stock exchange market indexes. This methodology is
implemented in order to highlight the dynamic trend of financial
market globalization. The paper investigates the degree of association
of weekly returns for 53 international stock exchanges from 1995 to
2010 in a year-by-year approach, trying to evaluate how the average
correlation through national stock indexes changed by the time.
Moreover, an analysis of single geographical areas (North America
and Canada, Latin America, Asia and Oceania, Northern Europe,
Eastern Europe and Western Europe) has been done in order to test
the hypothesis that globalization follows a homogenous (or
heterogeneous) path. Results suggest an upward globalization trend
that is developing at an increasing growth rate. Furthermore, an
analysis of single geographical areas supports the hypothesis that
globalization is a heterogeneous phenomena where different cluster of
countries are engaged in different manners.
How much Globalization is there in the World Stock Markets
and where is it?
Introduction
The effects of globalization in the world economy and its role within financial markets have been widely analysed by the literature. The pro and cons of an international economic and financial framework featured by common trends and higher similarities were considered from different perspectives. Moreover, different concepts and definitions of globalization were provided too. The hypothesis that globalization is growing within world economies is an usual approach adopted by many papers in the literature, however, papers that tried to analyse this phenomena in a comprehensive manners are just a few. Thus, if the presence of globalization in financial markets could be considered as a commonplace, the need to evaluate the relevance and the developing path of this phenomena is quite clear. If there are studies on the globalization trend, they usually analyse single areas, so differences in the data sources and in the time periods inhibit a comprehensive view of the phenomenon. In this paper the authors try to fill this gap, providing a measure of globalization within financial markets taking into account all the most relevant stock exchange indexes. Furthermore, an analysis of single geographic ares will be done in order to understand if globalization is developing as a homogeneous phenomena or globalization effects are stronger in some stock markets than others.
Data from 53 stock markets around the world are analysed by a correlation analysis. If correlation is usually considered as a basic statistical tool, it was chosen in order to minimize the hypothesis of the model, enhancing the strength of results. In fact, as the aim of the paper is not related to an explanation of globalization, but to an evaluation of the tendency of different stock markets to float in a common sense, a correlation analysis is compliant with this goal. Returns of stock indexes have been collected on a weekly basis from 1995 to 2010. Correlation matrices were estimated and summarized annually (using average indexes) in order to highlight the tendency of globalization to affect both local and global single market correlations.
The paper is organized as follows. A review of the literature on globalization and financial markets integration is provided in order to analyse this concepts and to highlight results from previous studies. A description of data and an explanation of the methodology follow, while results of the analysis will be provided and discussed in the result section. The final section hosts some conclusions and remarks.
Literature review
The meaning of “globalization” has been widely analyzed by the literature from both economic and non-economic perspectives. This huge interest on this topics and the different possible manners to analyze it suggest to point out firstly what definition of globalization and what kind of perspective will be adopted in this paper.
A wide economic definition of globalization has been done by Bhagwati (2004). The author define globalization as a process of integration of national economies into an international economy through trade, foreign direct investment, capital flows, migration and the spread of technology. The different aspects taken into account highlight how much globalization is a complex phenomena and suggest the need to focus on a specific topic. In this paper the authors will analyse the financial
aspects of globalization and they will refer to the integration of stock-exchanges. However, as Carrieri et al. (2003) pointed out, the globalization concerns both economic and financial aspects and can not be ignored that equity market integration is part of a bigger reform effort that includes the financial sector, the economy as well as political processes.
In order to analyse the financial aspect of globalization a definition of what integration means is useful. For the ECB (2005) stock market integration is the market condition where all potential market participants with the same relevant characteristics face a single set of rules when dealing with financial instruments or services, have equal access to financial instruments or services, and are treated equally when they are active in the market. If this definition could be seen as a global financial consumers perspective definition, a more country specific definition can be proposed too. Pieper and Vogel (1997), talking about integrated markets, refer to a status of markets where investors in one country can buy and sell without restriction equities that are issued in another country and so, as a result, identical securities are issued and traded at the same price across markets (after adjustment for foreign exchange rates). Hence the authors highlight the relevance of cross-country trading and recall macroeconomic principles as the “law of one price” is. Similarities with this definition of stock market integration and the definition proposed by Bekaert and Harvey (2003) exist. For these authors in integrated equity markets, domestic investors are able to invest in foreign assets and foreign investors in domestic assets; hence, assets with identical risks show the same expected return, regardless of trading location. This perspective is coherent with the concepts of integration of Bhalla and Shetty (2006). They argue that when two or more markets are integrated events in one of market will have their impacts felt in the other ones. For these authors integration should be related and measured by effectiveness of information in the price changing more than the presence of trading barriers within different exchanges.
The great interest by the literature on financial market integration and globalization is justified by the positive effects that integrated financial markets could provide. Many authors studied these effects related both to economic and financial topics. Mohan (2005) argues that efficient and integrated financial markets constitute an important vehicle for promoting domestic savings, investments and consequently economic growth. Prasad (2003) also highlights that international financial integration can promote growth in developing countries and also helps countries to reduce macroeconomic volatility, while Beck et al. (2003) support the view that better functioning financial intermediaries improve resource allocation and accelerate total factor productivity growth with positive repercussion for long-run economic growth. In a more financial perspective Erdogan (2009) provided that integrated stock markets decrease the cost of capital helping firms to solve capital raising problems. Even Trichet (2005), saying that financial market integration, by enhancing competition and efficiency of intermediaries in their operations and allocation of resources, contributes to financial stability, hopes that a more integrated international financial framework will arise. The role of stock exchanges in the financial markets and their relationship with financial market integration has been analysed too. Armanious (2005) highlighted how an increasing globalization of the world economy should obviously have an impact on the behaviour of national stock markets, which in turn will push the stock exchanges to merge together in order to make economic growth. In the meanwhile Reddy (2003) stated that financial market integration fosters the necessary condition for a country’s financial sector to emerge as an international or a regional financial centre.
If common financial market integration and, in particular, stock market integration seems to be quite desirable, the need to have some parameters in order to measure these phenomena are required as well. However, economic integration has been widely analysed by the literature and many globalization measures have been proposed but a less interest has been devoted to financial and
to use the presence of tariff barriers as a degree of economic integration within countries, while Moser et al. (2004) and Quinn and Toyoda (2008) use the presence of capital account restriction or, in the contrary, capital account liberalization rules as parameters of financial globalization. In the meanwhile Campero (2001) and Lawrence and Ishikawa (2005) evaluate economic globalization by the ratio of inward FDI stock (Foreign Direct Investments) over GDP. Even the trade openness, measured as the sum of imports and exports (excluding oil related transactions) over GDP, has been analysed as integration measure (Lane and Milesi-Ferretti 2003, Walti 2005 and Arribas et al. 2006).
Looking at financial integration and, in special manner, at stock market integration, Pagano at al. (2003) analysed the cross-listing of European companies. The authors analysed European and North American stock exchanges from 1986 to 1997, highlighting a growing trend to cross-list or to list abroad. Due the fact that cross-listing enhances the integration within markets, the ratio between the number of foreign listed firms and the domestic firms can be considered as a measure of stock market integration. Using the same parameter, Sarkissian and Schill (2004) found that about 20% of internationally listed stocks are listed in more than one foreign market, suggesting following connection between markets. The above mentioned authors analysed stock market integration from the issuers perspective while other authors tried to do it from a traders point of view, using correlations within market indexes as a parameter to evaluate the integration of financial markets. Longin and Solnik (1995) documented an increase in the correlation of stock returns for various developed markets over the 1960-1990 period. Hassan and Naka (1996) reported that in co-integrated markets, price movements in one market immediately influence other markets: this result is consistent with efficient information sharing and free access to markets by domestic and foreign investors. The same correlation approach has been used by Karolyi and Stulz (2001). The authors provide evidences that correlations between equity markets are not constant over time, reacting to market changes. Recently Schindler and Voronkova (2010) provide that co-integration relationships are much stronger between national markets within one economic and geographic region that between national markets located in different regions. Hence, the authors’ results suggest the possibility that integration could not be a homogenous path and highlight the role of geographic features. As previously mentioned, if these papers use a correlation and co-integration analysis to study the globalisation of financial markets, the difference within them in data types and market samples suggested to release this paper.
The aim of this paper is to provide some evidences on how much “globalized” are financial markets by an analysis of stock markets around the world. Using a trend analysis of correlation of stock market indexes during 1995 - 2010 period, both the level and the trend of globalization in financial market are analysed. Moreover, the comparison of different geographical areas is done in order to highlight the homogeneous (or heterogeneous) path of this phenomenon.
Data and Methodology
General price indexes of 53 national stock markets between 1995 and 2010 were used. The data source is Datastream (Thomson Financial). The weekly frequency of the data provides around 800 observations for of each index. Some indexes have less observations due the fact that they have been introduced later than 1995. The use of weekly data has been done in order to smooth data from daily noise that can not be attributed to globalization. The hypothesis is based on the idea that if globalization effect will close the gap between singles market behaviours, an idiosyncratic effect on the daily data and daily volatility can not be ignored. From the time series of price indexes continuously compounded returns for the all 53 stock indexes have been calculated as:
1 ln ln t t t P P R
Data are all in US dollars.
The list of stock market indexes and the geographic areas they belongs are reported in Table 1.
Table 1: Geographical distribution of stock market indexes
Geographical Areas Indexes
North America and Canada S&P 500 (US), NASDAQ COMPOSITE (US), NYSE COMPOSITE (US), S&P/TSX COMPOSITE (CAN);
Latin America BOVESPA (BRAZIL), MERVAL (ARGENTINA), IGBC (COLOMBIA), IPC (MEXICO), IPSA (CHILE), IGBVL (PERU);
Oceania and Asia NZSX 30 (NEW ZEALAND), S&P/ASX 200 (AUSTRALIA); SSE COMPOSITE (SHANGHAI), SZSE COMPOSITE (SHENZHEN), HANG SENG (HONG KONG), S&P CNX NIFTY 50 (NATIONAL INDIA), BSE SENSEX 100 (BOMBAY), JAKARTA COMPOSITE, TA – 100 (TEL-AVIV), NIKKEI 225 (TOKIO), FTSE ST (SINGAPORE), KOSPI (SOUTH KOREA);
Africa and Middle East EGX 30 (EGYPT), TASI (SAUDI ARABIA), FTSE/JSE TOP 40 (JOHANNESBURG);
Western Europe EURONEXT 100, BEL 20 (BRUSSELS), CAC 40 (PARIS), AEX
(AMSTERDAM), PSI-20 (LISBON), DAX (FRANKFURT), ATX (VIENNA), SMI (SWISS), FTSE MIB (MILAN), FTSE 100 (LONDON), OSEQ 20 (IRELAND), LUXX (LUXEMBOURG), ATHEX COMPOSITE (ATHENS), IBEX 35 (SPAIN), BCN GLOBAL 100 (BARCELONA), IGBM (MADRID), IGBV (VALENCIA), BILBAO 2000;
Northern Europe OMXN 40, OMX STOCKHOLM 30, OMXH25 (HELSINKI), OMX COPENHAGEN 20, OBX (OSLO);
Eastern Europe PX (CZECH REPUBLIC), WIG 20 (POLAND), BET (ROMANIA), RTS (MOSCOW), BUX (HUNGARY).
The 53 indexes represent most of the stock exchanges in the world. All the following geographic areas are represented: Europe, North America, Latin America, Africa and Middle East, Asia and Oceania. Full descriptive statistics (number of observations, minimum and maximum values, standard deviation, skewness, kurtotis and Jarque-Bera tests) are reported in the Appendix.
Data show that NYSE Composite Index (US market) and IPSA (Chile) are respectively the indexes with lowest and highest standard deviation. All indexes show negative skewness, suggesting the lack of data symmetry and indicating that left tail is longer and the mass of distribution is concentrated on the right. Nikkei 225 (Japan) demonstrate especially negative skewness. Significantly positive kurtosis is shown by all indexes, with a clear “fat tails” effect. That means a non-normal and “peaked” distribution of index returns, as Jarque-Bera test confirms.
The analysis of correlation was applied. The correlation coefficient is the common practice of measurement of stock market co-movements of stock returns in a given time period, and is widely exploited by the literature (Longin and Solnik 1995, Hassan and Naka 1996, Karolyi and Stulz 2001, Wälti 2006, Schindler and Voronkova 2010). According to the Pearson product-moment correlation coefficient (the “Pearson’s correlation”), the correlation index has been calculated by dividing the covariance of two index returns by the product of their standard deviations:
Y X Y X Y X Y X Y X E Y X Y X corr , cov , ,Where E is the expected value operator, cov means covariance and corr is a widely used alternative notation for Pearson’s correlation.
From time series of weekly index returns 16 correlation matrixes have been estimated for the 1994-2010 period. The values of the average correlation for each year has been used as a measure of integration within stock markets. The hypothesis is that a high value of the correlation during the observed period can be interpreted as a signal of high integration of single stock markets in international financial market. Furthermore, the trend of this value will be used in order to understand the dynamic of integration and to estimate its speed over time. The analysis of possible geographical features of integration has been done by annual estimation of the average correlations of stock index returns within the same region (domestic average correlation index) and the average correlation of these markets with the rest of the sample (foreign average correlation index). The distance between these data and its trend over time have been used in order to highlight if integration in the international stock market is a homogeneous phenomena or not. If results from hypothesis tests (T-test) for a region will show a domestic average correlation index close to its foreign one, the hypothesis that integration is following a homogeneous path will be supported. Otherwise, the presence of some clusters of markets with a more correlated path compared to other markets have to be highlighted, and a heterogeneous path of stock market integration will arise. The lack of hypothesis in the correlation analysis avoids the risks of model manipulations, enhancing the strength of the results. The choice of the authors to employ this methodology is even based on the fact that it fits well the aim of the paper, that does not investigate the causes of integration, but provides a measure of the phenomenon, highlighting its trend over time.
Results
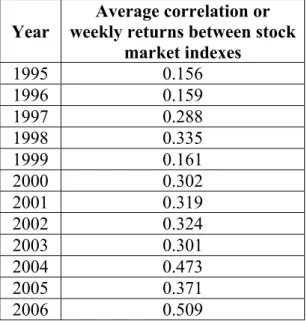
Results from correlation analysis over the 1995-2010 period are summarized in Table 2:
Table 2: Average correlation of weekly index results between stock markets in the 1995-2010 period
Year
Average correlation or weekly returns between stock
market indexes 1995 0.156 1996 0.159 1997 0.288 1998 0.335 1999 0.161 2000 0.302 2001 0.319 2002 0.324 2003 0.301 2004 0.473 2005 0.371 2006 0.509
2007 0.517 2008 0.656 2009 0.599 2010 0.630
The means of the data from annual correlation matrices show an increasing trend. Hence, the hypothesis that globalization within financial market has grown in the last two decades is supported by the empirical evidence. The trend is positive, and the data from 2005 suggest that integration within financial markets is growing faster than before. The effects of the Asian financial crisis in 1997-1998 and the global financial crisis started in 2007 on the world financial markets can explain the downward trend in the data in these years. Thus, if evidences about how much the globalization is affecting world stock markets results are provided, the analysis of correlation within single geographic areas help to understand the homogeneous or heterogeneous nature of the phenomenon. The following tables will show the domestic average correlation index in different areas: Western Europe, Northern Europe, Eastern Europe, North America, Latin America, Asia and Oceania, Africa and Middle East. Using the data, the analysis on the strength of the integration within single geographical region will be feasible.
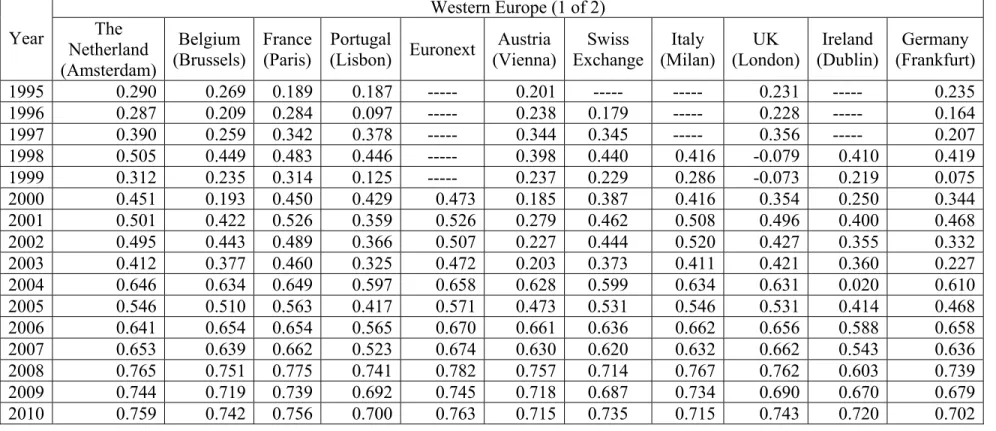
Table 3 (part 1) : Average correlation of weekly index results: data from Western Europe Western Europe (1 of 2) Year The Netherland (Amsterdam) Belgium (Brussels) France (Paris) Portugal (Lisbon) Euronext Austria (Vienna) Swiss Exchange Italy (Milan) UK (London) Ireland (Dublin) Germany (Frankfurt) 1995 0.290 0.269 0.189 0.187 --- 0.201 --- --- 0.231 --- 0.235 1996 0.287 0.209 0.284 0.097 --- 0.238 0.179 --- 0.228 --- 0.164 1997 0.390 0.259 0.342 0.378 --- 0.344 0.345 --- 0.356 --- 0.207 1998 0.505 0.449 0.483 0.446 --- 0.398 0.440 0.416 -0.079 0.410 0.419 1999 0.312 0.235 0.314 0.125 --- 0.237 0.229 0.286 -0.073 0.219 0.075 2000 0.451 0.193 0.450 0.429 0.473 0.185 0.387 0.416 0.354 0.250 0.344 2001 0.501 0.422 0.526 0.359 0.526 0.279 0.462 0.508 0.496 0.400 0.468 2002 0.495 0.443 0.489 0.366 0.507 0.227 0.444 0.520 0.427 0.355 0.332 2003 0.412 0.377 0.460 0.325 0.472 0.203 0.373 0.411 0.421 0.360 0.227 2004 0.646 0.634 0.649 0.597 0.658 0.628 0.599 0.634 0.631 0.020 0.610 2005 0.546 0.510 0.563 0.417 0.571 0.473 0.531 0.546 0.531 0.414 0.468 2006 0.641 0.654 0.654 0.565 0.670 0.661 0.636 0.662 0.656 0.588 0.658 2007 0.653 0.639 0.662 0.523 0.674 0.630 0.620 0.632 0.662 0.543 0.636 2008 0.765 0.751 0.775 0.741 0.782 0.757 0.714 0.767 0.762 0.603 0.739 2009 0.744 0.719 0.739 0.692 0.745 0.718 0.687 0.734 0.690 0.670 0.679 2010 0.759 0.742 0.756 0.700 0.763 0.715 0.735 0.715 0.743 0.720 0.702
Table 3 (part 2) : Average correlation of weekly index results: data from Western Europe Western Europe (2 of 2) Domestic average correlation index Foreign average correlation index Year
Luxembourg Athens Spain (Barcelona) Spain (Madrid) Spain (Valencia) Spain (Bilbao) IBEX 35 1995 --- 0.133 --- 0.292 --- --- 0.285 0.451 0.231 1996 --- 0.021 --- 0.310 0.278 --- 0.307 0.342 0.217 1997 --- 0.256 --- 0.366 0.362 --- 0.359 0.472 0.330 1998 --- 0.417 --- 0.525 0.513 --- 0.516 0.565 0.418 1999 0.136 0.117 0.118 0.338 0.324 --- 0.332 0.268 0.208 2000 0.255 0.150 0.443 0.467 0.419 0.462 0.457 0.511 0.366 2001 0.439 0.342 0.487 0.494 0.489 0.442 0.494 0.708 0.452 2002 0.337 0.342 0.473 0.504 0.487 0.471 0.486 0.593 0.428 2003 0.334 0.272 0.461 0.483 0.470 0.471 0.467 0.532 0.389 2004 0.620 0.558 0.618 0.040 0.623 0.622 0.623 0.679 0.556 2005 0.511 0.419 0.517 0.542 0.535 0.542 0.539 0.749 0.510 2006 0.595 0.549 0.650 0.662 0.660 0.659 0.655 0.787 0.637 2007 0.601 0.615 0.592 0.596 0.600 0.584 0.582 0.724 0.614 2008 0.750 0.699 0.770 0.768 0.767 0.767 0.765 0.830 0.747 2009 0.709 0.655 0.719 0.726 0.727 0.734 0.729 0.851 0.712 2010 0.730 0.590 0.676 0.682 0.685 0.659 0.684 0.857 0.709 T-test 11.5964
In Table 3, for each Western European country the average of correlations with other Western European markets are shown. Hence, these data do not take into account the correlations with non-Western-European markets, and it is useful to understand if the integration within Western Europe is stronger than the integration with other international markets. The last two columns summarize this gap with data of domestic and foreign average correlation indexes. From the correlation matrix of a specific year, the domestic average correlation index has been calculated as the mean of correlation matrix data of single Western European market versus the other Western European markets. From the same annual matrix the mean of the correlations of the same Western European markets versus other international markets was used to calculate the foreign average correlation index. Thus, the wider is the gap between domestic and foreign indexes the stronger is the geographical effect on the integration dynamic, and the higher is the heterogeneity of the globalization in the financial markets.
The upward trend of correlations of Western European stock markets is quite clear. Data from both single countries and domestic average correlation indexes show increasing values. The Western European domestic average correlation was equal to 0.451 in 1995, and it becomes equal to 0.857 in 2010. The gap between domestic and foreign correlation index is positive in every year. These data suggest that the integration process within the Western Europe is stronger than the integration with other countries. Thus, a geographical bias in the integration process arises.
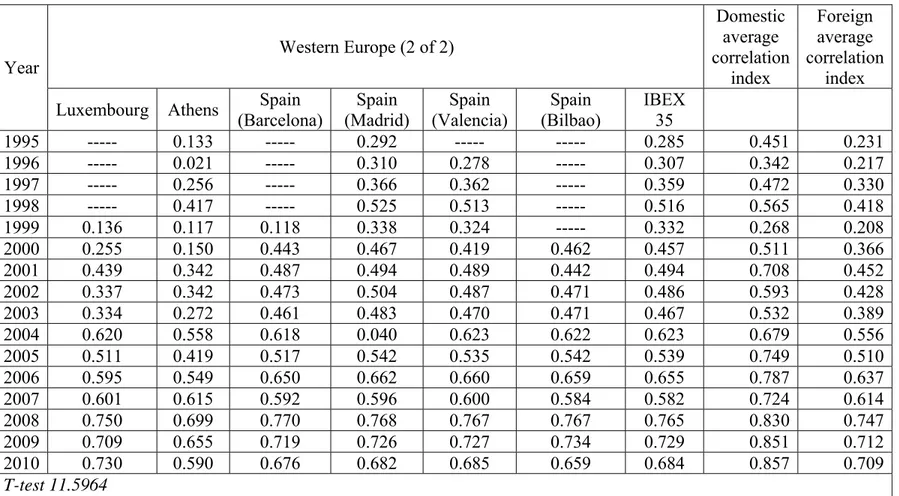
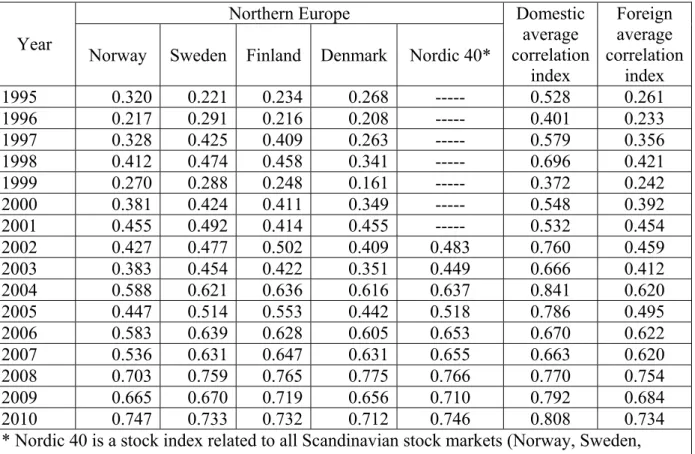
Table 4: Average correlation of weekly index results: data from Northern Europe Northern Europe
Year
Norway Sweden Finland Denmark Nordic 40*
Domestic average correlation index Foreign average correlation index 1995 0.320 0.221 0.234 0.268 --- 0.528 0.261 1996 0.217 0.291 0.216 0.208 --- 0.401 0.233 1997 0.328 0.425 0.409 0.263 --- 0.579 0.356 1998 0.412 0.474 0.458 0.341 --- 0.696 0.421 1999 0.270 0.288 0.248 0.161 --- 0.372 0.242 2000 0.381 0.424 0.411 0.349 --- 0.548 0.392 2001 0.455 0.492 0.414 0.455 --- 0.532 0.454 2002 0.427 0.477 0.502 0.409 0.483 0.760 0.459 2003 0.383 0.454 0.422 0.351 0.449 0.666 0.412 2004 0.588 0.621 0.636 0.616 0.637 0.841 0.620 2005 0.447 0.514 0.553 0.442 0.518 0.786 0.495 2006 0.583 0.639 0.628 0.605 0.653 0.670 0.622 2007 0.536 0.631 0.647 0.631 0.655 0.663 0.620 2008 0.703 0.759 0.765 0.775 0.766 0.770 0.754 2009 0.665 0.670 0.719 0.656 0.710 0.792 0.684 2010 0.747 0.733 0.732 0.712 0.746 0.808 0.734
* Nordic 40 is a stock index related to all Scandinavian stock markets (Norway, Sweden, Finland, Denmark)
T-test 6.8119
(The null hypothesis should be rejected at 5% level of significance)
The data from Northern Europe region confirm both the upward trend of integration and the presence of a geographical bias. In this case the data of domestic correlation index in the late ‘90s highlight how a geographical effect was already present in this region, suggesting that Northern
Europe has been a homogeneous financial area even in the early stage of the analysed period. Foreign average correlation index shows that this region seems to be more integrated with the rest of the world due the fact that the gap with the domestic correlation index from 2005 and over is close to zero.
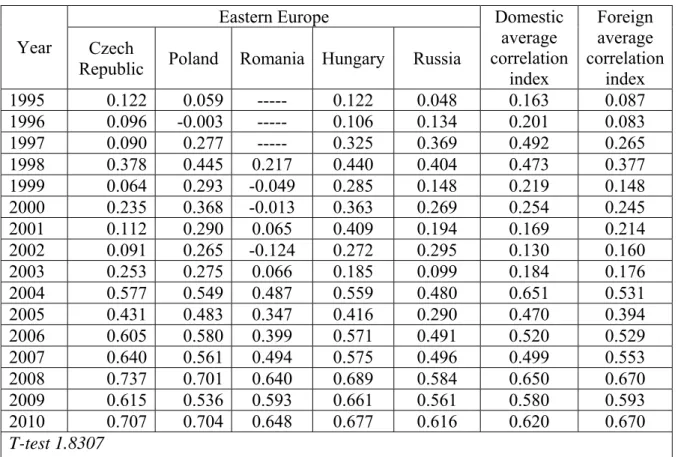
Table 5: Average correlation of weekly index results: data from Eastern Europe Eastern Europe
Year Czech
Republic Poland Romania Hungary Russia
Domestic average correlation index Foreign average correlation index 1995 0.122 0.059 --- 0.122 0.048 0.163 0.087 1996 0.096 -0.003 --- 0.106 0.134 0.201 0.083 1997 0.090 0.277 --- 0.325 0.369 0.492 0.265 1998 0.378 0.445 0.217 0.440 0.404 0.473 0.377 1999 0.064 0.293 -0.049 0.285 0.148 0.219 0.148 2000 0.235 0.368 -0.013 0.363 0.269 0.254 0.245 2001 0.112 0.290 0.065 0.409 0.194 0.169 0.214 2002 0.091 0.265 -0.124 0.272 0.295 0.130 0.160 2003 0.253 0.275 0.066 0.185 0.099 0.184 0.176 2004 0.577 0.549 0.487 0.559 0.480 0.651 0.531 2005 0.431 0.483 0.347 0.416 0.290 0.470 0.394 2006 0.605 0.580 0.399 0.571 0.491 0.520 0.529 2007 0.640 0.561 0.494 0.575 0.496 0.499 0.553 2008 0.737 0.701 0.640 0.689 0.584 0.650 0.670 2009 0.615 0.536 0.593 0.661 0.561 0.580 0.593 2010 0.707 0.704 0.648 0.677 0.616 0.620 0.670 T-test 1.8307
(The null hypothesis should be rejected at 5% level of significance)
If Western Europe and Northern Europe seem to be homogeneous regions with a strong geographic bias in the markets correlations, data from Eastern Europe highlight a different situation. The domestic correlation index was quite low in the early stage of the analysed period and it never overpasses 0.7. The findings suggest that countries from Eastern Europe do not have similarities in their stock market returns, supported by the fact that since 2005 and over the foreign correlation index is even higher than the domestic one.
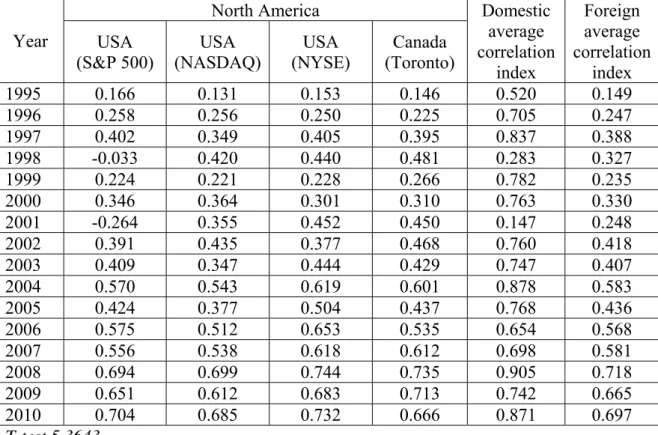
Table 6: Average correlation of weekly index results: data from North America North America Year USA (S&P 500) USA (NASDAQ) USA (NYSE) Canada (Toronto) Domestic average correlation index Foreign average correlation index 1995 0.166 0.131 0.153 0.146 0.520 0.149 1996 0.258 0.256 0.250 0.225 0.705 0.247 1997 0.402 0.349 0.405 0.395 0.837 0.388 1998 -0.033 0.420 0.440 0.481 0.283 0.327 1999 0.224 0.221 0.228 0.266 0.782 0.235 2000 0.346 0.364 0.301 0.310 0.763 0.330 2001 -0.264 0.355 0.452 0.450 0.147 0.248 2002 0.391 0.435 0.377 0.468 0.760 0.418 2003 0.409 0.347 0.444 0.429 0.747 0.407 2004 0.570 0.543 0.619 0.601 0.878 0.583 2005 0.424 0.377 0.504 0.437 0.768 0.436 2006 0.575 0.512 0.653 0.535 0.654 0.568 2007 0.556 0.538 0.618 0.612 0.698 0.581 2008 0.694 0.699 0.744 0.735 0.905 0.718 2009 0.651 0.612 0.683 0.713 0.742 0.665 2010 0.704 0.685 0.732 0.666 0.871 0.697 T-test 5.3643
(The null hypothesis should be rejected at 5% level of significance)
The gap between domestic and foreign correlation indexes of North America and the single annual data is typical of high integrated stock market regions. In fact, the internal correlation in 2010 is equal to 0.871, highlighting the strong relationship within North American stock markets. Moreover, the increasing correlation with other foreign markets can be interpreted as an impact of globalization effect.
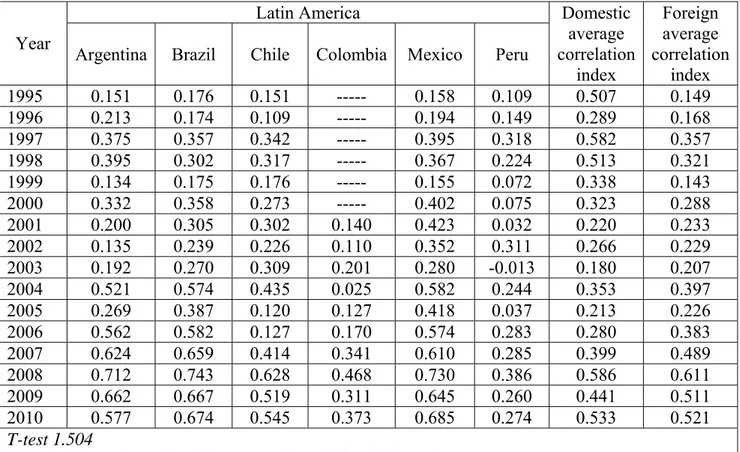
Table 7: Average correlation of weekly index results: data from Latin America Latin America
Year
Argentina Brazil Chile Colombia Mexico Peru
Domestic average correlation index Foreign average correlation index 1995 0.151 0.176 0.151 --- 0.158 0.109 0.507 0.149 1996 0.213 0.174 0.109 --- 0.194 0.149 0.289 0.168 1997 0.375 0.357 0.342 --- 0.395 0.318 0.582 0.357 1998 0.395 0.302 0.317 --- 0.367 0.224 0.513 0.321 1999 0.134 0.175 0.176 --- 0.155 0.072 0.338 0.143 2000 0.332 0.358 0.273 --- 0.402 0.075 0.323 0.288 2001 0.200 0.305 0.302 0.140 0.423 0.032 0.220 0.233 2002 0.135 0.239 0.226 0.110 0.352 0.311 0.266 0.229 2003 0.192 0.270 0.309 0.201 0.280 -0.013 0.180 0.207 2004 0.521 0.574 0.435 0.025 0.582 0.244 0.353 0.397 2005 0.269 0.387 0.120 0.127 0.418 0.037 0.213 0.226 2006 0.562 0.582 0.127 0.170 0.574 0.283 0.280 0.383 2007 0.624 0.659 0.414 0.341 0.610 0.285 0.399 0.489 2008 0.712 0.743 0.628 0.468 0.730 0.386 0.586 0.611 2009 0.662 0.667 0.519 0.311 0.645 0.260 0.441 0.511 2010 0.577 0.674 0.545 0.373 0.685 0.274 0.533 0.521 T-test 1.504
(The null hypothesis should be rejected at 5% level of significance)
Data from Latin America represent a clear evidence of an heterogeneous area. Unlike other regions, the negative gap between domestic and foreign average correlations highlight that most of the South American stock markets are more correlated with non-South American markets than with domestic ones. From a global perspective, the low average level of the correlation indexes (both domestic and foreign) suggests that globalization in this region is not so high as in North America and Western Europe.
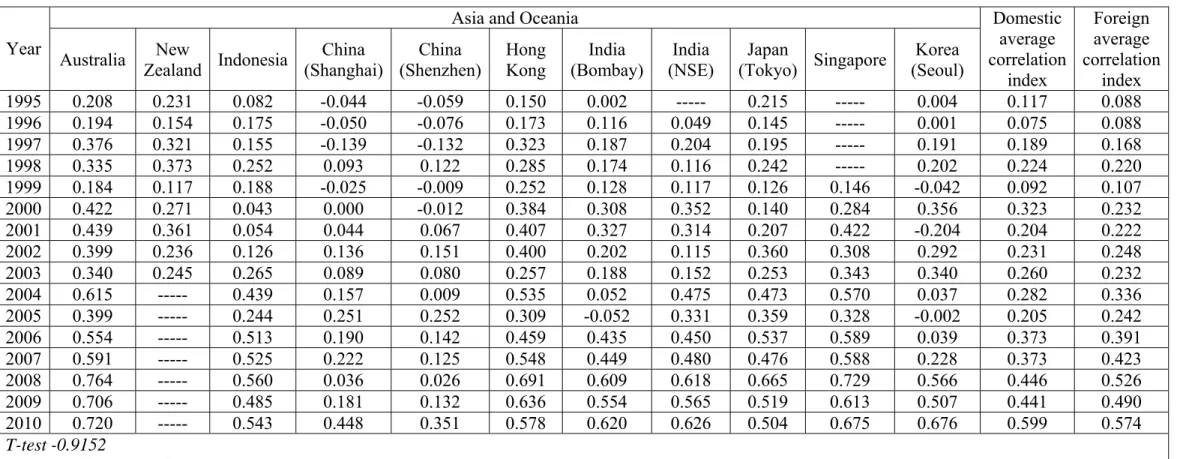
Table 8: Average correlation of weekly index results: data from Asia and Oceania
Asia and Oceania Year Australia New Zealand Indonesia China (Shanghai) China (Shenzhen) Hong Kong India (Bombay) India (NSE) Japan (Tokyo) Singapore Korea (Seoul) Domestic average correlation index Foreign average correlation index 1995 0.208 0.231 0.082 -0.044 -0.059 0.150 0.002 --- 0.215 --- 0.004 0.117 0.088 1996 0.194 0.154 0.175 -0.050 -0.076 0.173 0.116 0.049 0.145 --- 0.001 0.075 0.088 1997 0.376 0.321 0.155 -0.139 -0.132 0.323 0.187 0.204 0.195 --- 0.191 0.189 0.168 1998 0.335 0.373 0.252 0.093 0.122 0.285 0.174 0.116 0.242 --- 0.202 0.224 0.220 1999 0.184 0.117 0.188 -0.025 -0.009 0.252 0.128 0.117 0.126 0.146 -0.042 0.092 0.107 2000 0.422 0.271 0.043 0.000 -0.012 0.384 0.308 0.352 0.140 0.284 0.356 0.323 0.232 2001 0.439 0.361 0.054 0.044 0.067 0.407 0.327 0.314 0.207 0.422 -0.204 0.204 0.222 2002 0.399 0.236 0.126 0.136 0.151 0.400 0.202 0.115 0.360 0.308 0.292 0.231 0.248 2003 0.340 0.245 0.265 0.089 0.080 0.257 0.188 0.152 0.253 0.343 0.340 0.260 0.232 2004 0.615 --- 0.439 0.157 0.009 0.535 0.052 0.475 0.473 0.570 0.037 0.282 0.336 2005 0.399 --- 0.244 0.251 0.252 0.309 -0.052 0.331 0.359 0.328 -0.002 0.205 0.242 2006 0.554 --- 0.513 0.190 0.142 0.459 0.435 0.450 0.537 0.589 0.039 0.373 0.391 2007 0.591 --- 0.525 0.222 0.125 0.548 0.449 0.480 0.476 0.588 0.228 0.373 0.423 2008 0.764 --- 0.560 0.036 0.026 0.691 0.609 0.618 0.665 0.729 0.566 0.446 0.526 2009 0.706 --- 0.485 0.181 0.132 0.636 0.554 0.565 0.519 0.613 0.507 0.441 0.490 2010 0.720 --- 0.543 0.448 0.351 0.578 0.620 0.626 0.504 0.675 0.676 0.599 0.574 T-test -0.9152
The above conclusions for Latin America region can be used as well for the Asia and Oceania region. Accordingly, the comparison between domestic and foreign correlation indexes shows a low level of correlation both within and outside this region.
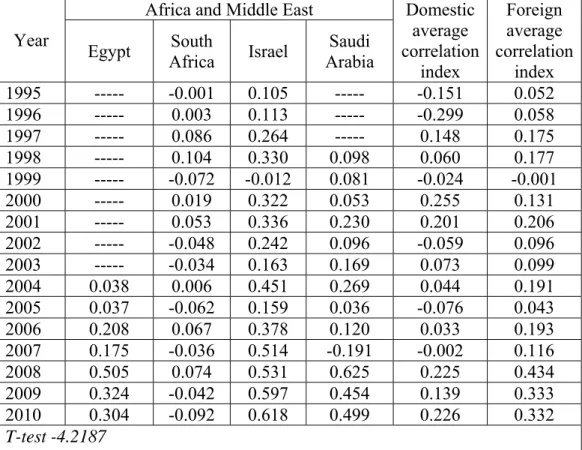
Table 9: Average correlation of weekly index results: data from Africa and Middle East Africa and Middle East
Year
Egypt Africa South Israel Arabia Saudi
Domestic average correlation index Foreign average correlation index 1995 --- -0.001 0.105 --- -0.151 0.052 1996 --- 0.003 0.113 --- -0.299 0.058 1997 --- 0.086 0.264 --- 0.148 0.175 1998 --- 0.104 0.330 0.098 0.060 0.177 1999 --- -0.072 -0.012 0.081 -0.024 -0.001 2000 --- 0.019 0.322 0.053 0.255 0.131 2001 --- 0.053 0.336 0.230 0.201 0.206 2002 --- -0.048 0.242 0.096 -0.059 0.096 2003 --- -0.034 0.163 0.169 0.073 0.099 2004 0.038 0.006 0.451 0.269 0.044 0.191 2005 0.037 -0.062 0.159 0.036 -0.076 0.043 2006 0.208 0.067 0.378 0.120 0.033 0.193 2007 0.175 -0.036 0.514 -0.191 -0.002 0.116 2008 0.505 0.074 0.531 0.625 0.225 0.434 2009 0.324 -0.042 0.597 0.454 0.139 0.333 2010 0.304 -0.092 0.618 0.499 0.226 0.332 T-test -4.2187
(The null hypothesis should be rejected at 5% level of significance)
If Latin America and Asia and Oceania regions can not be considered as integrated regions, data from Africa and Middle East are even sharper. The foreign correlation index is constantly close to zero from 1995 to 2007, and even in 2008-2010 data highlight an upper trend. Even if in 2009 and in 2010 the average correlation of Africa and Middle East stock markets with other non-region markets is equal to 0.33, low correlation data for domestic correlation index shows several times negative values. If the economic, geographical and cultural distances between the countries of this group can explain these results, the conclusion about a quite low integrated financial area is clear.
Conclusions
A correlation analysis has been done using the data from 53 national stock exchanges in order to highlight the relevance of globalization and its trend within financial markets. A comparison between the average correlation values for single geographical areas from 1995 to 2010 highlighted that correlation between markets around the world is growing by the time. Furthermore, the results confirm the hypothesis that globalization of financial markets in the last years is quite stronger than the previous ones, suggesting that a “globalization effect” on the correlation matrices is speeding up.
Data from single geographic areas show that globalization of financial markets is quite far to be a homogeneous phenomenon. Findings from Western Europe, North Europe and North America suggest that these regions are much more “locally than globally” integrated. Even if correlations
correlation index highlight the tendency of globalization to evolve in a clustered manner. In the meanwhile, data from Eastern Europe, Latin America and Asia and Oceania show a lower level of integration, while Africa and Middle East countries seem to show no similarities in their stock market returns. Hence, the findings provide that there is a “local globalization” at geographical level before the common globalization can affect all geographical areas and international markets.
Results of this paper are consistent with results provided in the literature by previous papers. Anyway this paper is far to simply confirm results of previous study. In fact it provides evidences on a globalization trend both in a global perspective and in geographical perspective. At the same time data on correlation showing an increasing upward trend improve the knowldege on globalization in financial markets and suggest further studies. Other papers have analysed single local markets but the number of exchanges in the world and the almost twenty years analysed period allow to evaluate in a global manner how much globalization affects financial markets. The obtained results can be interesting for both academics and practitioners. Awareness about how globalization is developing around the world can be useful in order to explain its role in different countries phenomena (exchange rates, import and exports, etc.). Moreover, due to the relevance of globalization in the asset allocation process, adopted by mutual funds and other investors, data on the globalization effect in different regions can be useful in order to understand if a geographical criteria (Europe, Asia, north America, etc.) or an industry based criteria (good&services, telecommunication, oil and gas, etc.) is the most effective in a portfolio diversification approach.
Appendix
Summary Statistics of Weekly Data 30/12/1994 to 31/12/2010
Variable Obs№ Mean Max Min SD Skew Kurt J- Bera
S&P 500 835 0.00154 0.12003 -0.18198 0.02550 -0.53196 8.211.695 984,4 NASDAQ COMPOSITE 835 0.00215 0.18971 -0.25304 0.03547 -0.55650 8.190.921 980,6 NYSE COMPOSITE 835 0.00164 0.12905 -0.19527 0.02508 -0.66707 1.003.257 1783 S&P/TSX COMPOSITE 835 0.00232 0.17789 -0.23381 0.03184 -0.83828 1.021.754 1910 BOVESPA 835 0.00436 0.29141 -0.28842 0.06035 -0.23533 5.522.323 229,1 MERVAL 835 0.00218 0.26957 -0.28571 0.05244 -0.26788 7.244.603 636,8 IGBC 494 -0.01294 0.09302 -0.45050 0.06192 -3.46564 1.662.889 4812 IPC 835 0.00159 0.16401 -0.26074 0.04365 -0.61796 5.934.096 352,7 IPSA 832 -0.01186 0.17953 -0.45942 0.06509 -5.40189 3.509.045 4.0e+04 IGBVL 835 0.00382 0.20526 -0.30986 0.03871 -0.16014 1.179.619 2696 NZSX 30 470 0.00054 0.10008 -0.09012 0.02641 -0.11559 4.265.127 32,39 S&P/ASX 200 835 0.00198 0.15332 -0.29410 0.03177 -1.30686 1.423.008 4625 SSE COMPOSITE 835 0.00122 0.11699 -0.20294 0.03625 -0.30634 5.106.546 167.4 SZSE COMPOSITE 835 0.00238 0.36108 -0.91311 0.05660 -5.38953 9.054.715 2.7e+05 HANG SENG 835 0.00188 0.14936 -0.18039 0.03606 -0.18284 5.501.207 222,3 S&P CNX NIFTY 50 835 0.00277 0.20344 -0.17744 0.04164 -0.12796 473.393 98,05 BSE SENSEX 100 766 0.00143 0.22365 -0.89595 0.05216 -61.50200 1.073.147 3.8e+05 JAKARTA COMPOSITE 833 -0.00149 0.17391 -0.44118 0.05204 -1.95329 1.486.975 5420 TA – 100 835 0.00282 0.16250 -0.16098 0.03628 -0.41139 4.612.526 114 NIKKEI 225 835 0.00001 0.13654 -0.20322 0.03297 -0.06084 5.358.652 194,1 FTSE ST 591 0.00154 0.19772 -0.18662 0.03221 -0.25157 8.279.297 692,6 KOSPI 833 -0.00472 0.11764 -0.45721 0.05258 -3.532165 2.835.586 2.4e+04 EGX 30 340 0.00606 0.13117 -0.20508 0.04626 -0.80413 6.113.327 174 TASI 591 0.00313 0.16801 -0.22228 0.03818 -1.19781 9.267.781 1109 FTSE/JSE TOP 40 809 0.00101 0.12282 -0.18156 0.03921 -0.72641 5.155.917 227,8 EURONEXT 100 574 0.00043 0.13733 -0.24054 0.03336 -0.86050 9.362.934 1039 BEL 20 835 0.00130 0.13129 -0.24663 0.03102 -0.93186 9.727.565 1696 CAC 40 835 0.00148 0.14867 -0.23860 0.03243 -0.61481 8.367.893 1055 AEX 835 0.00139 0.14914 -0.26628 0.03331 -0.77148 9.911.236 1745 PSI-20 835 0.00127 0.17797 -0.20371 0.03064 -0.67533 876.918 1221 OMXN 40 470 0.00181 0.16430 -0.21041 0.03730 -0.65920 7.174.481 375,3 OMX STOCKHOLM 30 835 0.00253 0.21560 -0.21216 0.03797 -0.16552 7.073.085 581 OMXH25 835 0.00248 0.18355 -0.20174 0.03707 -0.48123 6.187.749 385,8 OMX COPENHAGEN 20 835 0.00247 0.14135 -0.21802 0.03077 -1.14712 1.013.708 1955 OBX 835 0.00243 0.23066 -0.25079 0.03987 -0.52886 9.507.605 1512 DAX 835 0.00102 0.08300 -0.21095 0.02641 -1.16172 974.293 1770 ATX 835 0.00194 0.20516 -0.30471 0.03561 -1.04674 1.311.477 3712 SMI 678 0.00209 0.10276 -0.15339 0.03056 -0.66593 5.058.154 169,8 FTSE MIB 678 0.00066 0.20673 -0.23331 0.03613 -0.53224 9.700.779 1300
References
Agénor, P.R. (2003), “Does Globalization Hurt the Poor?”, The World Bank, Washington DC 20433.
Aggarwal, R. (1999), “Technology and Globalization as Mutually Reinforcing Forces in Business," Management International Review 39(2), pp. 83-104.
Alcacer, J., Ingram, P. (2008), “Spanning the Institutional Abyss: The Intergovernmental Network and the Governance of Foreign Direct Investment”, Harvard Business School,
Working Paper 09-045.
Armanious, A. (2005), “Globalization Effect On Stock Exchange Integration”, Cairo
University.
Arribas, I., Perez, F., Tortosa-Ausina, E. (2006), “Measuring International Economic Integration: Theory and Evidence of Globalization”, Instituto Valenciano de Investigaciones Economicas, Universitat de Val_encia, Universitat Jaume I de Castello, MPRA Paper No.
16010.
Beale, L., Ferrando, A., Hördhal, P., Krylova, E., Monnet, C. (2004), “Measuring financial integration in the Euro area”, European Central Bank Occasional Paper Series No. 14, April.
Beck, T., Levive, R., Loeysa, N. (2000), “Finance and the Sources of Growth.” Journal of
Financial Economics (1-2), pp.261-300.
Beck, T., Demirguc, A., Levine, R. (2007), “Finance, Inequality and Poor”, Journal of
Economic Growth, Vol.12, pp. 27-49.
Bekaert, G., Harvey, C. (2003), “Emerging Markets Finance”, Journal of Empirical
Finance, Vol. 10, pp. 3-55.
Bekaert, G., Hodrick, R. J. (2006), “International stock return co movements, CEPR, Discussion Paper 5855.
Bhagwati, J. (2004). “In Defense of Globalization”, Oxford, New York: Oxford University
Press.
Campero, G. (2001), “Trade union responses to globalization: Chile”, Labour and Society
Programme, No. 113/2000. ISBN: 92-9014-621-4.
Carretta A., Nicolini G. (2009), “European Exchanges, Investors Behaviour and Asset Allocation Criteria: Country Approach Vs Industry Approach” in Carretta A., Fiordelisi F., Mattarocci G.,(a cura di), "New Drivers of performance in a changing financial world",
Palgrave Macmillian, ISBN 978-1-4039-4872-4.
Carrieri F., Errunza V., Hogan K. (2003), “Characterizing World Market Integration Through Time”, EFMA 2001 Lugano Meetings.
Chudnovsky D., Lopez A., (1999), “Globalization and developing countries: foreign direct investment and growth and sustainable human development”, Paper prepared for the
UNCTAD/UNDP Global Programme on Globalization, Liberalization and Sustainable Development.
Erb C.B., Harvey C.R., Viskanta T.E., (1994), “Forecasting international equity correlations”, Financial Analysts Journal, Vol. 50, pp. 32-45.
Erdogan B. (2009), "How Does European Integration Affect the European Stock Markets?",
Working Paper / FINESS 1.1a, DIW Berlin, German Institute for Economic Research.
Dhameja A., Medury U. (2004), “Information and Communication Technology in the Globalization Era: The Socio-economic Concerns”, Faculty of Public Administration, Indira
Gandhi National Open University, ARPA, Volume 16, Issue 1.
Di Noia C. (1998), “Competition and Integration among Stock Exchanges in Europe: Network Effects, Implicit Mergers and Remote Access”, Working Paper, The Wharton
Financial Institutions Center.
Fratzacher M. (2001), “Financial Market Integration in Europe: on The Effects of EMU on Stock Markets”, Working Paper №. 48, European Central Bank.
Galton F. (1888), “'Co-relations and their measurement, chiefly from anthropometric data”,
Proceedings of the Royal Society 45 (December 13) : 135-45.
Giannetti M. (2002), “The effects of integration on regional disparities: Convergence, divergence or both?”, European Economic Review, Volume 46, Issue 3, March 2002, Pages 539-567.
Goldberg L., Lothian J., Okunev J. (2002), “Has International Financial Integration Increased?”, CRIF Working Papers.
Guha P., Daga S. Gulati R., Bhupal G., Oak, H. (2004), “International Financial Markets Integration or Segmentation: A Case Study of Equity Markets”, EconWPA in its series
Finance, 0412013.
Guerin S. (2006), “The Role of Geography in Financial and Economic Integration: A Comparative Analysis of Foreign Direct Investment, Trade and Portfolio Investment Flows”, The World Economy, Blackwell Publishing, vol. 29(2), pages 189-209.
Harvey C. (1995), “Predictable risk and returns in emerging markets”, Review of Financial
Studies 8: 775–818.
Hassan M. K., Naka A. (1996), “Short-run and long-run dynamic linkages among international stock markets”, International Review of Economics and Finance, Vol 5, № 1. Hasan I., Schmiedel H. (2004), “Networks and equity market integration: European
evidence”, International Review of Financial Analysis, Volume 13, Issue 5, 2004, Pages 601-619.
Hardouvelis G., Malliaropulos D., Priestly R (1999), “EMU and European Stock Market Integration”, CEPR Discussion Paper №. 2124.
Hooy C.W., Goh K.L. (2009), "What drive the regional integration of equity markets?",
SSES Annual Meeting 2009, University of Geneva.
Hyde S., Bredin D., Nguyen N. (2007), “Correlation dynamics between Asia-Pacific, EU and US stock returns,” MPRA Paper 9681, University Library of Munich.
Karolyi G.A., Stulz R.M. (2001), “Are financial assets prices locally or globally?”, Working paper, Ohio State University.
Kim S. J., Moshirian F., Wu E. (2005), "Dynamic Stock Market Integration Driven by the European Monetary Union: An Empirical Analysis", Journal of Banking & Finance, Vol. 29, 2475–2502.
Kose M. A., Prasad E., Terrones M. (2008), “Does Openness to International Financial Flows Contribute to Productivity Growth.”, Manuscript, IMF and Cornell University.
Lane P., Milesi-Ferretti M.G. (2003), “International Financial Integration”, Prepared for the
IMF’s Third Annual Research Conference, November 7-8 2002.
Lawrence S., Ishikawa J. (2005), “Social Dialogue Indicators Trade union membership and collective bargaining coverage: Statistical concepts, methods and findings”, Policy Integration Department Bureau of Statistics & Social Dialogue, Labour Law and Labour
Administration Department International Labour Office (Geneva), Working Paper No. 59.
Leamer E. (1988), Chapter “Measures of Openness” from the Book “Trade Policy Issues and Empirical Analysis”, University of Chicago Press.
Longin F., Solnik B. (1995), "Is the correlation in international equity returns constant: 1970 - 1990", Journal of International Money and Finance, Vol 14, pp. 3-26.
Marek M. T., Haiss P. (2008), “Stock Exchange M&A, FDI & Demutualization: industrial organization changes to the better or to the worse?”, Paper for presentation at the 8th
Global Conference on Business and Economics, Florence, Italy.
Brezigar – Masten, A., Coricelli, F., Masten, I. (2008), "Non-linear growth effects of financial development: Does financial integration matter?," Journal of International Money
and Finance, Vol. 27(2), pp. 295-313.
Mishkin F. (2007), “Is financial globalization beneficial?”, Journal of Money, Credit and
Banking, 39(2–3):259–294.
Mohan R. (2005), “Communications in central banks: a perspective”, Reserve Bank of India
Bulletin.
Moser G., Pointner W., Scharler J. (2004), “International risk sharing in Europe: has anything changed?”, The Economic Potential of a Larger Europe, Edward Elgar Publishing, Northampton (2004), pp. 260–275.
Mussa M. (2000), “Factors Driving Global Economic Integration”, Presented in Jackson Hole, Wyoming at a symposium on “Global Opportunities and Challenges.
Nielsson U. (2009), “Stock exchange merger and liquidity: The case of Euronext,” Journal
of Financial Markets, Elsevier, Vol. 12(2), pp. 229-267.
Okeahalam C. (2001), “Strategic Alliances and Mergers of Financial Exchanges: The Case of the SADC,” Paper to be presented at the fourth annual conference of the Centre for the Study of African Economies, Oxford University, March 29-31.
Oxelheim L. (1990), “International Financial Integration”, Springer - Verlag, Business &
Economics - 389 pages.
Padilla A.J., Pagano M. (2005), “Efficiency gains from the integration of stock exchanges: lessons from the Euronext “natural experiment”. A report for Euronext.
Pagano M., Randl O., Röell A., Zechner J. (2001) “What makes Stock Exchanges Succeed? Evidence from Cross-Listing Decisions”, European Economic Review, 45, pp. 770–82. Pearson K. (1900), "On the Criterion that a given System of Deviations from the Probable in
the Case of a Correlated System of Variables is such that it can be reasonably supposed to have arisen from Random Sampling". Philosophical Magazine Series 5, 50 (302): pp.157– 175.
Phylaktis K. (1995). "Capital market integration in the Pacific Basin Region: an analysis of real interest rate linkages", International Monetary Fund, working papers: 133.
Pieper P., Vogel R. (1997), “The Stock Market Integration In Latin America”, CAER II Discussion Paper №. 21, Harvard Institute for International Development.
Polato M., Floreani J. (2009), “Cross border mergers and value creation in the exchange industry: the case of diversified conglomeral exchanges, WOLPERTINGER - 2009, The
European Association of University Teachers of Banking and Finance.
Prasad E., Rogoff K., Wei S.J., Kose M.A. (2003), “The effects of financial globalization on developing countries: Some empirical evidence”, IMF Occasional paper no. 220.
Quinn, D., Toyoda, A.M., (2008), “Does Capital Account Liberalization Lead to Growth?”, The Review of Financial Studies, Vol. 21 No.3, pp.1403-1449.
Reddy Y.V. (2003), “Towards Globalisation in the Financial Sector in India - Inaugural Address”, Speech at the Twenty-Fifth Bank Economists Conference, Mumbai, December. Sarkissian S., Schill M. (2004), “The overseas Listing Decision: New evidence of Proximity
Preference”, The review of Financial Studies, Vol. 17, pp.769-809.
Schmiedel H., Schönenberger A. (2005), “Integration of Securities Market Infrastructures in the Euro Area”, ECB Occasional Paper №. 33, European Central Bank - Securities Settlement Systems Policy Division, European Central Bank (ECB).
Schindler F., Voronkova S. (2010), “Linkages between international securitized real estate markets: Further evidence from time-varying and stochastic cointegration”, ZEW Discussion
Papers, 10 – 051.
Shailendra K. H. (2005), “Role of Information and Communication Technologies in Managing Globalization at the national and regional levels”, International Conference on
Tavares J. (2009), “Economic integration and the comovement of stock returns”, Economics
Letters, 103, pp, 65–67.
Trichet J. C. (2005), “Reflections on the international financial system”, Speech by the
President of the European Central Bank.
Varadi V.K., Boppana N. (2009), “Are stock exchanges integrated in the world? - A critical Analysis”, Paper provided by University Library of Munich, Germany in its series MPRA
Paper.
Vo X.V. (2006), Determinants Of International Financial Integration, Working Paper Series,
School of Economics and Finance - University of Western Sydney.
Walsham G. (2001), “Globalization And Icts: Working Across Cultures”, The Judge
Institute of Management Studies, Working paper 8/2001.
You L., Lucey B. (2008), “An Empirical Study of Multiple Listings,” The Institute for