Visual field loss and vision-related
quality of life in the Italian Primary
Open Angle Glaucoma Study
Eliana Rulli
1, Luciano Quaranta
2, Ivano Riva
3, Davide Poli
1, Lital Hollander
1, Fabio Galli
1,
Andreas Katsanos
2, Francesco Oddone
3, Valter Torri
1, Robert N. Weinreb
4& Italian Study
Group on QoL in Glaucoma
*
The aim of this study was to examine the relationship between visual field (VF) loss, vision-related quality of life (QoL) and glaucoma-related symptoms in a large cohort of primary open angle glaucoma (POAG) patients. POAG patients with or without VF defects or “glaucoma suspect” patients were considered eligible. QoL was assessed using the validated versions of the 25-item National Eye Institute Visual Function Questionnaire (NEI-VFQ-25) and glaucoma-related symptoms were assessed using the Glaucoma Symptom Scale (GSS). Patients were classified as having VF damage in one eye (VFD-1), both eyes (VFD-2), or neither eye (VFD-0). 3227 patients were enrolled and 2940 were eligible for the analysis. 13.4% of patients were classified in the VFD-0, 23.7% in the VFD-1, and 62.9% in the VFD-2 group. GSS visual symptoms domain (Func-4) and GSS non-visual symptoms domain (Symp-6) scores were similar for the VFD-0 and VFD-1 groups (p = 0.133 and p = 0.834 for Func-4 and Symp-6, respectively). VFD-0 group had higher scores than VFD-2 both in Func-4 (p < 0.001) and Symp-6 domains (p = 0.035). Regarding the NEI-VFQ-25, our data demonstrated that bilateral VF defects are associated with vision-related QoL deterioration, irrespective of visual acuity.
Glaucoma constitutes a major global cause or irreversible visual loss1. It is estimated that approximately 60 million people worldwide have glaucoma and 8.4 million patients are bilaterally blind1. Of the many types of the disease, primary open angle glaucoma (POAG) is by far the commonest in populations of European ori-gin2,3. As a chronic, progressive, vision-threatening disease, POAG can severely affect vision-related quality of life (QoL). Visual decline is a direct consequence of the glaucomatous process and can lead to limitations of daily functioning and loss of autonomy, thus causing deterioration of vision-related QoL and significant psychological burden4,5. In addition to the degradation of QoL due to the disease-related visual decline, factors such as adverse events of medication, cost of treatment, or even the distress elicited by the mere diag-nosis of an irreversible, potentially blinding disorder can adversely affect the patient’s sense of well-being and QoL6–13.
The importance of preserving vision-related QoL at a sustainable cost has become increasingly recognized in glaucoma management14. Evidence has shown that patients with glaucoma often have problems with important daily activities such as walking15, driving16–18, or reading18, especially when perimetric damage is advanced or when both eyes are affected. Despite the recent interest in glaucoma-related QoL issues13,19–22, the relationship between vision-specific QoL and severity of visual field (VF) defects or number of eyes with perimetric loss warrants further exploration in sufficiently powered studies. In addition, the relationship between severity of VF damage or number of perimetrically affected eyes and glaucoma-related visual and non-visual symptoms needs to be better characterized in adequately sized studies.
In a previous paper of ours23, we described the methodology of the Italian Primary Open Angle Glaucoma Study (IPOAGS) and the baseline characteristics of the participants. In addition, that paper reported the association between vision-related QoL assessed with the 25-item National Eye Institute Visual Function Questionnaire (NEI-VFQ-25) and glaucoma-related symptoms assessed with the Glaucoma Symptoms Scale
1IRCCS - Istituto di Ricerche Farmacologiche Mario Negri, Milan, Italy. 2DMSS, University of Brescia, Brescia,
Italy. 3IRCCS - Fondazione GB Bietti per lo Studio e la Ricerca in Oftalmologia, Rome, Italy. 4Hamilton Glaucoma
Center, Shiley Eye Institute, and the Department of Ophthalmology, University of California, San Diego, CA, USA. *A comprehensive list of consortium members appears at the end of the paper. Correspondence and requests for materials should be addressed to L.Q. (email: [email protected])
Received: 28 July 2017 Accepted: 20 December 2017 Published: xx xx xxxx
(GSS) questionnaire23. It also presented the association between the NEI-VFQ-25 and GSS scores with glaucoma severity in a sample of 3169 patients23. In the current paper, our analysis was primarily focused on the impact of glaucoma (in terms of vision-related QoL and glaucoma-related symptoms) according to the number of perimet-rically affected eyes. Therefore, the aim of the current report is to describe the characteristics of IPOAGS patients who have no-, one-, or both eyes with visual field loss, and examine the association between the number of peri-metrically affected eyes and NEI-VFQ-25 and GSS scores.
Patients and Methods
Details regarding the multicenter IPOAGS study have been described elsewhere23. Briefly, twenty-one academic and non-academic Italian institutions were involved in the recruitment. Patients aged >18 years with a previous or new diagnosis (or strong clinical suspicion) of POAG were invited to participate during regular visits and were consecutively enrolled. Patients were considered eligible for inclusion if they had optic nerve head damage typical for glaucoma, i.e. focal and/or generalized neuroretinal rim thinning or cup/disc ratio asymmetry >0.2 in the absence of other neurodegenerative diseases. The presence of characteristic glaucomatous visual field defects was not a prerequisite for inclusion. Women who were pregnant, breast-feeding or had plans to become pregnant were excluded. Other exclusion criteria were the concurrent abuse of alcohol or illicit substances, and the partic-ipation in any clinical trial that tested medications or medical devices within 30 days prior to recruitment. The validated Italian version of the NEI-VFQ-25 was used for the assessment of vision-related QoL24. The validated Italian version of the GSS Questionnaire25 was used for the assessment of glaucoma-related visual and non-visual symptoms.
The NEI-VFQ-25 is a self-administered 25-item, 12-subscale questionnaire assessing the following: gen-eral health, gengen-eral vision, ocular pain, near activities, distant activities, social functioning, mental health, role difficulties, dependency, driving, color vision, and peripheral vision26–28. The scoring procedure converts the pre-coded numeric values of each item to a score ranging from 0 to 100. Higher scores reflect better vision-related QoL. The global score is the mean score of all items that constitute 11 of the 12 subscales, with the exception of the single item that constitutes the general-health subscale.
The GSS Questionnaire29, a glaucoma specific tool, is a modified version of a checklist of symptoms devel-oped by the Ocular Hypertension Treatment Study group. The tool includes 10 items grouped into two domains: Symp-6 for non-visual symptoms (burning/smarting/stinging, tearing, dryness, itching, soreness/tiredness, feel-ing of somethfeel-ing in the eye) and Func-4 for visual symptoms (blurry/dim vision, hard to see in daylight, hard to see in darkness, and halos around lights). The ten items assess each eye separately using a scale from 0 to 100, where zero indicates the presence of a very bothersome symptom and 100 the absence of the symptom. The domain score is the un-weighted average of the scores of the items that make up the domain in question. Similarly, the total GSS score is the mean of the 10 item scores. GSS scores can be calculated as average of the two eyes and for each eye separately.
The severity of VF damage was classified according to the Glaucoma Staging System 230–32. The Glaucoma Staging System 2 is a classification method31 that uses Mean Defect or Mean Deviation (MD) and Pattern Standard Deviation/Corrected Pattern Standard Deviation (PSD/CPSD) or Loss Variance/Corrected Loss Variance (LV/CLV) values (from either the 30-2/24-2 Zeiss-Humphrey tests or the G1/G1X/G2 Octopus pro-grams) on a Cartesian coordinate diagram. The visual fields are divided in seven different stages by curvilinear lines from stage 0 (normal visual fields) through borderline to stage 5 (low threshold readings, with only small remnants of sensitivity remaining). This nomogram allows the user to quickly determine the stage of the dis-ease (Fig. 1). When compared to other VF staging systems (e.g. The Advanced Glaucoma Intervention Study scoring system33 or the Hodapp-Anderson-Parrish system34), the Glaucoma Staging System 2 has been demon-strated to be preferable for its ease of use for clinicians and researchers alike35. Furthermore, it has been used in population-based studies and clinical trials36–40.
Based on the presence of glaucoma and perimetric damage, eyes were classified in three categories: a) eyes without signs of glaucoma (WOG), i.e. fellow eyes of patients with unilateral glaucoma; b) eyes with glaucoma but no VF damage (WOD), i.e. “pre-perimetric” glaucoma: VF stage 0-borderline; c) eyes with glaucoma and VF damage (WD; VF stage 1 or greater). Participants, on the other hand, were classified in three categories: patients without VF damage in any eye (VFD-0), patients with VF damage in one eye (VFD-1), and patients with VF damage in both eyes (VFD-2). Two analyses were performed, one considering patients as units of analysis, and one considering eyes as units of analysis.
Descriptive summary statistics are presented as mean, standard deviation, minimum and maximum values for continuous variables, and as absolute frequency and percentage for categorical variables. The Chi-square test for trend and linear regression were used to investigate associations between VF and clinical character-istics. When considering patients as units of analysis a linear regression model was fitted to test the effect of number of eyes with VF damage on questionnaires scores (performed with a generalized linear model proce-dure). For each subscale, as well as for the total score of both the NEI-VFQ-25 and the GSS questionnaires, a multivariate model was fitted with the following covariates: age, best corrected visual acuity (BCVA, mean of the two eyes), previous treatment (treated versus untreated) and number of eyes with VF damage (VFD-0, VFD-1, VFD-2). VFD-0 was chosen as reference group for the latter variable; therefore p-values for VFD-1 and VFD-2 refer to the comparison of these groups versus VFD-0. For the “previous treatment” variable, untreated previously diagnosed or newly diagnosed patients were considered “untreated”, while previously diagnosed patients who had received medical and/or surgical treatment (or were currently under medical treatment) were considered “treated”.
When considering eyes as units of analysis, since we had to consider more than one measurement on the same subject (VF stage according to the Glaucoma Staging System 2, BCVA, MD, PSD, GSS questionnaire score), we needed to consider the correlation between these variables on the same subject. This analysis was performed
with a mixed model in order to take into account the correlation between eyes of the same subject (performed with mixed procedure). In our analysis the covariance structure hypothesized was the unstructured matrix. “Unstructured” means that no constraints were imposed on the values of covariance and variance. Therefore, the model estimates these quantities. Because there are about 6000 observations in our analysis, our study had the statistical power necessary to estimate the covariance structure from the data without compromising the efficiency of the model.
Figure 1. Visual field stages according to Glaucoma Staging System 2: simulation of what patients see at
different stages. On the left Glaucoma Staging System 2 diagrams, in the middle visual field gray scale, on the right simulation of what patients see.
Two multivariate analyses were performed to test the effect of presence and stage of VF damage at eye level on GSS questionnaire scores: the covariates of the first analysis included eye groups according to presence of glau-coma and VF damage (WOG, WOD, WD), age, BCVA and previous treatment (treated versus untreated). The covariates of the second analysis included VF stage (according to the Glaucoma Staging System 2), age and BCVA. All analyses were performed with the SAS software (version 9.2).
The study was conducted in accordance with the tenets of the Declaration of Helsinki and the Guidelines for Good Clinical Practice. The ethic committee of Brescia (Comitato Etico provinciale di Brescia), and of each par-ticipating centre approved the protocol (see list of Membership of the Italian Study Group on QoL in Glaucoma and participating centers). For inclusion, patients had to provide informed consent after the nature and purpose of the survey were fully explained. The study was registered with clinicaltrials.gov (NCT01742104).
Data Availability
The datasets generated during the current study are available from the corresponding author on reasonable request.
Results
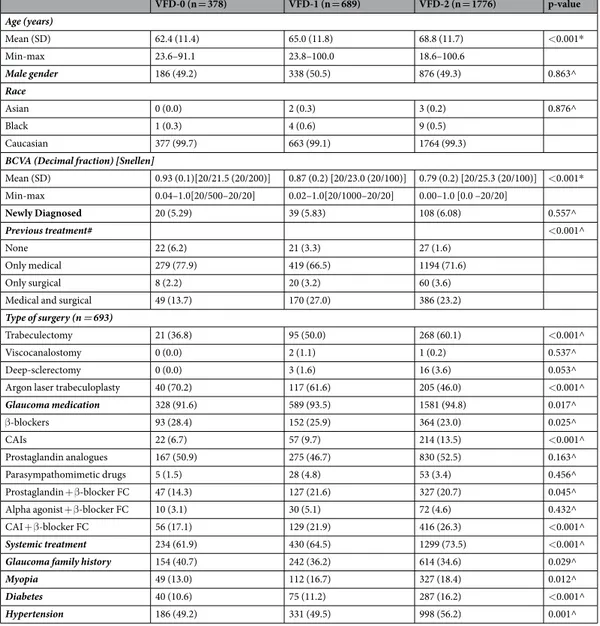
From March 2012 to July 2013, 3227 patients were enrolled in 21 centers. Two hundred eighty seven patients were subsequently excluded due to incomplete filling of questionnaires (n = 58), incomplete data on staging (n = 47) or missing data on BCVA (n = 182). Consequently, 2940 patients were included in the per-eye analysis. As data on both eyes was not available for all patients, 2823 patients were included in the per-patient analysis. The demo-graphic characteristics of the participants are presented in Table 1.
Patient as unit of analysis.
Three hundred seventy eight patients (13.4%) were grouped as VFD-0, 669 (23.7%) as VFD-1 and 1776 (62.9%) as VFD-2. Having more eyes with VF damage was associated with older age (p < 0.001) and worse BCVA (p < 0.001), but not with gender and race. Family history (p = 0.029), myopia (p = 0.012), diabetes (p < 0.001) and hypertension (p = 0.001) were all risk factors for having bilateral VF damage. The percentage of patients using glaucoma medications was increasingly higher as the number of eyes with VF defects increased (91.6% for VFD-0 vs 93.5% for VFD-1 vs 94.8% for VFD-2, p = 0.017). Similarly, the percentage of patients using systemic concomitant treatments was increasingly higher as the number of eyes with VF defects increased (61.9% for VFD-0 vs 64.5% for VFD-1 vs 73.5% for VFD-2, p < 0.001) (Table 1).Descriptive statistics for the GSS and NEI-VFQ-25 questionnaires are reported in Table 2. For the GSS ques-tionnaire, the score of the visual symptoms domain (Func-4) for VFD-0 was similar to VFD-1 (adjusted mean difference (aMD) = −2.16 standard error (SE) = 1.44,p = 0.133), but significantly higher than VFD-2 patients (aMD = −8.30, SE = 1.30, p < 0.001) after adjusting for age, BCVA and previous treatment. The score of the non-visual symptoms domain (Symp-6) for VFD-0 was similar to VFD-1 (aMD = −0.29, SE = 1.36, p = 0.834), but higher than VFD-2 (aMD = −2.61, SE = 1.24, p = 0.035) after adjusting for age, BCVA and previous treat-ment. Better BCVA and advanced age were associated with higher scores for both domains (BCVA: p < 0.001 and p = 0.012 for Func-4 and Symp-6 respectively; age: p < 0.001 and 0.032 for Func-4 and Symp-6 respectively), while previous treatment was not associated with any score (p = 0.063 and p = 0.276 for Func-4 and Symp-6 respectively). The same pattern was observed for the total score (Table 3).
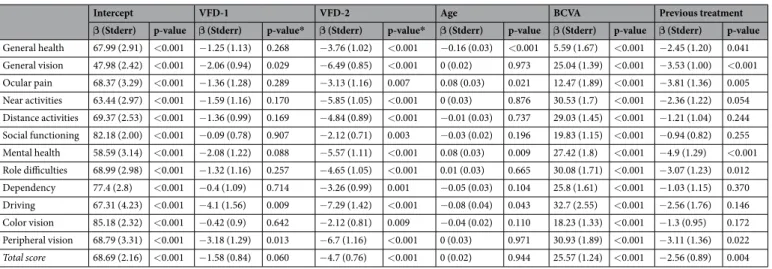
Regarding the NEI-VFQ-25 questionnaire, our data indicate that bilateral VF defects are associated with vision-related QoL deterioration irrespective of BCVA (Table 4). Additionally, patients in the VFD-0 group had significantly higher vision-related QoL scores than patients in the VFD-1 group in the “General vision” (p = 0.029), “Driving” (p = 0.009) and “Peripheral vision” (0.013) subscales after adjusting for age, BCVA and previous treatment. In other words, even patients with VF defects in only one eye had significantly worse vision-related QoL scores in 3 of 12 subscales compared to patients without VF defects in any eye. Better BCVA was associated with higher scores for all subscales (p < 0.001 for all subscales). A similar pattern was observed for the total NEI-VFQ-25 score (Table 4).
Eye as unit of analysis.
When considering eyes as units of analysis, 106 (1.9%) out of 5729 eyes were classi-fied as WOG, 1304 (22.8%) as WOD and 4319 (75.4%) as WD.Results of the GSS questionnaire based on presence of glaucoma and VF loss are depicted in Fig. 2. After adjusting for age, BCVA and previous treatment, not only glaucomatous eyes with VF defects (WD), but also glaucomatous eyes without VF defects (WOD) were associated with lower scores in the non-visual symptoms domain (Symp-6) compared to eyes without glaucoma (WOG) (p = 0.005 and p < 0.001 for WOD and WD respectively). For the visual symptoms domain (Func-4) only WD showed a lower score than eyes without glau-coma (WOG) (p < 0.001), while no statistically significant difference was detected between WOD and WOG (p = 0.169) (Table 5). Better BCVA was associated with higher score for both domains and total score (p < 0.001). Age was statistically significant only for Symp-6 (p = 0.04), while previous treatment was only significant for Func-4 (p = 0.013).
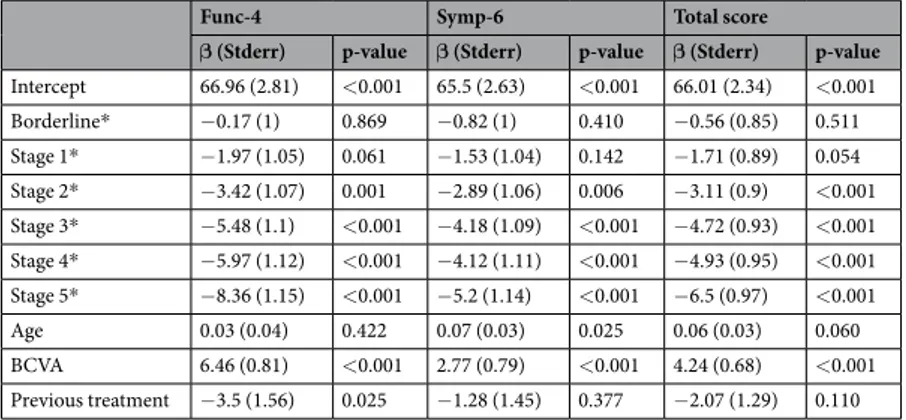
The analysis of GSS results based on stage as determined with Glaucoma Staging System 2 is depicted in Fig. 3. Both in the non-visual symptoms domain (Symp-6) and in the visual symptoms domain (Func-4), a significant inverse relationship between VF stage and GSS score was seen after adjustment for age, BCVA and previous treat-ment. The differences became statistically significant at stage 2, compared to stage 0. The same association was observed for total score (Table 6). Better BCVA was associated with higher score for both domains and total score. With the exception of the non-visual symptoms domain (Symp-6) (p = 0.025), age was not statistically significant. Previous treatment was statistically significant only for Func-4 (p = 0.025).
Discussion
In the current study, being older was associated with a higher number of perimetrically affected eyes. A possible explanation for this association is that glaucoma is a chronic disease of the elderly, and the chances of perimetric defects appearing in one or both eyes increase with advancing age. Moreover, we found that factors such as family history, myopia, diabetes and systemic hypertension were associated with bilateral VF damage. These conditions have not consistently been demonstrated to be risk factors for the onset and progression of the disease41,42.
The proportion of patients using concomitant systemic treatments was higher for those with VF damage. Evidence has shown that systemic medications such as statins43,44, calcium channel blockers45 or diuretics46 have an influence on glaucoma risk. The exact effect of common systemic vasoactive medications on glaucoma risk remains to be determined. In the case of systemically administered β-blockers for instance, although this class of medications can have a protective effect in glaucoma because of a certain ocular hypotensive effect, the con-current reduction in blood pressure may compromise optic nerve perfusion pressure47. In fact, evidence from population-based studies has shown that systemic hypotension may be associated with an increased prevalence and incidence of open-angle glaucoma48–50.
Deterioration of vision-related QoL has been reported even in patients with early VF loss21,22. In the Los Angeles Latino Eye Study for instance, adults with glaucoma experienced measurable loss in QoL early in the disease process22. Our data from a larger, ethnically different population are in accordance with those results: we found that patients with VF damage in one eye had lower vision-related QoL scores in three of twelve NEI-VFQ-25 subscales compared to patients without VF damage in any eye. There are several reasons for the
VFD-0 (n = 378) VFD-1 (n = 689) VFD-2 (n = 1776) p-value Age (years) Mean (SD) 62.4 (11.4) 65.0 (11.8) 68.8 (11.7) <0.001* Min-max 23.6–91.1 23.8–100.0 18.6–100.6 Male gender 186 (49.2) 338 (50.5) 876 (49.3) 0.863^ Race Asian 0 (0.0) 2 (0.3) 3 (0.2) 0.876^ Black 1 (0.3) 4 (0.6) 9 (0.5) Caucasian 377 (99.7) 663 (99.1) 1764 (99.3)
BCVA (Decimal fraction) [Snellen]
Mean (SD) 0.93 (0.1)[20/21.5 (20/200)] 0.87 (0.2) [20/23.0 (20/100)] 0.79 (0.2) [20/25.3 (20/100)] <0.001* Min-max 0.04–1.0[20/500–20/20] 0.02–1.0[20/1000–20/20] 0.00–1.0 [0.0 –20/20] Newly Diagnosed 20 (5.29) 39 (5.83) 108 (6.08) 0.557^ Previous treatment# <0.001^ None 22 (6.2) 21 (3.3) 27 (1.6) Only medical 279 (77.9) 419 (66.5) 1194 (71.6) Only surgical 8 (2.2) 20 (3.2) 60 (3.6)
Medical and surgical 49 (13.7) 170 (27.0) 386 (23.2)
Type of surgery (n = 693)
Trabeculectomy 21 (36.8) 95 (50.0) 268 (60.1) <0.001^
Viscocanalostomy 0 (0.0) 2 (1.1) 1 (0.2) 0.537^
Deep-sclerectomy 0 (0.0) 3 (1.6) 16 (3.6) 0.053^
Argon laser trabeculoplasty 40 (70.2) 117 (61.6) 205 (46.0) <0.001^
Glaucoma medication 328 (91.6) 589 (93.5) 1581 (94.8) 0.017^ β-blockers 93 (28.4) 152 (25.9) 364 (23.0) 0.025^ CAIs 22 (6.7) 57 (9.7) 214 (13.5) <0.001^ Prostaglandin analogues 167 (50.9) 275 (46.7) 830 (52.5) 0.163^ Parasympathomimetic drugs 5 (1.5) 28 (4.8) 53 (3.4) 0.456^ Prostaglandin + β-blocker FC 47 (14.3) 127 (21.6) 327 (20.7) 0.045^
Alpha agonist + β-blocker FC 10 (3.1) 30 (5.1) 72 (4.6) 0.432^
CAI + β-blocker FC 56 (17.1) 129 (21.9) 416 (26.3) <0.001^
Systemic treatment 234 (61.9) 430 (64.5) 1299 (73.5) <0.001^
Glaucoma family history 154 (40.7) 242 (36.2) 614 (34.6) 0.029^
Myopia 49 (13.0) 112 (16.7) 327 (18.4) 0.012^
Diabetes 40 (10.6) 75 (11.2) 287 (16.2) <0.001^
Hypertension 186 (49.2) 331 (49.5) 998 (56.2) 0.001^
Table 1. Characteristics of study subjects based on the number of eyes with visual field damage. Min, minimum
value; max, maximum value; SD, standard deviation; BCVA, best corrected visual acuity; VFD-0, patients without visual field damage in any eye; VFD-1, patients with visual field damage in one eye; VFD-2, patients with visual field damage in both eyes; CAI, carbonic anhydrase inhibitor; FC, fixed combination; *, linear regression model; ^, chi square test for trend; #in patients not newly diagnosed.
deterioration of QoL in early glaucoma. The most important is obviously related to the adverse effects, inconven-ience and cost of antiglaucoma medications51–53. Another reason may be the psychological burden of suffering from a potentially blinding disease54. This psychological pressure may explain the observation that even the diag-nosis of “glaucoma suspect” is associated with deterioration of vision-related QoL9,55,56. At least in theory, a third reason that could explain the deterioration of vision-related QoL even in perimetrically unaffected glaucomatous eyes is that certain aspects of visual function beyond retinal sensitivity, such as color perception, contrast sensi-tivity and motion perception are affected early in the glaucomatous process57,58.
In our study, both visual and non-visual glaucoma-related symptoms were more bothersome with increas-ing stage of perimetric damage. Of note, eyes with pre-perimetric glaucoma (or eyes suspicious for glaucoma) had worse score in the non-visual symptoms domain and worse total score at the GSS questionnaire than eyes without glaucoma. We believe that the worse symptom scores in these eyes are due to the use of anti-glaucoma medications.
In the present investigation, patients with glaucoma and VF damage in both eyes had significantly worse scores in both the non-visual and the visual symptom domains of the GSS tool compared to patients with-out VF defects in any eye. The visual symptoms domain in particular showed good discrimination between patients with visual field defects in both eyes and patients without visual field defects in any eye. In patients with advanced glaucoma, the areas of VF defects in each eye may coincide, resulting in binocular VF loss59. Several studies have shown that patients with binocular VF loss experience severe difficulties in activities of daily life, such as reading, moving around or driving15–18. The location of VF defects may also play an impor-tant role in the patients’ functioning and perception of vision-related QoL22. For example, Sawada et al.60 have shown that perimetric defects in the lower paracentral visual field of the better eye have the strongest correla-tion with NEI-VFQ-25 scores. These authors also reported that defects in the upper temporal visual field have a strong impact on the driving subscale of the NEI-VFQ-25 questionnaire (r = 0.509, p < 0.001), while defects at the lower peripheral visual field strongly correlate with subscales such as role limitation (r = 0.459, p < 0.001) and peripheral vision (r = 0.425, p < 0.001)60. Other investigators have found that superior perimetric defects in binocular integrated visual fields are associated with difficulty with near activities, while inferior perimetric defects in binocular integrated visual fields are associated with vision-specific role difficulties, as well as general and peripheral vision61.
Our report provides evidence that VF loss is associated with decreased vision-related QoL in a manner that is independent of BCVA deterioration. To date, several studies have shown that visual acuity loss is one of the causes associated with lower vision-related QoL in glaucoma patients62–64.
The current study constitutes the largest investigation on vision-related QoL and glaucoma-related symp-toms12,22,24,25,28,65–80. However, our sample cannot be considered representative in a strict methodological sense because it was not formed by means of random inclusion from a central nationwide registry. Since such a reg-istry is not available, our sample can be considered as close as possible to being representative by virtue of its wide-ranging geographical distribution, recruitment from diverse academic and non-academic centers, and size.
VFD-0 VFD-1 VFD-2 Mean (SD) Mean (SD) Mean (SD) GSS questionnaire Func-4 84.0 (18.6) 80.5 (19.7) 73.0 (24.6) Symp-6 76.1 (21.7) 75.6 (20.2) 73.2 (21.3) Total score 79.4 (18.0) 77.6 (17.3) 73.1 (19.7) NEI-VFQ-25 General health 60.88 (17.04) 58.77 (17.53) 55.25 (17.82) General vision 68.06 (13.16) 64.31 (14.42) 58.05 (16.21) Ocular pain 81.3 (18.6) 79.28 (18.57) 76.83 (20.72) Near activities 90 (13.46) 86.41 (15.68) 79.97 (20.9) Distance activities 94.74 (9.23) 91.48 (13.12) 85.88 (18.44) Vision-specific social functioning 98.18 (6.94) 96.72 (9.61) 93.18 (14.52) Vision-specific mental health 84.83 (14.09) 81.09 (17.65) 75.9 (21.35) Vision-specific role difficulties 95.02 (12.41) 91.73 (15.64) 86.26 (21.05) Vision-specific dependency 97.64 (8.91) 95.44 (13.88) 90.57 (20.14) Driving 90.38 (14.49) 83.91 (20.99) 78.61 (25.26) Color vision 98.67 (7.62) 96.95 (11.28) 93.82 (16.38) Peripheral vision 94.69 (12.57) 89.46 (18.33) 83.7 (23.01) Total score 90.27 (8.22) 87.00 (11.29) 82.03 (15.74)
Table 2. Glaucoma Symptom Scale (GSS) and National Eye Institute Visual Function (NEI-VFQ-25)
questionnaire scores based on the number of eyes with visual field damage. SD, standard deviation; VFD-0, patients without visual field damage in any eye; VFD-1, patients with visual field damage in one eye; VFD-2, patients with visual field damage in both eyes; GSS, Glaucoma Symptom Scale; NEI-VFQ-25, National Eye Institute Visual Function Questionnaire-25.
Intercept VFD-1 VFD-2 Age BCVA Previous treatment β (Stderr) p-value β (Stderr) p-value* β (Stderr) p-value* β (Stderr) p-value β (Stderr) p-value β (Stderr) p-value Func-4 54.24 (3.69) <0.001 −2.16 (1.44) 0.133 −8.3 (1.3) <0.001 0.13 (0.04) <0.001 25.75 (2.11) <0.001 −2.82 (1.52) 0.063 Symp-6 68.14 (3.51) <0.001 −0.29 (1.36) 0.834 −2.61 (1.24) 0.035 0.07 (0.03) 0.032 5.04 (2.01) 0.012 −1.57 (1.44) 0.276 Total score 62.58 (3.12) <0.001 −1.15 (1.21) 0.344 −4.97 (1.1) <0.001 0.1 (0.03) 0.001 13.32 (1.78) <0.001 −1.98 (1.28) 0.123
Table 3. Glaucoma Symptom Scale (GSS) questionnaire scores and number of eyes with visual field damage:
statistical analysis (per-patient analysis). VFD-1, patients with visual field damage in one eye; VFD-2, patients with visual field damage in both eyes; BCVA, best corrected visual acuity; β, beta coefficient; SE, standard error for beta coefficient; p-value for multivariate linear regression model including visual field damage groups, BCVA, age, previous treatment (treated versus untreated); *, p-values for VFD-1 and VFD-2 refer to the comparison between each group and VFD-0 (patients without visual field damage in any eye).
Intercept VFD-1 VFD-2 Age BCVA Previous treatment
β (Stderr) p-value β (Stderr) p-value* β (Stderr) p-value* β (Stderr) p-value β (Stderr) p-value β (Stderr) p-value General health 67.99 (2.91) <0.001 −1.25 (1.13) 0.268 −3.76 (1.02) <0.001 −0.16 (0.03) <0.001 5.59 (1.67) <0.001 −2.45 (1.20) 0.041 General vision 47.98 (2.42) <0.001 −2.06 (0.94) 0.029 −6.49 (0.85) <0.001 0 (0.02) 0.973 25.04 (1.39) <0.001 −3.53 (1.00) <0.001 Ocular pain 68.37 (3.29) <0.001 −1.36 (1.28) 0.289 −3.13 (1.16) 0.007 0.08 (0.03) 0.021 12.47 (1.89) <0.001 −3.81 (1.36) 0.005 Near activities 63.44 (2.97) <0.001 −1.59 (1.16) 0.170 −5.85 (1.05) <0.001 0 (0.03) 0.876 30.53 (1.7) <0.001 −2.36 (1.22) 0.054 Distance activities 69.37 (2.53) <0.001 −1.36 (0.99) 0.169 −4.84 (0.89) <0.001 −0.01 (0.03) 0.737 29.03 (1.45) <0.001 −1.21 (1.04) 0.244 Social functioning 82.18 (2.00) <0.001 −0.09 (0.78) 0.907 −2.12 (0.71) 0.003 −0.03 (0.02) 0.196 19.83 (1.15) <0.001 −0.94 (0.82) 0.255 Mental health 58.59 (3.14) <0.001 −2.08 (1.22) 0.088 −5.57 (1.11) <0.001 0.08 (0.03) 0.009 27.42 (1.8) <0.001 −4.9 (1.29) <0.001 Role difficulties 68.99 (2.98) <0.001 −1.32 (1.16) 0.257 −4.65 (1.05) <0.001 0.01 (0.03) 0.665 30.08 (1.71) <0.001 −3.07 (1.23) 0.012 Dependency 77.4 (2.8) <0.001 −0.4 (1.09) 0.714 −3.26 (0.99) 0.001 −0.05 (0.03) 0.104 25.8 (1.61) <0.001 −1.03 (1.15) 0.370 Driving 67.31 (4.23) <0.001 −4.1 (1.56) 0.009 −7.29 (1.42) <0.001 −0.08 (0.04) 0.043 32.7 (2.55) <0.001 −2.56 (1.76) 0.146 Color vision 85.18 (2.32) <0.001 −0.42 (0.9) 0.642 −2.12 (0.81) 0.009 −0.04 (0.02) 0.110 18.23 (1.33) <0.001 −1.3 (0.95) 0.172 Peripheral vision 68.79 (3.31) <0.001 −3.18 (1.29) 0.013 −6.7 (1.16) <0.001 0 (0.03) 0.971 30.93 (1.89) <0.001 −3.11 (1.36) 0.022 Total score 68.69 (2.16) <0.001 −1.58 (0.84) 0.060 −4.7 (0.76) <0.001 0 (0.02) 0.944 25.57 (1.24) <0.001 −2.56 (0.89) 0.004 Table 4. National Eye Institute Visual Function (NEI-VFQ-25) questionnaire scores and number of eyes with
visual field damage: statistical analysis (per-patient analysis). SD, standard deviation; VFD-1, patients with visual field damage in one eye; VFD-2, patients with visual field damage in both eyes; BCVA, best corrected visual acuity; β, beta coefficient; SE, standard error for beta coefficient; p-value for multivariate linear regression model including visual field damage groups, BCVA, age, previous treatment (treated versus untreated); *, p-values for VFD-1 and VFD-2 refer to the comparison between each group and VFD-0 (patients without visual field damage in any eye).
Figure 2. Glaucoma Symptom Scale (GSS) questionnaire scores depending on the presence of glaucoma and
Another limitation of our study is related to the use of the NEI-VFQ-25 questionnaire. Despite its wide-spread adoption in QoL research, this tool is not free of drawbacks. Although traditional validation techniques have shown that the tool is valid and reliable for the evaluation of vision-specific QoL, some advanced statistical approaches have detected low precision at least for some of its items67,73,81,82. In general, the evaluation of QoL
Func-4 Symp-6 Total score
β (Stderr) p-value β (Stderr) p-value β (Stderr) p-value Intercept 69.55 (2.81) <0.001 66.89 (2.61) <0.001 67.9 (2.33) <0.001 WOD* −2.41 (1.75) 0.169 −4.84 (1.7) 0.005 −3.81 (1.47) 0.009 WD* −6 (1.71) <0.001 −6.59 (1.66) <0.001 −6.31 (1.43) <0.001 Age 0.02 (0.04) 0.555 0.07 (0.03) 0.040 0.05 (0.03) 0.100 BCVA 9.27 (0.77) <0.001 4.37 (0.74) <0.001 6.34 (0.64) <0.001 Previous treatment −3.89 (1.56) 0.013 −1.48 (1.44) 0.306 −2.34 (1.29) 0.070
Table 5. Glaucoma Symptom Scale (GSS) questionnaire scores and visual field damage: statistical analysis
(per-eye analysis). WOD, (per-eyes with glaucoma but no visual field damage; WD, (per-eyes with glaucoma and visual field damage (stage 1 or greater); BCVA, best corrected visual acuity; β, beta coefficient; SE, standard error for beta coefficient; p-value for multivariate mixed model including visual field damage groups, BCVA, age, previous treatment (treated versus untreated); *, p-values for WOD and WD refer to the comparison between each group and the WOG (eyes without signs of glaucoma).
Figure 3. Glaucoma Symptom Scale (GSS) questionnaire scores by stage according to Glaucoma Staging
using a questionnaire has some limitations. One of them is that QoL assessment is subjective, so that patients with similar disability may rate their QoL differently. Another inherent limitation of this type of investigations is that self-reported visual ability can be impaired, at least to some extent, by several ophthalmic and systemic comorbid-ities and psychosocial constraints. Conceivably, even when VF indices such as MD are comparable, a multitude of diverse determinants such as spatial distribution and depth of VF scotomas or speed of VF deterioration may affect differently patients with dissimilar lifestyles and expectations83. A certain limitation of our eye-level analysis is that the “non-glaucomatous” eyes (WOG) were not eyes of healthy controls, but fellow eyes of patients with monocular glaucoma (or fellow eyes of patients with high suspicion for monocular glaucoma.
In conclusion, in the current study, having more eyes with VF damage was associated with older age and worse BCVA. Self-reported family history of glaucoma, myopia, diabetes mellitus and systemic hypertension were all associated with bilateral VF defects. The percentage of patients using glaucoma medications was increasingly higher as the number of eyes with VF defects increased. At the patient level analysis, participants with no VF defects in any eye or VF defects in one eye had significantly better scores in the glaucoma-related vision- and non-vision symptom scores of the GSS instrument compared to patients with bilateral VF defects after adjusting for age and BCVA. After adjusting for age and BCVA, patients without VF defects in any eye had significantly better NEI-VFQ-25 scores in 3 of 12 subscales (“general vision”, “driving”, “peripheral vision”) compared to patients with VF defects in one eye, and better NEI-VFQ-25 scores in all subscales compared to patients with VF defects in both eyes. At the eye level analysis, after adjusting for age and BCVA, eyes without glaucoma had significantly better scores than eyes with glaucoma that had VF defects or eyes with glaucoma that did not have VF defects in both the visual and non-visual symptom domains of the GSS instrument. A significant inverse relationship between VF stage and both the visual and non-visual symptom scores of the GSS tool was seen after adjustment for age and BCVA.
References
1. Quigley, H. A. Glaucoma. Lancet 377, 1367–1377, https://doi.org/10.1016/S0140-6736(10)61423-7 (2011).
2. Bonomi, L. et al. Prevalence of glaucoma and intraocular pressure distribution in a defined population. The Egna-Neumarkt Study.
Ophthalmology 105, 209–215 (1998).
3. Kwon, Y. H., Fingert, J. H., Kuehn, M. H. & Alward, W. L. Primary open-angle glaucoma. N Engl J Med 360, 1113–1124, https://doi. org/10.1056/NEJMra0804630 (2009).
4. Hinds, A. et al. Impact of an interdisciplinary low vision service on the quality of life of low vision patients. Br J Ophthalmol 87, 1391–1396 (2003).
5. Dodds, A. The psychology of rehabilitation. Br J Vis Impair 9, 38–40 (1991).
6. Caputo, B. J. & Katz, L. J. The quality of life of the glaucoma patient in the light of treatment modalities. Current Opinion in
Ophthalmology 5, 10–14 (1994).
7. Lichter, P. R. et al. Interim clinical outcomes in the Collaborative Initial Glaucoma Treatment Study comparing initial treatment randomized to medications or surgery. Ophthalmology 108, 1943–1953 (2001).
8. Janz, N. K. et al. The Collaborative Initial Glaucoma Treatment Study: interim quality of life findings after initial medical or surgical treatment of glaucoma. Ophthalmology 108, 1954–1965 (2001).
9. Odberg, T., Jakobsen, J. E., Hultgren, S. J. & Halseide, R. The impact of glaucoma on the quality of life of patients in Norway. I. Results from a self-administered questionnaire. Acta Ophthalmol Scand 79, 116–120 (2001).
10. Parrish, R. K. II. Visual impairment, visual functioning, and quality of life assessments in patients with glaucoma. Trans Am
Ophthalmol Soc 94, 919–1028 (1996).
11. Jampel, H. D. et al. Depression and mood indicators in newly diagnosed glaucoma patients. Am J Ophthalmol 144, 238–244, https:// doi.org/10.1016/j.ajo.2007.04.048 (2007).
12. Janz, N. K. et al. Fear of blindness in the Collaborative Initial Glaucoma Treatment Study: patterns and correlates over time.
Ophthalmology 114, 2213–2220, https://doi.org/10.1016/j.ophtha.2007.02.014 (2007).
13. Janz, N. K. et al. Quality of life in newly diagnosed glaucoma patients: The Collaborative Initial Glaucoma Treatment Study.
Ophthalmology 108, 887–897 (2001).
14. European Glaucoma Society. Terminology and guidelines for glaucoma, 4th Edn. (PubliComm, 2014).
15. Friedman, D. S., Freeman, E., Munoz, B., Jampel, H. D. & West, S. K. Glaucoma and mobility performance: the Salisbury Eye Evaluation Project. Ophthalmology 114, 2232–2237, https://doi.org/10.1016/j.ophtha.2007.02.001 (2007).
Func-4 Symp-6 Total score
β (Stderr) p-value β (Stderr) p-value β (Stderr) p-value Intercept 66.96 (2.81) <0.001 65.5 (2.63) <0.001 66.01 (2.34) <0.001 Borderline* −0.17 (1) 0.869 −0.82 (1) 0.410 −0.56 (0.85) 0.511 Stage 1* −1.97 (1.05) 0.061 −1.53 (1.04) 0.142 −1.71 (0.89) 0.054 Stage 2* −3.42 (1.07) 0.001 −2.89 (1.06) 0.006 −3.11 (0.9) <0.001 Stage 3* −5.48 (1.1) <0.001 −4.18 (1.09) <0.001 −4.72 (0.93) <0.001 Stage 4* −5.97 (1.12) <0.001 −4.12 (1.11) <0.001 −4.93 (0.95) <0.001 Stage 5* −8.36 (1.15) <0.001 −5.2 (1.14) <0.001 −6.5 (0.97) <0.001 Age 0.03 (0.04) 0.422 0.07 (0.03) 0.025 0.06 (0.03) 0.060 BCVA 6.46 (0.81) <0.001 2.77 (0.79) <0.001 4.24 (0.68) <0.001 Previous treatment −3.5 (1.56) 0.025 −1.28 (1.45) 0.377 −2.07 (1.29) 0.110
Table 6. Glaucoma Symptom Scale (GSS) questionnaire scores and stage of visual field damage: statistical
analysis (per-eye analysis). BCVA, best corrected visual acuity; β, beta coefficient; SE, standard error for beta coefficient; p-value for multivariate mixed model including visual field stage groups, BCVA, age, previous treatment (treated versus untreated); *, p-values for borderline, stage1, stage 2, stage 3, stage 4, stage 5 groups refer to the comparison between each stage group and stage 0.
16. Haymes, S. A., Leblanc, R. P., Nicolela, M. T., Chiasson, L. A. & Chauhan, B. C. Risk of falls and motor vehicle collisions in glaucoma.
Invest Ophthalmol Vis Sci 48, 1149–1155, https://doi.org/10.1167/iovs.06-0886 (2007).
17. Haymes, S. A., LeBlanc, R. P., Nicolela, M. T., Chiasson, L. A. & Chauhan, B. C. Glaucoma and on-road driving performance. Invest
Ophthalmol Vis Sci 49, 3035–3041, https://doi.org/10.1167/iovs.07-1609 (2008).
18. Ramulu, P. Glaucoma and disability: which tasks are affected, and at what stage of disease? Curr Opin Ophthalmol 20, 92–98, https:// doi.org/10.1097/ICU.0b013e32832401a9 (2009).
19. Nelson, P., Aspinall, P., Papasouliotis, O., Worton, B. & O’Brien, C. Quality of life in glaucoma and its relationship with visual function. J Glaucoma 12, 139–150 (2003).
20. Peters, D., Heijl, A., Brenner, L. & Bengtsson, B. Visual impairment and vision-related quality of life in the Early Manifest Glaucoma Trial after 20 years of follow-up. Acta Ophthalmol, https://doi.org/10.1111/aos.12839 (2015).
21. McKean-Cowdin, R., Varma, R., Wu, J., Hays, R. D. & Azen, S. P. Severity of visual field loss and health-related quality of life. Am J
Ophthalmol 143, 1013–1023, https://doi.org/10.1016/j.ajo.2007.02.022 (2007).
22. McKean-Cowdin, R., Wang, Y., Wu, J., Azen, S. P. & Varma, R. Impact of visual field loss on health-related quality of life in glaucoma: the Los Angeles Latino Eye Study. Ophthalmology 115, 941–948 e941, https://doi.org/10.1016/j.ophtha.2007.08.037 (2008). 23. Floriani, I. et al. Health-related quality of life in patients with primary open-angle glaucoma. An Italian multicentre observational
study. Acta Ophthalmol, https://doi.org/10.1111/aos.12890 (2015).
24. Rossi, G. C., Milano, G. & Tinelli, C. The Italian version of the 25-item National Eye Institute Visual Function Questionnaire: translation, validity, and reliability. J Glaucoma 12, 213–220 (2003).
25. Rossi, G. C. et al. The Italian version of the Glaucoma Symptom Scale Questionnaire: translation, validation, and reliability. J
Glaucoma 22, 44–51, https://doi.org/10.1097/IJG.0b013e318225406c (2013).
26. Mangione, C. M. et al. Identifying the content area for the 51-item National Eye Institute Visual Function Questionnaire: results from focus groups with visually impaired persons. Arch Ophthalmol 116, 227–233 (1998).
27. Mangione, C. M. et al. Psychometric properties of the National Eye Institute Visual Function Questionnaire (NEI-VFQ). NEI-VFQ Field Test Investigators. Arch Ophthalmol 116, 1496–1504 (1998).
28. Mangione, C. M. et al. Development of the 25-item National Eye Institute Visual Function Questionnaire. Arch Ophthalmol 119, 1050–1058 (2001).
29. Lee, B. L. et al. The Glaucoma Symptom Scale. A brief index of glaucoma-specific symptoms. Arch Ophthalmol 116, 861–866 (1998). 30. Brusini, P. Clinical use of a new method for visual field damage classification in glaucoma. Eur J Ophthalmol 6, 402–407 (1996). 31. Brusini, P. & Filacorda, S. Enhanced Glaucoma Staging System (GSS 2) for classifying functional damage in glaucoma. J Glaucoma
15, 40–46 (2006).
32. Brusini, P. & Johnson, C. A. Staging functional damage in glaucoma: review of different classification methods. Surv Ophthalmol 52, 156–179, https://doi.org/10.1016/j.survophthal.2006.12.008 (2007).
33. Advanced Glaucoma Intervention Study. 2. Visual field test scoring and reliability. Ophthalmology 101, 1445–1455 (1994). 34. Hodapp, E., Parrish, R. n. & Anderson, D. Clinical decisions in glaucoma. 1st edn, (1993).
35. Ng, M. et al. Comparison of visual field severity classification systems for glaucoma. J Glaucoma 21, 551–561, https://doi. org/10.1097/IJG.0b013e31821dac66 (2012).
36. Zheng, Y. et al. Diagnostic ability of Heidelberg Retina Tomography in detecting glaucoma in a population setting: the Singapore Malay Eye Study. Ophthalmology 117, 290–297, https://doi.org/10.1016/j.ophtha.2009.07.018 (2010).
37. Le, P. V. et al. Advanced imaging for glaucoma study: design, baseline characteristics, and inter-site comparison. Am J Ophthalmol 159, 393–403 e392, https://doi.org/10.1016/j.ajo.2014.11.010 (2015).
38. Roh, K. H., Jeoung, J. W., Park, K. H., Yoo, B. W. & Kim, D. M. Long-term reproducibility of cirrus HD optical coherence tomography deviation map in clinically stable glaucomatous eyes. Ophthalmology 120, 969–977, https://doi.org/10.1016/j.ophtha.2012.11.008 (2013). 39. Fogagnolo, P. et al. Long-term perimetric fluctuation in patients with different stages of glaucoma. Br J Ophthalmol 95, 189–193,
https://doi.org/10.1136/bjo.2010.182758 (2011).
40. Frezzotti, P. et al. Association between primary open-angle glaucoma (POAG) and WDR36 sequence variance in Italian families affected by POAG. Br J Ophthalmol 95, 624–626, https://doi.org/10.1136/bjo.2009.167494 (2011).
41. Zhou, M., Wang, W., Huang, W. & Zhang, X. Diabetes mellitus as a risk factor for open-angle glaucoma: a systematic review and meta-analysis. PLoS One 9, e102972, https://doi.org/10.1371/journal.pone.0102972 (2014).
42. de Voogd, S. et al. Is diabetes mellitus a risk factor for open-angle glaucoma? The Rotterdam Study. Ophthalmology 113, 1827–1831, https://doi.org/10.1016/j.ophtha.2006.03.063 (2006).
43. Marcus, M. W. et al. Cholesterol-lowering drugs and incident open-angle glaucoma: a population-based cohort study. PLoS One 7, e29724, https://doi.org/10.1371/journal.pone.0029724 (2012).
44. Stein, J. D. et al. The relationship between statin use and open-angle glaucoma. Ophthalmology 119, 2074–2081, https://doi. org/10.1016/j.ophtha.2012.04.029 (2012).
45. Muskens, R. P. et al. Systemic antihypertensive medication and incident open-angle glaucoma. Ophthalmology 114, 2221–2226, https://doi.org/10.1016/j.ophtha.2007.03.047 (2007).
46. Miglior, S. et al. Intercurrent factors associated with the development of open-angle glaucoma in the European glaucoma prevention study. Am J Ophthalmol 144, 266–275, https://doi.org/10.1016/j.ajo.2007.04.040 (2007).
47. Quaranta, L., Katsanos, A., Russo, A. & Riva, I. 24-hour intraocular pressure and ocular perfusion pressure in glaucoma. Surv
Ophthalmol 58, 26–41, https://doi.org/10.1016/j.survophthal.2012.05.003 (2013).
48. Zheng, Y. et al. Distribution of ocular perfusion pressure and its relationship with open-angle glaucoma: the singapore malay eye study. Invest Ophthalmol Vis Sci 51, 3399–3404, https://doi.org/10.1167/iovs.09-4867 (2010).
49. Memarzadeh, F., Ying-Lai, M., Chung, J., Azen, S. P. & Varma, R. Blood pressure, perfusion pressure, and open-angle glaucoma: the Los Angeles Latino Eye Study. Invest Ophthalmol Vis Sci 51, 2872–2877, https://doi.org/10.1167/iovs.08-2956 (2010).
50. Leske, M. C., Wu, S. Y., Hennis, A., Honkanen, R. & Nemesure, B. Risk factors for incident open-angle glaucoma: the Barbados Eye Studies. Ophthalmology 115, 85–93, https://doi.org/10.1016/j.ophtha.2007.03.017 (2008).
51. Balkrishnan, R., Bond, J. B., Byerly, W. G., Camacho, F. T. & Anderson, R. T. Medication-related predictors of health-related quality of life in glaucoma patients enrolled in a medicare health maintenance organization. Am J Geriatr Pharmacother 1, 75–81 (2003). 52. Jampel, H. D. et al. Patient preferences for eye drop characteristics: a willingness-to-pay analysis. Arch Ophthalmol 121, 540–546,
https://doi.org/10.1001/archopht.121.4.540 (2003).
53. Matsuura, M. et al. Developing an Item Bank to Measure Quality of Life in Individuals With Glaucoma, and the Results of the Interview With Patients: The Effect of Visual Function, Visual Field Progression Rate, Medical, and Surgical Treatments on Quality of Life. J Glaucoma 26, e64–e73, https://doi.org/10.1097/IJG.0000000000000554 (2017).
54. Chan, E. W. et al. Glaucoma and associated visual acuity and field loss significantly affect glaucoma-specific psychosocial functioning. Ophthalmology 122, 494–501, https://doi.org/10.1016/j.ophtha.2014.09.030 (2015).
55. Wilson, M. R. et al. Functional status and well-being in patients with glaucoma as measured by the Medical Outcomes Study Short Form-36 questionnaire. Ophthalmology 105, 2112–2116, https://doi.org/10.1016/S0161-6420(98)91135-6 (1998).
56. Odberg, T., Jakobsen, J. E., Hultgren, S. J. & Halseide, R. The impact of glaucoma on the quality of life of patients in Norway. II.
Patient response correlated to objective data. Acta Ophthalmol Scand 79, 121–124 (2001).
57. Rauscher, F. G., Chisholm, C. M., Edgar, D. F. & Barbur, J. L. Assessment of novel binocular colour, motion and contrast tests in glaucoma. Cell Tissue Res 353, 297–310, https://doi.org/10.1007/s00441-013-1675-x (2013).
58. Shabana, N., Cornilleau Peres, V., Carkeet, A. & Chew, P. T. Motion perception in glaucoma patients: a review. Surv Ophthalmol 48, 92–106 (2003).
59. Sippel, K. et al. Binocular glaucomatous visual field loss and its impact on visual exploration–a supermarket study. PLoS One 9, e106089, https://doi.org/10.1371/journal.pone.0106089 (2014).
60. Sawada, H., Yoshino, T., Fukuchi, T. & Abe, H. Assessment of the vision-specific quality of life using clustered visual field in glaucoma patients. J Glaucoma 23, 81–87, https://doi.org/10.1097/IJG.0b013e318265bbdc (2014).
61. Cheng, H. C. et al. Patient-reported vision-related quality of life differences between superior and inferior hemifield visual field defects in primary open-angle glaucoma. JAMA Ophthalmol 133, 269–275, https://doi.org/10.1001/jamaophthalmol.2014.4908 (2015). 62. Kobelt, G. et al. Cost-effectiveness analysis in glaucoma: what drives utility? Results from a pilot study in Sweden. Acta Ophthalmol
Scand 84, 363–371, https://doi.org/10.1111/j.1600-0420.2005.00621.x (2006).
63. Thygesen, J. et al. Late-stage, primary open-angle glaucoma in Europe: social and health care maintenance costs and quality of life of patients from 4 countries. Curr Med Res Opin 24, 1763–1770, https://doi.org/10.1185/03007990802111068 (2008).
64. Gupta, V. et al. Utility values among glaucoma patients: an impact on the quality of life. Br J Ophthalmol 89, 1241–1244, https://doi. org/10.1136/bjo.2005.068858 (2005).
65. Hirneiss, C., Vogel, M., Kampik, A., Neubauer, A. S. & Kernt, M. [Measurement of glaucoma-specific functionality with the GQL-15 and correlation with parameters of visual function]. Ophthalmologe 108, 939–946, https://doi.org/10.1007/s00347-011-2402-1 (2011). 66. Wolfram, C., Lorenz, K., Breitscheidel, L., Verboven, Y. & Pfeiffer, N. Health- and vision-related quality of life in patients with ocular
hypertension or primary open-angle glaucoma. Ophthalmologica 229, 227–234, https://doi.org/10.1159/000350553 (2013). 67. Labiris, G. et al. Psychometric properties of the Greek version of the NEI-VFQ 25. BMC Ophthalmol 8, 4, https://doi.
org/10.1186/1471-2415-8-4 (2008).
68. Labiris, G. et al. Vision-specific quality of life in Greek glaucoma patients. J Glaucoma 19, 39–43, https://doi.org/10.1097/ IJG.0b013e31819d5cf7 (2010).
69. Uenishi, Y., Tsumura, H., Miki, T. & Shiraki, K. Quality of life of elderly Japanese patients with glaucoma. Int J Nurs Pract 9, 18–25 (2003). 70. Yamagishio, K., Keiji, Y., Kimura, T., Yamabayashi, S. & Katsushima, H. [Quality of life evaluation in elderly normal tension
glaucoma patients using the Japanese version of VFQ-25]. Nihon Ganka Gakkai Zasshi 113, 964–971 (2009).
71. Sawada, H., Fukuchi, T. & Abe, H. Evaluation of the relationship between quality of vision and the visual function index in Japanese glaucoma patients. Graefes Arch Clin Exp Ophthalmol 249, 1721–1727, https://doi.org/10.1007/s00417-011-1779-5 (2011). 72. Lin, J. C. & Yang, M. C. Correlation of visual function with health-related quality of life in glaucoma patients. J Eval Clin Pract 16,
134–140, https://doi.org/10.1111/j.1365-2753.2009.01135.x (2010).
73. Wang, C. W., Chan, C. L. & Jin, H. Y. Psychometric properties of the Chinese version of the 25-item National Eye Institute Visual Function Questionnaire. Optom Vis Sci 85, 1091–1099, https://doi.org/10.1097/OPX.0b013e31818b9f23 (2008).
74. Zhou, C., Qian, S., Wu, P. & Qiu, C. Anxiety and depression in Chinese patients with glaucoma: sociodemographic, clinical, and self-reported correlates. J Psychosom Res 75, 75–82, https://doi.org/10.1016/j.jpsychores.2013.03.005 (2013).
75. Zhou, C., Yao, J., Qian, S. & Wu, P. Linguistic and psychometric validation of the Chinese version of the Glaucoma Quality of Life-15 (GQL-15-CHI): a cross-sectional study. Health Qual Life Outcomes 11, 188, https://doi.org/10.1186/1477-7525-11-188 (2013). 76. Mbadugha, C. A., Onakoya, A. O., Aribaba, O. T. & Akinsola, F. B. A comparison of the NEIVFQ25 and GQL-15 questionnaires in
Nigerian glaucoma patients. Clin Ophthalmol 6, 1411–1419, https://doi.org/10.2147/OPTH.S33592 (2012).
77. Onakoya, A. O., Mbadugha, C. A., Aribaba, O. T. & Ibidapo, O. O. Quality of life of primary open angle glaucoma patients in lagos, Nigeria: clinical and sociodemographic correlates. J Glaucoma 21, 287–295, https://doi.org/10.1097/IJG.0b013e31820d7cfd (2012). 78. Hyman, L. G., Komaroff, E., Heijl, A., Bengtsson, B. & Leske, M. C. Treatment and vision-related quality of life in the early manifest
glaucoma trial. Ophthalmology 112, 1505–1513, https://doi.org/10.1016/j.ophtha.2005.03.028 (2005).
79. Mills, R. P., Janz, N. K., Wren, P. A. & Guire, K. E. Correlation of visual field with quality-of-life measures at diagnosis in the Collaborative Initial Glaucoma Treatment Study (CIGTS). J Glaucoma 10, 192–198 (2001).
80. Goldberg, I. et al. Assessing quality of life in patients with glaucoma using the Glaucoma Quality of Life-15 (GQL-15) questionnaire.
J Glaucoma 18, 6–12, https://doi.org/10.1097/IJG.0b013e3181752c83 (2009).
81. Massof, R. W. & Fletcher, D. C. Evaluation of the NEI visual functioning questionnaire as an interval measure of visual ability in low vision. Vision Res 41, 397–413 (2001).
82. De Boer, M. R. et al. Psychometric properties of vision-related quality of life questionnaires: a systematic review. Ophthalmic Physiol
Opt 24, 257–273, https://doi.org/10.1111/j.1475-1313.2004.00187.x (2004).
83. Medeiros, F. A. et al. Longitudinal changes in quality of life and rates of progressive visual field loss in glaucoma patients.
Ophthalmology 122, 293–301, https://doi.org/10.1016/j.ophtha.2014.08.014 (2015).
Acknowledgements
Associazione Italiana Studio del Glaucoma (AISG) supported this study with an unrestricted grant. The contribution of the Fondazione Bietti in this study was supported by Ministry of Health and Fondazione Roma.
Author Contributions
E.R., L.Q., I.R., D.P., L.H., F.G., A.K., F.O., V.T. and R.N.W. participated in the design of the study and in the preparation of the paper. All members of the Italian Study Group on Quality of Life were involved in the research, and are to be considered co-authors.
Additional Information
Competing Interests: The authors declare that they have no competing interests.
Publisher's note: Springer Nature remains neutral with regard to jurisdictional claims in published maps and
institutional affiliations.
Open Access This article is licensed under a Creative Commons Attribution 4.0 International
License, which permits use, sharing, adaptation, distribution and reproduction in any medium or format, as long as you give appropriate credit to the original author(s) and the source, provide a link to the Cre-ative Commons license, and indicate if changes were made. The images or other third party material in this article are included in the article’s Creative Commons license, unless indicated otherwise in a credit line to the material. If material is not included in the article’s Creative Commons license and your intended use is not per-mitted by statutory regulation or exceeds the perper-mitted use, you will need to obtain permission directly from the copyright holder. To view a copy of this license, visit http://creativecommons.org/licenses/by/4.0/.
Consortia
Italian Study Group on QoL in Glaucoma
L. Varano
5, T. Carchedi
5, S. Talarico
5, F. Parravano
6, I. Motolese
6, S. A. Bagaglia
6, G. C. M.
Rossi
7, S. Lateri
7, L. Bossolesi
7, L. Carmassi
8, T. Rolle
9, R. Piccini
9, R. Ratiglia
10, A. Rossi
10,
S. Gandolfi
11, V. Tagliavini
11, N. Ungaro
11, M. Fossarello
12, A. Cucca
12, I. Zucca
12, M. Uva
13,
E. Bonacci
13, G. Cardarella
13, D. Tognetto
14, O. Vattovani
14, P. Vallon
14, F. Iannacone
14, L.
Fontana
15, S. Marchi
15, G. L. Manni
16, D. Jannetta
16, G. Roberti
3, L. Rossetti
17, E. Maggiolo
17,
O. Oneta
17, C. Sborgia
18, F. Cantatore
18, L. Mastropasqua
19, L. Agnifili
19, E. Campos
20, C.
Gizzi
20, G. Giannaccare
20, V. Pucci
21, M. Cassamali
21, C. Costagliola
22, C. Traverso
23, R. Scotto
23,
M. Musolino
23, L. Landi
23& A. Bagnis
235Università degli Studi “Magna Graecia”, Catanzaro, Italy. 6A.O.U. Senese Ospedale Santa Maria delle Scotte,
Università di Siena, Siena, Italy. 7Fondazione IRCCS Istituto di Ricovero e Cura a Carattere Scientifico Policlinico San
Matteo, Pavia, Italy. 8IRCCS Istituto di Ricovero e Cura a Carattere Scientifico Istituto Auxologico Italiano, Milano,
Italy. 9Università degli Studi di Torino, Torino, Italy. 10Fondazione IRCCS Istituto di Ricovero e Cura a Carattere
Scientifico Ca’ Granda Ospedale Maggiore Policlinico, Milano, Italy. 11A.O.U. di Parma, Parma, Italy. 12A.O.U. Cagliari
- Ospedale Civile San Giovanni di Dio, Cagliari, Italy. 13A.O.U. “Policlinico Vittorio Emanuele” P.O. Gaspare Rodolico,
Catania, Italy. 14A.O.U. “Ospedale Maggiore”, Trieste, Italy. 15A.O. Arcispedale Santa Maria Nuova-IRCCS, Reggio
Emilia, Italy. 16Universit Tor Vergata, Fondazione Policlinico Tor Vergata, Roma, Italy. 17A.O. S. Paolo, Milano, Italy. 18A.O.U. Policlinico, Bari, Italy. 19Ospedale Clinicizzato SS. Annunziata, Chieti, Italy. 20A.O.U. Policlinico S. Orsola
Malpighi, Bologna, Italy. 21A.O. di Desenzano del Garda, Desenzano del Garda, Brescia, Italy. 22Dipartimento SPES,