dOi: 10.1556/168.2015.16.2.2
1. Introduction
Many studies in the last two decades have focused on species diversity and composition of European land snail faunas, describing biodiversity patterns at local and regional scale. A few of them investigated snail assemblages of open habitats in the Aegean region (Cameron et al. 2000, 2003) while the majority focused on forest communities of central, northern and eastern Europe (Cameron and Pokryszko 2004, Pokryszko and Cameron 2005, Čejka et al. 2008, Cameron et al. 2006, 2010, 2011, Pokryszko et al. 2011). These faunas differ mainly in their origin: in peninsular Greece and the sur-rounding islands, snails survived Pleistocene glacial events in situ, whereas European malacofaunas of central and northern regions originated mainly from post-glacial recolonization from southern or extra-Mediterranean refugia (Hausdorf and Hennig 2003, Schmitt and Varga 2012). A different origin of recent snail associations in northern and southern Europe produced differing diversity patterns: much richer regional faunas and rapid distance decay in similarity in the Aegean region; regionally poor and rather uniform faunas in north-ern Europe (Cameron et al. 2000, Pokryszko and Cameron 2005, Cuttelod et al. 2011). Tuscany (central Italy) lies in
an approximately intermediate position between the Aegean and the other regions investigated in these studies (Figure 1a): it belongs to the Mediterranean ecoregion, but its reliefs (Apennine and other mountain ranges) have a more continen-tal climate (Selvi 1997) and host forest snail faunas which share several genera and species with central and northern Europe. Since there has been no research on the origin and biodiversity patterns of these assemblages, the study of spe-cies diversity and composition at local and regional scale is particularly challenging.
Italy hosts the largest number of continental molluscs in Europe after Greece, being a major hotspot for narrow-range endemics (Cuttelod et al. 2011), including forest-dwelling snails (Manganelli et al. 1995). Of the species of conserva-tion concern investigated for the compilaconserva-tion of the European Red List of Non-marine Molluscs, more than half have in-sufficiently known populations (Cuttelod et al. 2011); in Italy, information is also lacking on the status, distribution and threats of most rare and decreasing species (Giusti et al. 2005). Thus, preliminary knowledge on diversity patterns at different spatial scales can not only provide interesting infor-mation on environmental factors, but also a useful tool for conservation issues. Forests of the Mediterranean basin are
Local and regional scale biodiversity patterns of forest snail
assemblages in Tuscany (central Italy)
A. Benocci
1,3, G. Bacaro
2and G. Manganelli
11Department of Environment, Earth and Physical Sciences, University of Siena, Via P.A. Mattioli 4, 53100 Siena, Italy
2Department of Life Sciences, University of Trieste, Via L. Giorgieri 10, 34127 Trieste, Italy
3Corresponding author. Email: [email protected]; Tel: +39-0577-232901; Fax: +39-0577-232860
Keywords: CCA, Distance decay, Land snails, NMDS, Probability sampling, Tuscany.
Abstract: The land mollusc faunas of three forest areas of Tuscany (central Italy) were sampled to test the effect of geographical
and environmental factors on the structure of biodiversity. A total of 60 sites were surveyed in the years 2009-2011, recording species richness and abundance of snails in 400 m2 plots randomly selected in beech and oak woods. Sampling strategy relied on a combination of visual search and litter analysis. Environmental variables (topsoil pH and altitude) and UTM coordinates were recorded to detect relationships with species richness and number of individuals per plot. Abundance data were analyzed using non-metric multidimensional scaling and canonical correspondence analysis; faunal similarity within and between areas was computed by the Bray Curtis index and snail assemblages of the two forest types were compared. A total of 55 species were recorded, with low values of local richness and abundance per site compared to other forest sites in central and northern Europe. Total richness was similar in the three areas, but composition and local richness varied significantly between them. Geographical factors explained the highest percentage of variance, while habitat type, altitude and pH only accounted for a minor part. Internal similarity was greater than between-area similarity in two out of three areas. Beech forests had richer and more heterogeneous faunas, but lower levels of abundance than oak woods. The results are discussed in terms of historical biogeography and local environmental conditions, and compared with those from similar surveys across Europe.
Nomenclature for snails: Manganelli et al. (1995).
particularly sensitive to climate change effects, especially in-creased temperatures, modified rainfall patterns and soil prop-erties (Resco de Dios et al. 2007), factors that can negatively affect the local survival of snails (Pearce and Paustian 2013); thus, describing their biocoenoses can provide valuable in-sights in monitoring and prevention programs, especially in protected areas. Ecological factors that shape terrestrial snail assemblages have been investigated in central and northern Europe for decades, focusing on single or combinations of environmental parameters (Valovirta 1968, Evans 1972, Martin and Sommer 2004, Horsák 2006, Kappes et al. 2006, Sulikowska-Drozd and Horsák 2007, among others) but such studies are almost completely lacking for Italian land snails (Giusti et al. 2005), except for a paper on acid woodland in the southern Alps (Bishop 1980).
Here we report a survey of snail assemblages in three for-est areas of Tuscany (Figure 1b), carried out in two habitat types to test the effect of geographical and environmental factors on the structure of biodiversity: such questions have never been addressed before in Italy. Another innovative as-pect of this research concerns the selection of plots: in pre-vious studies focused on biodiversity patterns of European land snails, sampling sites were chosen ad hoc, whereas we opted for random selection. This and similar surveys to be carried out in other forest areas of Italy will help unveil the mechanisms underlying the present biodiversity patterns of land snails in temperate regions not subject to Pleistocene glaciations.
2. Materials and methods
Mollusc sampling was carried out in three forest areas of peninsular Italy: 1) Alpi Apuane-Garfagnana (AP) on the NW border of Tuscany; 2) Casentino-Alta Valle del Tevere (CA) on the NE border of Tuscany; 3) Monte Amiata (AM) in southern Tuscany (Figure 1b). These areas were chosen
because of their position along a latitudinal gradient in the Apennine chain and their extensive forest cover with relative-ly undisturbed mesophilous beech woods and more thermoph-ilous deciduous oak woods. The first area includes the south-eastern portion of the Alpi Apuane mountain range (high-est elevation 1859 m) and the nearby Serchio River valley, characterized by partly calcareous and partly acid substrates and very moist climate due to proximity to the Tyrrhenian Sea; the second area includes the south-eastern portion of the Casentino (central-northern Apennines) and minor reliefs bordering the upper Tiber valley (highest elevation 1414 m), characterized by mainly sandy, clayey and marly substrates and fresh, moist climate; Monte Amiata is an isolated massif (1738 m) originated by an extinct volcano, representing an “island” of oceanic climate in a sub-Mediterranean context: its upper portion consists of acid magmatic rocks, while the sedimentary basement consists mainly of clays and sands (Selvi 1997, Carmignani and Lazzarotto 2004, Provincia di Arezzo 2004, Garbari and Bedini 2006). In each area, forests are scattered from low hills to mountain tops in a range of environmental conditions (topsoil pH, slope, exposure, plant cover and so on).
Two habitat types were chosen: beech woods (composed of almost monospecific stands of European beech, Fagus sylvatica L.) and deciduous oak woods (mainly composed of Quercus pubescens Willd. and Quercus cerris L.). A map of forest vegetation of Tuscany (Arrigoni et al. 1999) was used as cartographic basis for the selection of plots. In each area, a sampling square of 20 km × 20 km was defined on the basis of suitable habitat: in each of the three 400 km2 squares, all available sites of beech and deciduous oak forests were iden-tified and counted. Twenty sites for each area/habitat combi-nation were then chosen randomly from all the available sites. The first ten were selected as sampling units, but some were discarded after a preliminary field survey, due to unsuitability of the habitat, human disturbance or accessibility problems; Figure 1. Position of the forests investigated in the present study (diamond) and in similar quantitative studies previously carried out in central and northern Europe (circles): only studies based on similar sampling methods were selected (for a list, see Table 5). The squares indicate the position of maquis and open habitat sites investigated for other studies (a). Position of the three study areas in Italy (b).
in such cases, they were replaced with some of the other ten, making a total of 60 sites.
Samplings were conducted from fall 2009 to spring 2011. At each site, a square plot of 400 m2 was selected in order to avoid transitions to different habitats and forest patches dis-turbed by tree logging, recent fires or heavy human exploita-tion. All the plots were searched by a single person for two hours, collecting larger snails in all available microhabitats. At the end of each visual search session, 15 litres of litter and upper soil were collected, bagged, dried and then sorted in the laboratory, sieving the material with meshes of decreasing size (Cameron and Pokryszko 2005). The coarsest fractions were searched with the naked eye, while the finest ones were analyzed under a Wild M5A light microscope to detect mi-crosnails and young specimens of all species. All live speci-mens and fresh shells were identified and counted. Slugs were not collected since the sampling method used is not suitable for complete inventories of this group of molluscs (Cameron and Pokryszko 2005).
The upper portion of soil was also used to obtain measures of pH. The general method was US EPA method 9045/D (US EPA 2004), adapted to our samples by minor changes. Each sample was sieved with a 1 mm mesh, and then a solution was obtained by centrifuging 10 g of sieved material and 10 ml of ultrapure water for 20 minutes at 3500 rpm. The filtered solu-tion was measured using a pH meter (Orion model 420A).
The significance of differences in mean richness and abundance per site between the three areas and the two habi-tat types were checked by the Kruskal – Wallis test (Sokal and Rohlf 1987). Matrices of presence/absence data were used to develop rarefaction curves to test sampling effi-ciency. Sample-based curves (Gotelli and Colwell 2001) were produced for the three areas and the two habitat types. Dissimilarity levels between pairs of plots were quantified us-ing the Bray Curtis Index (Bray and Curtis 1957). To limit the effect of dominant species, analyses were carried out with log-transformed abundance data (log(x+1)). The general pat-tern of these assemblages was investigated by non-metric multidimensional scaling (NMDS, McCune and Grace 2002), linking variations in composition with environmental factors (forest type, altitude, soil pH) and geography (UTM metric coordinates east and north). The significance of all the vari-ables was then tested by canonical correspondence analysis (CCA: ter Braak 1986): each variable was standardized and transformed into a new one (scaled to zero mean and unit variance) to avoid artificially different weights of variables with extremely heterogeneous measurement scales and rang-es of valurang-es. To highlight the effect of environmental factors in structuring biodiversity, regardless of the spatial position of plots, CCA was repeated as partial (conditioned) analysis
after removing the effect of geographical variables (Oksanen et al. 2013). Significance levels were tested by ANOVA (9999 permutations, Oksanen et al. 2013). Mean values of dissimilarity within and between areas were then measured and NMDS was used to obtain graphic visualization of dis-similarity between areas and habitat types through convex hull spider-web diagrams. All analyses were carried out with the software R 2.13.0 (R Development Core Team 2009) and “vegan” package (Oksanen et al. 2013). Analyses were also performed on presence/absence data, using the Jaccard index (Jaccard 1912): in most cases these results added no informa-tion and have been omitted; in other cases they are provided as supplementary online material, as are CCA diagrams. 3. Results
3.1. Species richness, abundance and sampling efficiency The sampling resulted in an inventory of 55 species and 14521 individuals of land snails (Table 1). Species richness per area was uniform and differences in mean richness per site were not significant (Kruskal – Wallis, χ2=2.48, p=0.286): CA had slightly higher mean species richness and AP had the lowest. AP had the highest (21 species) and lowest (three species) local richness. Differences in abundance were sta-tistically significant (Kruskal – Wallis, χ2=14.09, p=0.0009): AM had the highest and AP the lowest mean abundance. AP also hosted the site with the lowest local abundance (8 indi-viduals). 43.6% of the species were found in just one area (Appendix 1); the number of species represented by single individuals was quite high (9); the rarefaction curves for the three areas (Figure 2) did not level out but were much less steep than the random curve.
3.2. Faunal similarities
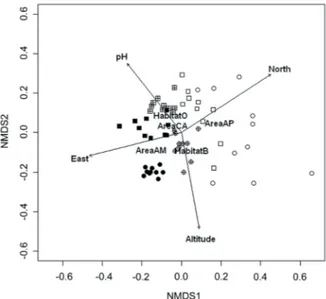
Plots from the same area tended to cluster together in the NMDS ordination (Figure 3), especially along the first axis: AP and AM at the two extremes, CA in an intermediate posi-tion. There was rather clear segregation between beech sites and oak sites in CA and especially in AM, but not in AP. The Shepard plot (Appendix 2) indicated a good correspondence between interpoint distances and the dissimilarities (narrow scatter of points).
Heterogeneity, obtained by comparing Bray Curtis dis-similarity index between pairs of plots, was lower within than between areas for CA and AM (Table 2). On the contrary, AP showed high within-area heterogeneity (lower than heteroge-neity with respect to AM but higher than heterogeheteroge-neity with respect to CA and total heterogeneity). Internal similarity of Table 1. Comparison of basic data (species richness, abundance and ranges) for the areas sampled in the present study.
AP CA AM Total
Species richness 34 33 35 55
Mean richness per site and range 10.3 (3-21) 11.8 (7-17) 11.3 (7-15) 11.1 (3-21)
Abundance 2898 5019 6604 14,521
the three areas was higher for abundance than for presence/ absence data (Appendix 2).
Convex hull spider-web diagrams representing similarity between plots in the same area (Appendix 2) showed strong differentiation between faunas of the three areas, with only marginal overlap between CA and the other two (overlapping between all areas was much more evident for
presence/ab-sence data); AP was again the most heterogeneous area both for abundance and presence/absence data.
3.3. Variance analysis
The overall pattern of CCA showed the highest percent-age of variance explained by geographical factors.
The amount of variance explained by the first two axes was not very high (12.59% and 9.57%, respectively); both axes were significant (p=0.005), as were all variables (p=0.01 for habitat and coordinates east and north; p=0.02 for alti-tude; p=0.05 for pH). Unlike the others, the variable pH was significant only for analyses of abundance, but not for pres-ence/absence data.
When spatial factors were excluded from the analysis, the role of two environmental factors became more evident: the first axis was related to altitude and habitat type, while the second axis was hard to interpret. The variable pH seemed to have relationships with both axes and a negative correlation with altitude. The amount of variance explained was lower for unconditioned (13.74%) than for conditioned (18.07%) variables: the first axis explained 11.70% of the variance, the second axis 3.18%. Both axes were significant (p=0.005 and p=0.015, respectively), as were all variables (p=0.04 for pH; p=0.01for habitat and altitude).
3.4. Habitat comparison
Beech forests hosted a greater number of species (47 out of a total of 55) and tended to be more heterogeneous, having wider ranges for number of species and individuals per plot (Table 3). Oak forests were slightly poorer and more uniform in species richness and slightly richer in number of individu-als. However, differences in species richness and abundance per site between the two habitat types were not significant (χ2=0.002, p=0.96 for species richness and χ2=0.32, p=0.57 for abundance).
Rarefaction curves for the two habitat types (Figure 4a) were also very different: for oak forests the curve tended to flatten, whereas for beech forests it was still not stable, suggesting that a certain number of species may have been missed. The three areas, however, had different levels of het-erogeneity per habitat: AP and CA (Figure 4b and 4c) had curves that followed the global scheme, while AM (Figure 4d) had very homogeneous beech forests (curve rapidly level-ling off) and more heterogeneous oak forests.
Table 2. Mean site-by-site values of the Bray Curtis index of dis-similarity within and between sampled areas.
AP CA AM
AP 0.6422 0.6208 0.6551
CA 0.4673 0.5346
AM 0.4768
Total dissimilarity (mean value of site-by-site comparison be-tween all areas): 0.6276
Figure 2. Rarefaction curves for the three study areas.
Figure 3. NMDS ordination of plots in the three study areas. Circles: beech woods; squares: oak woods; open symbols: AP; crossed symbols: CA; filled symbols: AM.
Table 3. Comparison of basic data (species richness, abundance and ranges) for the two habitat types investigated in the present study.
Beech forests Oak forests Total
Species richness 47 35 55
Mean richness
per site and range (3-21)11.2 (6-17)11.0 (3-21)11.1
Abundance 6548 7973 14,521
Mean abundance
Spider diagrams representing similarity between plots of the same habitat (Figure 5) showed higher heterogeneity for snail faunas of beech forests and a high degree of overlap between faunas of the two vegetation types (overlap was even higher for presence/absence data).
4. Discussion
4.1. Species richness, abundance and sampling efficiency The three areas showed low levels of species richness at regional and local scale, compared to similar forests of central,
northern and eastern Europe (Table 4). At regional scale, rich-ness is influenced by the size of the area (Rosenzweig 1995), which, in the present study, was smaller than those investi-gated in other surveys (Cameron et al. 2010, 2011, Pokryszko et al. 2011). Lower regional richness has indeed been found in areas smaller than Tuscany (Cameron and Pokryszko 2004, Cameron et al. 2006, Čejka et al. 2008), whereas for local richness, no other area had such low numbers of species per site, except Danubian floodplain forests, which are regularly flooded (Čejka et al. 2008). There are several reasons that may account for such low species numbers. First, the random-ized sampling used may partly account for failure to find rare Table 4. Comparison of results (mean and total species richness and abundance of forest snails) found by previous authors in other regions of Europe and by us (only studies that used the same plot size and comparable sampling methods are included).
Source Area No. of
plots Plot size Visual search Litter sampling Species richness Mean richness per site and range
Abundance Mean abundance per site and
range Present study Tuscany
(cen-tral Italy) 60 400 m
2 1 person for 2 h 15 l of litter 57 11.1
(3-21) 14,521 (8-798)242.0 Cameron and
Pokryszko (2004) Bialowieza (Poland) 17 400 m
2 2 people for 1 h 10 l of litter 45 26.1
(13-32) 4693 (126-725)276.1 Cameron et al.
(2006) Southern England 30 400 m
2 2 people for 1 h 10 l of litter 43 27.6
(22-32) 19,883 (378-1029)662.8 Cameron et al.
(2010) Poland 161 400 m
2 2 people for 1 h 10-20 l of litter 111 27.2
(13-43) 86,191 (126-2257)535.3 Cameron et al.
(2011) Transylvania (Romania) 43 400 m
2 4 h (no of people
not specified) 20 l of litter 83 (19-40)26.9 17,715 (157-765)412.0 Pokryszko et al.
(2011) Georgian Transcaucasia 30 400 m
2 5 person hours 20 l of litter 90 15.9
(8-21) 6993 (60-530)233.1 Cejka et al. (2008) Slovakia 42 400 m2 1 person for 1 h 0.25 m2 of litter
twigs and soil 41 (4-26)11.0 10,970 261.2
Figure 4. Rarefaction curves for the two habitat types. Total values for the three areas (a) and for single areas: AP (b), CA (c) and AM (d).
species in certain sites or even in whole areas. In all the other studies, sample sites were selected ad hoc, choosing rich for-est patches that presumably hosted a large array of species and great numbers of specimens. On the contrary, our plots also included very poor sites (e.g., beech forests on very acid substrates or steep slopes). This may also have affected local abundance: our forests are also poorer in mean numbers of specimens per site than other areas, the only exception being Georgian forests, where snail fauna is reportedly impover-ished by management and unfavourable climatic and envi-ronmental conditions (Pokryszko et al. 2011). Nevertheless, rarefaction curves for the three areas did not rise steeply with increased sample size, suggesting that the number of missed species is not very high: this is confirmed by the fact that most species known to occur in the three areas, on the basis of previous knowledge and unpublished field research, were recorded during this survey. Indeed, the high number of sin-gletons is mainly due to detection of species which are not strictly associated to forests, present in the plots by chance (e.g., calciphile rock-dwelling snails found in calcareous out-crops within forests, or meadow species surviving in sites that were once logged).Cameron and Pokryszko (2005) state that randomized sampling is not suitable for land snails, because these animals tend to have clustered distributions, and areas or microhabitats with the highest levels of specific diversity and abundance can easily be missed by this sampling proce-dure, exaggerating differences between sites. These authors therefore recommend preferential sampling to selectively in-crease the probability of encountering rare species. No one has ever compared the efficiency of randomized and prefer-ential sampling for land snails; on the contrary, botanists have long discussed the topic for plant censuses. After comparing phytosociological datasets obtained by different methods in the same areas, most recent authors (e.g., Diekmann et al. 2007) agree that preferential sampling is hardly suitable for inferential statistical tests, since it is not based on
representa-tive samples. Moreover, these authors suggest to use results based on probabilistic sampling to extend to wider areas spe-cies richness estimates since, in this way, known confidence intervals can be easily and correctly calculated. This is why we adopted a sampling strategy based on random selection of plots, even if we were aware of its limits, especially for diverse and heterogeneous regions.
Another factor explaining the low values of regional and local richness may be the restricted pool of forest snail species in peninsular Italy, possibly due to historical processes. There have been no detailed studies on the origin of Italian mala-cocoenoses, but it is known that faunas with W-Palaearctic and European affinities reached Italy from northern Europe between the Pliocene and the end of the Pleistocene (Ruffo and Stoch 2006). Some snails with northern affinities may never have reached the Apennine area because of the climatic barrier represented by the Po Plain: drier and warmer con-ditions south of this limit would have prevented markedly hygrophilous and mesophilous species from spreading to the Apennines (Sacchi 1963). Furthermore, a marked increase in temperatures along the Apennine chain after the last glacial age caused local contraction of the ranges of cold climate fau-nas, which remained confined to the highest mountains: forest snails with northern affinities once present in peninsular Italy may have disappeared at this time, withdrawing to cooler and moister areas north of the Po Plain (Ruffo and Stoch 2006).
Finally, previous studies also investigated lowland or floodplain forests (Cameron and Pokryszko 2004, Cameron et al. 2006, Čejka et al. 2008), some of which host several wetland species, absent or rare in the hilly or montane forests studied by us.
4.2. Faunal similarities
Despite very similar values of species richness in the three areas, species composition varied greatly and inter-area similarity was quite low. In Poland, Cameron et al. (2010) found much greater heterogeneity in highland than in lowland forests. Thus we might expect altitude to be an important fac-tor in the variation of species composition in our forests, since they are all located in montane areas. Similarity was higher within than between areas for CA and AM, revealing clear geographical differentiation of the two areas. On the contrary, AP displayed very high internal differentiation, indicating an important role of local environmental factors. AP is indeed a very heterogeneous area, with extremely uneven morphology and lithology and sharp climatic differentiation between in-ternal and coastal mountainsides (Garbari and Bedini 2006). It also contains very poor plots on non-eutrophic forests, which usually have more variable compositions and high heterogeneity levels (Pokryszko and Cameron 2005). At the other extreme, AM has very homogeneous fauna, probably because it is an isolated massif with continuous belts of de-ciduous woods from the base to the summit of the volcanic cone (Selvi 1997).
Internal similarity of the three areas was higher for abun-dance than for presence/absence: this seems to suggest that Figure 5. Spider diagrams representing faunal similarities
be-tween the two habitat types. Open symbols: AP; crossed sym-bols: CA; filled symsym-bols: AM. O: oak forest, B: beech forest.
geographical position not only affects the distribution, but also the differential success of species common to two or more regions. Indeed, spider diagrams showed much more overlap between different areas for presence/absence data than for abundances.
Heterogeneity between areas increased with relative dis-tance: the highest was found between AP and AM, the most distant from each other. The spider diagrams did not show any overlap between the two areas, whereas both partly over-lapped with CA, intermediate between the two. Indeed, areas closer to each other shared more species than areas far apart (Appendix 1). Variations in species composition may be partly explained by biogeographical factors, such as distance from source fauna. For instance, the geographical position of AP not far from the Alpine chain facilitated the spread of north-ern species, which here encounter the southnorth-ern limit of their range (e.g., Renea elegantissima, Platyla similis, Cochlodina fimbriata; Manganelli et al. 1995) and are therefore absent from CA and AM. Not surprisingly, AP had the highest per-centage of unique species: 38% compared to 12% for CA and 20% for AM. Other species, such as Vitrinobrachium bac-cettii and Platyla stussineri, occur in northern Tuscany (AP and CA) but are absent from southern Tuscany (AM). A loss of similarity with increasing distance between areas is also probably due to geographical barriers which, in the study ar-eas, are represented by major valleys, and at least for AM, surrounding lowland areas with sub-Mediterranean climate (Selvi 1997). For other soil invertebrates, the Arno Valley has prevented many Apennine taxa from penetrating south of the river (Taiti and Ferrara 1989), and the same could apply to the Serchio, which almost isolates AP.
4.3. Variance analysis
Most variance was explained by the factor “area”. Significantly, the relative position of plots along the axes of the CCA reflected real geography: AP and AM at two extremes and CA in an intermediate position. The explana-tory role of north coordinates, and to a lesser extent east co-ordinates, is partly linked to a sharp “Apennine” gradient in Italian faunas: species with northern affinities generally show a gradual decrease from N to S, following the direction of the Apennine chain, which is orientated NW-SE (Ruffo and Stoch 2006). Vegetation type was also important, as shown by the clear segregation between beech and oak sites. However, the global contribution of measured environmental factors (alti-tude, vegetation type and pH) was limited, even excluding the effect of geographical variables: other factors that contribute to shaping diversity patterns were apparently not traced by us. For example, Evans (1972) suggested that the gross struc-ture of the environment (habitat type) is not very important for small litter species, while other variables, such as slope, herbaceous plant cover, shade and certain soil properties, may account for their presence in a particular site. Such species ac-tually seem to show no close association with forest habitats, sometimes preferring tall grasslands that provide a minimum of shade and moist litter and avoiding forests characterized by sparse tree cover, no grass and steep slopes (where litter
is scarce and soil retains little moisture). This could explain, for example, the paucity of litter snails in several plots: the poorest sites in AP were in fact those characterized by beech woods on steep slopes. Martin and Sommer (2004), Müller et al. (2005) and Kappes et al. (2006) confirmed the importance of soil moisture, herbaceous cover and slope aspect, respec-tively, in shaping forest snail assemblages.
Notably, pH was significant for abundance data but not for presence/absence. pH may significantly affect abundance but not occurrence of species because of the differential rate of shell erosion in acid and non-acid soils: since shells are eroded more rapidly at low pH (Evans 1972, Juřičková et al. 2008), plots on very acid substrates conserve fewer fresh empty shells, which in our case were counted. Kappes et al. (2006) also found that soil pH was positively correlated with snail abundance but not with species richness. On the con-trary, Valovirta (1968) and Juřičková et al. (2008) recorded lower species numbers in acid plots. Calcium-rich sites (that usually have high pH) are in general richer both in number of individuals and species (Pokryszko and Cameron 2005, Martin and Sommer 2004, Horsák 2006, Sulikowska-Drozd and Horsák 2007, Juřičková et al. 2008), thus pH would also be expected to influence species richness in limestone sites. In our case, however, even plots on calcareous substrates had slightly acid pH (never higher than 6.71) and this parameter is probably not closely correlated with the amount of calcium. Indeed, Juřičková et al. (2008) only found a positive correla-tion between topsoil pH and calcium content in one out of two sets of 20 quadrats in the Czech Republic and concluded that when calcium is not abundant, pH is an inadequate es-timator of its availability. They hypothesized that in many cases soil moisture or other factors could have a greater role than chemical properties of soil and litter in determining lo-cal species richness and abundance of forest snails. Martin and Sommer (2004) actually reported a major influence of soil moisture on snail assemblages in German forests, while Müller et al. (2005), Kappes et al. (2006) and Sólymos et al. (2009) highlighted the importance of dead wood and/or litter thickness as factors increasing species richness and densities of snails in central European forests. The parameter altitude does not always show a clear trend or uniform patterns for land snails: some studies revealed peaks of species richness at intermediate altitudes, while others found a steady decrease with increasing elevation (Sulikowska-Drozd and Horsák 2007).
4.4. Habitat comparison
The vegetation of deciduous oak woods analyzed was-more diverse than the beech woods (Mondino and Bernetti 1998); moreover, beech woods are known to host rather uni-form malacocoenoses throughout the Italian peninsula (Giusti et al. 1985, Minelli 2006). Notwithstanding this, our study re-vealed more heterogeneous snail faunas in beech woods than oak woods in two out of three areas (CA and AP), and spider diagrams representing levels of similarity between plots of the same habitat confirmed this trend. On the average, beech woods were regionally and locally richer in species than oak
woods, although they showed lower mean abundances. This could be due to many species that occurred in low numbers with scattered distributions. During our survey many of these rare taxa were only found in beech woods, and this could be due to historical rather than environmental factors. Montane beech woods have generally been subject to less human dis-turbance than submontane oak or mixed forests, as a conse-quence of their limited accessibility. Higher percentages of undisturbed habitat may have preserved certain rare snails in beech woods, while in other forest types at lower altitudes these snails have disappeared due to human interference. Although many species can tolerate a moderate amount of disturbance, the richest European faunas at local level are nor-mally reported from relatively unexploited montane forests (Cameron and Pokryszko 2004). Furthermore, various snail species which are normally found in lowland and submontane woods can in many cases spread to beech woods in search of favourable temperature and humidity conditions and join a pool of more mesophilous species apparently linked to cool moist beech woods, thus increasing the richness of this for-est type (Giusti et al. 1985). It is noteworthy that almost all the species found in oak woods were also recorded in beech woods, and most of those that occur only in the former are not typical forest snails.
With regard to AM, the pattern was different from those of the other two areas, with beech woods poorer and more uniform in composition than oak woods. This is probably due to the geological nature of this area. Beech woods in AM are restricted to the upper portion of the volcanic cone. Their isolation on an unfavourable acid substrate probably caused these communities to become rather uniform and impov-erished versions of the typical assemblages found in other beech woods of Tuscany.
Acknowledgements. We thank Dr. R. Cameron (Sheffield,
UK) and T. Caruso (Belfast, UK) for their precious help in defining a sampling strategy. We also thank Prof. F. Giusti (Siena, Italy) for discussion and criticism. The topics dis-cussed in this paper are part of the contents of a PhD thesis (A. B.) defended at Siena University on March 14th 2013. 6. References
Arrigoni, P.V., M. Raffaelli, M. Rizzotto, P.L. Di Tommaso, U. Miniati, B. Foggi, F. Selvi, L. Lombardi, D. Viciani, E. Menicagli, R. Benesperi, S. Benucci, G. Ferretti and P.E. Tomei. 1999. Regione Toscana. Carta della vegetazione forestale. Regione Toscana, serie Boschi e Macchie di Toscana. Selca, Florence.
Bishop, M.J. 1980. The Mollusca of acid woodland in the Italian province of Novara. J. Conchol. 30: 181-188.
Bray, J. and J. Curtis. 1957. An ordination of the upland forest com-munities of Southern Wisconsin. Ecol. Monogr. 27: 325-349. Cameron, R.A.D., M. Mylonas, K. Triantis, A. Parmakelis and K.
Vardinoyannis. 2003. Land-snail diversity in a square kilometre of Cretan maquis: modest species richness, high density and lo-cal homogeneity. J. Mollusc. Stud. 69: 93-99.
Cameron, R.A.D., M. Mylonas and K. Vardinoyannis. 2000. Local and regional diversity in some Aegean land snail faunas. J. Mollusc. Stud. 66: 131-142.
Cameron, R.A.D. and B.M. Pokryszko. 2004. Land mollusc faunas of Bialowieza Forest (Poland), and the character and survival of forest faunas in the North European plain. J. Mollusc. Stud. 70: 149-164.
Cameron, R.A.D. and B.M. Pokryszko. 2005. Estimating the species richness and composition of land mollusc communities: prob-lems, consequences and practical advice. J. Conchol. 38 : 529-547.
Cameron, R.A.D., B.M.Pokryszko and D.C. Horsák. 2010. Land snail faunas in Polish forests: patterns of richness and composi-tion in a post-glacial landscape. Malacologia 53: 77-135. Cameron, R.A.D., B.M. Pokryszko, D.C. Horsák, I. Sirbu and V.
Gheoca. 2011. Forest snail faunas from Transylvania (Romania) and their relationship to the faunas of Central and Northern Europe. Biol. J. Linnean Soc. 104: 471-479.
Cameron, R.A.D., B.M. Pokryszko and D.C. Long. 2006. Snail fau-nas in Southern English calcareous woodlands: rich and uniform, but geographically differentiated. J. Conchol. 39: 13-39. Carmignani L. and A. Lazzarotto. 2004. Carta geologica della
Toscana. Università di Siena, Dipartimento di Scienze della Terra, Siena. Regione Toscana, Direzione regionale politiche ter-ritoriali e ambientali, Servizio geologico, Florence.
Čejka, T., M. Horsák and D. Némethová. 2008. The composition and richness of Danubian floodplain forest land snail faunas in re-lation to forest type and flood frequency. J. Mollusc. Stud. 74: 37-45.
Cuttelod, A., M. Seddon and E. Neubert. 2011. European Red List of Non-marine Molluscs. Publications Office of the European Union, Luxembourg. https://portals.iucn.org/library/efiles/ documents/RL-4-014.pdf
Diekmann, M., A. Kühne and M. Isermann. 2007. Random vs. non-random sampling: effects on patterns of species abundance, spe-cies richness and vegetation-environment relationships. Folia Geobot. 42: 179-190.
Evans, J.G. 1972. Land Snails in Archaeology. Seminar Press, London & New York.
Garbari, F. and G. Bedini. 2006. The flora of the Apuan Alps (Tuscany, Italy): survey of biosystematics investigations. Willdenowia 36: 149-155.
Giusti, F., L. Castagnolo and G. Manganelli. 1985. La fauna malaco-logica delle faggete italiane: brevi cenni di ecologia, elenco delle specie e chiavi per il riconoscimento dei generi e delle entità più comuni. Boll. Malacol. 21(5-6): 69-144.
Giusti, F., G. Manganelli and S. Cianfanelli. 2005. Molluschi. In: C. Blasi, L. Boitani, S. La Posta, F. Manes and M. Marchetti (eds.), Stato della biodiversità in Italia. Contributo alla strategia nazi-onale per la biodiversità. Palombi, Rome. pp. 246-248. Gotelli, N.J. and R.K. Colwell. 2001. Quantifying biodiversity:
pro-cedures and pitfalls in the measurement and comparison of spe-cies richness. Ecol. Lett. 4: 379-391.
Hausdorf, B. and C. Hennig. 2003. Nestedness of north-west European land snail ranges as a consequence of differential im-migration from Pleistocene glacial refuges. Oecologia 135: 102-109.
Horsák, M. 2006. Mollusc community patterns and species response curves along a mineral richness gradient: a case study in fens. J. Biogeography 33: 98-107.
Jaccard, P. 1912. The distribution of the flora in the alpine zone. New Phytol. 11: 37-50.
Juřičková, L., M. Horsák, R. Cameron, K. Hylander, A. Míkovcová, J.Č. Hlavác and J. Rohovec. 2008. Land snail distribution
pat-terns within a site: the role of different calcium sources. Eur. J. Soil Biol. 44: 172-179.
Kappes, H., W. Topp, P. Zach and J. Kulfan. 2006. Coarse woody debris, soil properties and snails (Mollusca: Gastropoda) in European primeval forests of different environmental condi-tions. Eur. J. Soil Biol .42: 169-146.
Manganelli, G., M. Bodon, L. Favilli and F. Giusti. 1995. Gastropoda Pulmonata. In: A. Minelli, S. Ruffo and S. La Posta (eds.), Checklist delle specie della fauna d’Italia, 16. Edizioni Calderini, Bologna, pp 1-60.
Martin, K. and M. Sommer. 2004. Relationships between land snail assemblage patterns and soil properties in temperate-humid for-est ecosystems. J. Biogeogr. 31: 531-545.
McCune, B. and J.B. Grace. 2002. Analysis of Ecological Com-munities. MjM Software Design, Gleneden Beach.
Minelli, A. (ed.). 2006. Beech forests of the Apennines: new popu-lations and relicts of a continental forest. Quaderni Habitat 15. Ministero dell’Ambiente e della Tutela del Territorio – Museo Friulano di Storia Naturale, Rome and Udine.
Mondino, G.P. and G. Bernetti (eds.). 1998. I tipi forestali. Boschi e macchie di Toscana. Regione Toscana, Florence.
Müller, J., C. Strätz and T. Hothorn. 2005. Habitat factors for land snails in European beech forests with a special focus on coarse woody debris. Eur. J. Forest Res. 124: 233-242.
Oksanen, J., F.G. Blanchet, R. Kindt, P. Legendre, P.R. Minchin, R.B. O’Hara, G.L. Simpson, P. Solymos, M.H.H. Stevens and H. Wagner. 2013. vegan: Community Ecology Package. R pack-age version 2.0-10 http://CRAN.R-project.org/packpack-age=vegan. Accessed 20 June 2014.
Pearce T.A. and Paustian M.E. 2013. Are temperate land snails sus-ceptible to climate change through reduced altitudinal ranges? A Pennsylvania example. Am. Malacol. Bull. 31: 213-224. Pokryszko, B.M. and R.A.D. Cameron. 2005. Geographical variation
in the composition and richness of forest snail faunas in northern Europe. Rec. West. Aust. Mus. Supplement 68: 115-132.
Pokryszko, B.M., R.A.D. Cameron, L. Mumladze and D. Tarkhnishvili. 2011. Forest snail faunas from Georgian Transcaucasia: patterns of diversity in a Pleistocene refugium. Biol. J. Linnean Soc. 102: 239-250.
Provincia di Arezzo. 2004. Aree protette della Provincia di Arezzo. Guida naturalistica con notizie storiche e percorsi di visita. Le Balze, Montepulciano (SI).
R Development Core Team. 2009. R: A language and environ-ment for statistical computing. R Foundation for Statistical Computing, Vienna.
Resco de Dios, V., C. Fischer and C. Colinas. 2007. Climate change effects on Mediterranean forests and preventive measures. New Forest 33: 29-40.
Rosenzweig, M.L. 1995. Species Diversity in Space and Time. Cambridge University Press, Cambridge.
Ruffo, S. and F. Stoch (eds). 2006. Checklist and distribution of the Italian fauna. Memorie del Museo Civico di Storia Naturale di Verona, 2a serie, Sezione Scienze della Vita 17, with cd-rom.
Sacchi, C.F. 1963. Origini ed evoluzione della malacofauna appen-ninica meridionale. Annuario dell’Istituto e Museo di Zoologia della Università di Napoli 15(7): 1-86.
Schmitt, T. and Z. Varga. 2012. Extra-Mediterranean refugia: The rule and not the exception? Frontiers in Zoology 9: 22. Selvi, F. 1997. Rare plants on Mount Amiata, Italy: vulnerability to
extinction on an ecological “island”. Biol. Cons. 81: 257-266. Sokal, R.R. and F.J. Rohlf. 1987. Introduction to Biostatistics.
Freeman & Co., New York.
Sólymos, P., R. Farkas, Z. Kemencei, B. Páll-Gergely, F. Vilisics, A. Nagy, M. Kisfali and E. Hornung. 2009. Micro-habitat scale sur-vey of land snails in dolines of the Alsó-hegy, Aggtelek National Park, Hungary. Mollusca 27 : 167-171.
Sulikowska-Drozd, A. and M. Horsák. 2007. Woodland mollusc com-munities along environmental gradients in the East Carpathians. Biologia Bratislava 62 : 201-209.
Taiti S. and Ferrara F. 1989. Biogeography and ecology of terrestrial isopods from Tuscany. Monit. Zool. Ital. (N.S.) Monogr. 4: 75-101.
ter Braak, C.J.F. 1986. Canonical correspondence analysis: a new eigenvector technique for multivariate direct gradient analysis. Ecology 67: 1167-1179.
US EPA. 2004. SW 846 Ch. 6 Reference methodology: method 9045/D. Soil and waste pH, Washington DC.
Valovirta, I. 1968. Land molluscs in relation to acidity on hyperite hills in Central Finland. Ann. Zool. Fenn. 5: 245-253.
Received March 28, 2014 Revised June 22, November 17, 2014
Accepted March 25, 2015 Electronic supplements
Appendix 1. Occurrence and relative frequency of snail
spe-cies in the three study areas.
Appendix 2. Shepard plot for NMDS ordination, internal
similarity between areas based on Jaccard index, convex hull spider-web diagrams for similarity between areas and habi-tats based on presence/absence data and CCA diagrams for abundance data.