Materials 2020, 13, 1100; doi:10.3390/ma13051100 www.mdpi.com/journal/materials
Article
Self‐assembly Processes in Hydrated
Montmorillonite by FTIR Investigations
Maria Teresa Caccamo
1, Giuseppe Mavilia
1, Letterio Mavilia
2, Domenico Lombardo
3and
Salvatore Magazù
1,*
1 Dipartimento di Scienze Matematiche e Informatiche, Scienze Fisiche e Scienze della Terra, Università di Messina, Viale Ferdinando Stagno D’Alcontres n 31, S. Agata, 98166 Messina, Italy; [email protected] (M.T.C.); [email protected] (G.M.) 2 Dipartimento di Patrimonio, Architettura e Urbanistica; Università Mediterranea di Reggio Calabria, (PAU), Via Melissari, I‐89124 Reggio Calabria, Italy; [email protected] 3 CNR‐IPCF, Viale Ferdinando Stagno d’Alcontres 37, 98158 Messina, Italy; [email protected] * Correspondence: [email protected] Received: 4 February 2020; Accepted: 27 February 2020; Published: 2 March 2020Abstract: Experimental findings obtained by FTIR and Raman spectroscopies on montmorillonite‐
water mixtures at three concentration values are presented. To get some insight into the hydrogen
bond network of water within the montmorillonite network, FTIR and Raman spectra have been
collected as a function of time and then analyzed following two complementary approaches: An
analysis of the intramolecular OH stretching mode in the spectral range of 2700–3900 cm
−1in terms
of two Gaussian components, and an analysis of the same OH stretching mode by wavelet cross‐
correlation. The FTIR and Raman investigations have been carried as a function of time for a
montmorillonite‐water weight composition (wt%) of 20%–80%, 25%–75%, and 35%–65%, until the
dehydrated state where the samples appear as a homogeneous rigid layer of clay. In particular, for
both the FTIR and Raman spectra, the decomposition of the OH stretching band into a “closed” and
an “open” contribution and the spectral wavelet analysis allow us to extract quantitative
information on the time behavior of the system water content. It emerges that, the total water
contribution inside the montmorillonite structure decreases as a function of time. However, the
relative weight of the ordered water contribution diminishes more rapidly while the relative weight
of the disordered water contribution increases, indicating that a residual water content,
characterized by a highly structural disorder, rests entrapped in the montmorillonite layer structure
for a longer time. From the present study, it can be inferred that the montmorillonite dehydration
process promotes the layer self‐assembly.
Keywords: self‐assembly processes; montmorillonite; IR spectroscopy; OH stretching band; wavelet
Analysis
1. Introduction
Among various silico‐aluminate precursors used for the preparation of geopolymers, we can
certainly mention clays and in particular those characterized by cation exchange, such as
montmorillonite. The most used cation exchange clays are those belonging to the class of layered
phyllosilicates. Phyllosilicates are clay minerals, readily available, characterized by a lamellar
structure consisting of two‐dimensional layers (i.e., lamellae) with spaces between the various
lamellae containing cations and water molecules. Each lamella is formed by the union of individual
layers of silica with tetrahedral coordination, joined to layers of alumina or magnesia with octahedral
coordination [1–4].
There are two types of phyllosilicates: Those having a 1:1 ratio, such as kaolin, in which each
lamella is made up by only two layers (one octahedral and one tetrahedral) and the phyllosilicates
with a 2:1 ratio, such as montmorillonite, in which a single lamella is formed by an octahedral layer
interposed between two tetrahedral layers and, moreover, there is the presence of weak Van der
Waals bonds between the various lamellae. Figure 1 shows, in a schematic way, the layered structure
of montmorillonite.
Figure 1. Layered structure of montmorillonite with a 2:1 ratio, in which a single lamella is formed by two silica tetrahedral sheets with an interposed alumina octahedral sheet.
The montmorillonite chemical formula is (Si
7.8Al
0.2)
IV(Al
3.4Mg
0.6)
VIO
20(OH)
4; its composition,
without considering the presence of the material between the various lamellae, is: SiO
2(66.7%), Al
2O
3(28.3%), H
2O (5%), which allows us to explain how in the montmorillonite there may be isomorphic
substitutions of the Si
4+cations with Al
3+within the tetrahedral units, and of the Al
3+cation with Mg
2+in the octahedral units. In this way, the montmorillonite net charge for each layer of is: [7.8 (+4)] + [0.2
(+3)] + [3.4 (+3)] + [0.6 (+2)] + [20 (−2)] + [4 (−1)] = −0.8 charge/unit cell [5–7]. Thus, the lamellae
constituted by these layers are characterized by an excess negative charge, which is balanced by the
elements in the interlamellar spaces such as alkaline or alkaline‐earth cations, solvated, in turn, by
water molecules. Montmorillonite is a material highly available in nature: It constitutes, in fact, the
main component of bentonite, representing 50% of it.
In addition, montmorillonite crystallizes in lamellae with a thickness of nanometric sizes,
characterized by a surface length that can reach the micrometric sizes, forming aggregates composed
of about 25 overlapping lamellae. This feature gives montmorillonite a very high surface/volume
ratio (250–800 m
2/g versus 10 m
2/g of talc). The crystallographic structure of montmorillonite (Figure
2) is, as also partially anticipated and represented previously in Figure 1, a 2:1 layered structure of
silica and alumina: A single octahedral layer of alumina (Al
2O
3) is therefore observed between two
tetrahedral layers of silica (SiO
4), and so the oxygen ions of the octahedral layer also belong to the
tetrahedral layer [8,9].
The number of terminal oxygenals of the silicate layers is often not sufficient to complete the
octahedral coordination, and therefore the remaining vertices are occupied by additional OH
‐ions.
Lamellar silicate is characterized by having only two thirds of the available octahedral sites occupied:
The cations that occupy them are Al
3+. They are isomorphically replaced by Mg
2+and Fe
2+cations and,
in addition, there are also Al
3+cations in place of the tetrahedral silicon cations. The excess of negative
charge that is created is balanced by various mono or bivalent cations (Ca
2+, Mg
2+, Na
+, K
+) solvated
and which, being unable to be inserted inside the crystal, remain located on the edges of the same,
occupying the interlayer region [10–12].
Figure 2. Crystallographic structure of montmorillonite, which is composed by a central alumina octahedral sheet within two silica tetrahedral sheets, forming a common layer [5].
Cations and water are not part of the crystalline structure and can be easily replaced by other
cations: The lamellae layers are bonded each other by weak interaction forces (Van der Waals bonds)
and therefore can be easily separated from each other [13,14].
As far as functional properties are concerned, montmorillonites are characterized by significant
Cation Exchange Properties (C.E.C.): The values of C.E.C. for montmorillonite vary between 80 and
120 meq/100 g depending on the degree of isomorphic substitutions occurred in the lattice (Table 1).
Table 1. Specific surface and Cation Exchange Properties (C.E.C.) values of montmorillonite. Mineral Specific Surface (m2g−1) C.E.C. (meq/100 g)kaolinite 10 ÷ 20 3 ÷ 10
illite 80 ÷ 100 20 ÷ 30
montmorillonite 250 ÷ 800 80 ÷ 120
chlorite 80 20 ÷ 30
Another important property of montmorillonite, in addition to the cation exchange capacity
evaluated by C.E.C., is that related to the expansion capacity of this molecular structure linked to the
presence of H
2O molecules between one layer and another. This expansion also occurs in the presence
of polar liquids such as ethylene glycol and glycerin [15,16].
Furthermore, the distance between the reticular planes of montmorillonite depends on the
degree of hydration of the mineral: By increasing the number of water layers, the crystalline lattice
expands (Figure 3); by complete dehydration, however, it loses its ability to expand. In fact, in the
presence of water, H
2O molecules dispose themselves within the montmorillonite interlayer space,
generating a space increase between the layers. In aqueous solutions, montmorillonite aggregates can
disassociate, giving rise to montmorillonite nanolayers [17,18].
Such disassociation depends on the montmorillonite concentration, and on the nature of the
cations in the interlayer space [19]. As a rule, the higher the cationic charge is, the larger the particle
size are.
In the case of Na
+‐Montmorillonite, when water is added to powder, Na
+ions hydrate; in such a
case, a huge number of H
2O molecules penetrate within the interlayer space; due to such a
penetration, the montmorillonite crystalline structure expands along a direction which is
perpendicular to the layers.
In the case of Ca
2+‐Montmorillonite, instead, when water is added to powder, the Ca
2+ions
remain within the space between the layers and on the hydroxyl sites located within the layers. In
order to increase the montmorillonite exfoliation process in solution, ultrasonication is often used
[20–23].
Another peculiar characteristic of montmorillonite is thixotropy, that is, that peculiar
characteristic of a few clays to give rise, when they are dispersed in a certain aqueous solution with
appropriate concentration to colloidal suspensions, which remain in the liquid state (sol) if stirred;
however, when at rest, they take on a certain consistency and viscosity (gel).
Figure 3. Swelling of montmorillonite in water [19].
Other important physical properties of montmorillonite are reported in Table 2 [4].
Table 2. Physical properties of montmorillonite. Property Name Specific Surface (m2/g) Density 2–3 g/cm3 (measured) Molecular weight 36,031 g/mol Crystal system Monoclinic Hardness 1–2 on Mohs scale Transparency Translucent Color White, green, yellow, pink, redIn addition, among other functional properties of montmorillonite, one can mention electrical
conductivity (mS/m), whose value, being this clay characterized by an intrinsic porosity, depends on
the conductivity of the fluid that passes through these pores [24–26]. Furthermore, as far as thermal
properties are concerned, montmorillonite is a good thermal insulator. As far as the water absorption
capacity, this feature is very important for these natural clays. In fact, clays can absorb or desorb
water as a function of changes in the moisture content: As above reported, when H
2O molecules are
absorbed, they fill the space between the various layers [27]. Montmorillonite has excellent water
absorption properties; however, the interaction between the water molecules and montmorillonite
can cause swelling. The absorption of water molecules and the swelling of montmorillonite leads to
the formation of hydrated states and can give rose to hysteresis phenomena. Ionic migration towards
the central plane between the layers, determines the phenomenon of montmorillonite swelling [28].
The montmorillonite swelling and hydration processes play a key role for a wide variety of
engineering applications. Moreover, the anisotropy of a wide class of clay minerals is reflected in a
wide variable range of mechanical properties. The structure of hydrated Na‐montmorillonite is
shown in Figure 3. Molecular Dynamic (MD) simulations performed by Zheng and A. Zaoui [29]
showed that the elastic constants of dried and hydrated Na‐MNT are different. The anisotropy of Na‐
montmorillonite can generate great differences in the values of elastic constants, bulk, and shear
modulus, and Young’s modulus. These mechanical quantities decrease with increasing hydration.
Montmorillonite is used as both silico‐aluminate precursor to be subjected to alkaline activation
for the production of geopolymers and as nanofiller for the production of nanocomposite materials
used in the food and biomedical fields with high antibacterial properties. In addition, they can be
used as adsorbent materials and as catalysts in green chemistry. Recent researches employ the self‐
assembling methods between supramolecular objects to fabricate innovative well‐defined
nanomaterials that link soft matter approaches to hard matter components. For example, the soft‐
templated mesoporous nanomaterials allow to construct nanomaterials with controllable structure
and properties, and require the employment of techniques to simultaneously detect the structure–
structure re‐organization and dynamics at the nanoscale [30–34]. In the present work, we have not
considered the acid activation process of montmorillonite. In this experimental work, FTIR and
Raman investigations on montmorillonite water mixtures as a function of time are carried out in
order to follow the montmorillonite dehydration process, as well as to characterize the process of
montmorillonite layer self‐assembly.
2. Materials and Methods
Pure powder montmorillonite purchased from Merck (Milano, Italy, surface area 250 m
2/g) and
double distilled water were employed to prepare the samples. Three samples of hydrated
montmorillonite were prepared by weight at three concentration values: i) 20 wt% of montmorillonite
and 80 wt% of water; ii) 25 wt% of montmorillonite and 75 wt% of water; and 35 wt% of
montmorillonite and 65 wt% of water. The samples were then mixed and then treated in order to get
a 1mm thick layer of hydrated montmorillonite.
Fourier Transform Infrared (FTIR, Bruker Optics, Ettlingen, Germany) spectroscopy allows us
to characterize the molecule rotational and vibrational motions [35–40]. Such a spectroscopic
technique explores 14000–10 cm
‐1range of the e‐m spectrum, which encompasses the Near‐IR (NIR)
range (14000–4000 cm
−1), the Mid‐IR (MIR) range (4000–400 cm
−1), and the Far‐ IR (400–10 cm
−1). FTIR
is, in some regards, a complementary technique in respect to other techniques such as Raman and
inelastic neutron spectroscopies and density function simulations [28,41–48]. In the present study,
the FTIR study was carried out in the range 400–4000 cm
−1with a spectral resolution of 4 cm
−1.
Furthermore, Raman spectra were registered by the spectrometer BRAVO (Bruker Optics),
operating in the 450–3200 cm
−1range. The source was constituted by two lasers working at the
wavelength of 785 nm and 1064 nm. The explored spectral range was 300–3200 cm
−1. The spot size
was 10–15 micron at 10× lens.
3. Analysis and Discussion
In Table 3, the FTIR spectral features of the hydroxyl groups associated with octahedral cations,
quartz, silicates, and water are listed. The most intense bands are at 1035 cm
−1(stretching in the Si‐O
plane) and at 529 cm
−1(Si−O bending vibration). The vibration at 1113 cm
−1represents the stretching
out of the Si–O plane. The wide bands at 3440 and 1639 cm
−1represent the stretching and bending
vibrations of the OH water molecules.
Table 3. FTIR band assignments for montmorillonite clay. Wavenumber (cm−1) Assignments 3697 O−H stretching 3623 O−H stretching 3440 O−H stretching, hydration 1639 O−H bending, hydration 1113 Si−O stretching, out‐of‐plane 1035 Si−O stretching, in‐plane 915 AlAlOH bending 793 Tridymite (platy forms) 692 SiO2 (Quartz) 529 Si−O bendingThe FTIR spectrum of pure montmorillonite (Figure 4) shows bands located at 3697 and 3623
cm
−1, which are attributed to the OH groups coordinated with the octahedral cations, including the
Figure 4. FTIR spectrum of pure montmorillonite showing the characteristic bands and vibration frequencies.
The 3623 cm
−1band indicates the substitution of octahedral Al
3+by Fe
2+or Mg
2+cations. As far as
the hydrated samples are concerned, in the present work we address the attention to the OH
stretching band, which interests the frequency range of 2700–3900 cm
−1. In particular, the FTIR spectra
are observed as a function of time (Figure 5), and then deconvoluted into Gaussian components;
finally, their time dependence is discussed [49–57]. For a comparison, the spectral profiles were
normalized. It should be noticed that a typical FTIR spectrum is characterized by two major bands;
by lowering temperature, the low‐frequency band, centered at 3200 cm
−1, becomes more prominent
in respect to the high frequency peak at 3400 cm
−1, while the total spectrum shifts towards lower
frequencies; at the same time, in presence of a dehydration process, it is expected that at first the
water open contribution, corresponding to bulk water decreases, whereas the so called water closed
contribution, connected with bound water persists for a longer time [58–62]. However, it should be
noticed that the spectrum could be deconvoluted into five Gaussians centered at 3050, 3200, 3400,
3500, and 3650 cm
−1. However, in the present study, we will adopt a two‐state model [63–66]. To
describe the structure and thermodynamic properties of liquid water within the montmorillonite
matrix, we adopt the so‐called two‐state model [67,68], which assumes two different states of
intermolecular bonding: One is an ice‐like state where water molecules are more ordered, and
another one is a more densely packed arrangement where hydrogen bonds are distorted [69–71].
Here, we apply the two‐state model and we partition the H
2O molecules into: i) H
2O molecules with
two OH groups both hydrogen‐bonded to a tetrahedral network, and ii) H
2O molecules whose
hydrogen bond is broken or weakened by distortion.
Figure 5. FTIR spectra of montmorillonite‐water mixtures, for the concentration of 25 wt% of montmorillonite; and 75 wt% of water, in the 400 < ∆ω < 4000 cm−1 spectral range vs. time.
Before the analysis, spectra of pure montmorillonite were subtracted from the spectra of
hydrated montmorillonite. Therefore, considering the spectra of the O–H stretching band for
montmorillonite‐water mixtures at different times, it is possible to decompose the spectra into a
‘closed’ and an ‘open’ contribution; the open contribution (~3200 cm ) is attributed to the O–H
vibrations in tetrabonded H
2O molecules, while the closed contribution ( ~3400 cm
) can be
attributed to the O–H vibration of H
2O molecules with a not fully developed hydrogen bond. Figure
6 shows the decomposition of the intramolecular contribution into a Gaussian band corresponding
to “open” water and a Gaussian band corresponding to “closed” water.
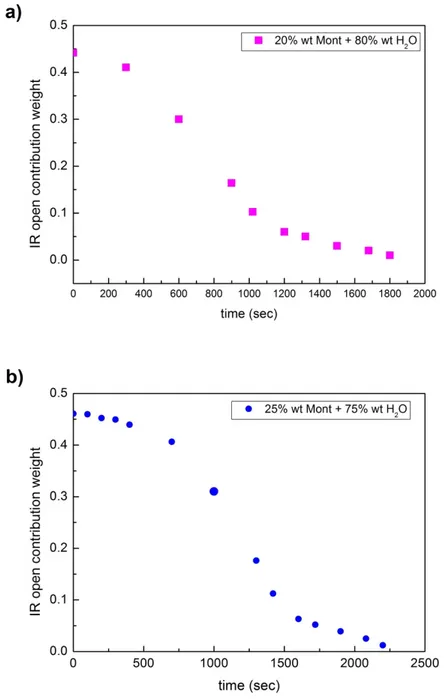
Figure 6. Decomposition of the intramolecular contribution into a Gaussian band corresponding to “open” water (blue dots) and a Gaussian band corresponding to “closed” water (red points).Figure 7 reports the behavior of the weights of the open contribution as a function of time for a
concentration value of: a) 20 wt% of montmorillonite and 80 wt% of water; b) 25 wt% of
montmorillonite; and 75 wt% of water; and c) 35 wt% of montmorillonite and 65 wt% of water. Figure
7d) shows the data obtained starting from the three different concentration values, scaled along the
time axis. As it can be seen, the data arrange along the same trend. What emerges is that while the
total water contribution decreases in time with a characteristic time of 1093 sec, determined by the
inflection point of the fitting curve, the relative weight of the open contribution decreases faster with
a characteristic time of 734 sec; in the meantime, the relative weight of the closed contribution, in
respect to the open contribution, increases.
Figure 7. Behavior of the weights of the open contribution as a function of time for a concentration value of: (a) 20 wt% of montmorillonite and 80 wt% of water; (b) 25 wt% of montmorillonite; and 75 wt% of water; and (c) 35 wt% of montmorillonite and 65 wt% of water; finally, (d) data obtained starting from the three different concentration values, scaled along the time axis; as it can be seen, the data follow the same trend.
To characterize the montmorillonite‐water interaction, an innovative wavelet cross correlation
technique has been employed [72–78]. In particular, such a method allows us to identify the degree
of similarity between two individual spectra. Furthermore, this method has been employed in
different scientific domains, like physics, mathematics, climate, geoscience, and engineering science
[79–88]. The wavelet cross‐correlation coefficient, 𝑟
,takes
into account the two wavelet
transforms, 𝑤 𝑎, 𝜏 and 𝑤 𝑎, 𝜏 , of the considered spectra and the two wavelet spectra 𝑆 𝑎 and
𝑆 𝑎 [89–99]. More precisely, a wavelet transform 𝑤𝑡 𝑎, 𝜏 is the inner product of the function 𝑓 𝑥
with translated and scaled mother wavelets 𝜓:
𝑤 𝑎, 𝜏
𝑎
1
𝑓 𝑥 𝜓
∗|𝑥
𝜏| 𝑑𝑥;
(1)
where 𝑎 denotes the scale parameter (𝑎
0 , 𝜏 represents the shift parameter, 𝑓 𝑥 is the one‐
dimensional function, * characterizes the complex conjugate, and 𝜓 is the mother wavelet:
𝜓
,𝜓 𝑥
𝑎
𝜏
;
(2)
by these expressions, one defines the wavelet spectrum 𝑆 𝑎 :
𝑆 𝑎
1
𝑎
|𝑤 𝑎, 𝜏 | 𝑑𝑥;
(3)
Finally, one determines the wavelet cross‐correlation coefficient, 𝑟
:
𝑟
𝑎
𝑤 𝑎, 𝜏 𝑤
∗𝑎, 𝜏 𝑑𝜏
𝑆 𝑎 𝑆 𝑎
(4)
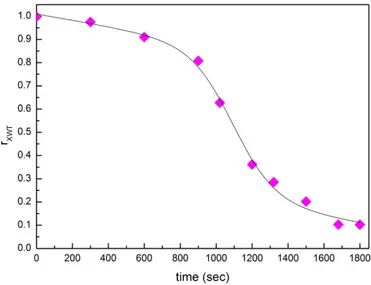
In this work we choose as reference wavelet spectrum the first spectrum at time 0 s. Figure 8
reports the evaluated wavelet cross‐correlation coefficient, 𝑟
, as a function of time for the
concentration of 25 wt% of montmorillonite; and 75 wt% of water [100–105]. It clearly emerges from
the figure that the wavelet cross‐correlation coefficient 𝑟
decreases as a function of time
following a decreasing sigmoid behavior whose inflection point abscissa is in excellent agreement
with the value extracted from the behavior of the open contribution weight as a function of time (see
Figure 7).
Figure 8. Wavelet cross‐correlation coefficient, 𝒓𝑿𝑾𝑻 as a function of time for the concentration of 25 wt% of montmorillonite; and 75 wt% of water.
As far as the Raman measurements are concerned, the spectral features of pure montmorillonite
clay are reported in Table 4. The assignments agree with those reported in [106]. In montmorillonite,
the central octahedral atom substitution can be inferred from the spectral region of 785–915 cm
−1; the
AlMgOH spectral band is located at 840 cm
−1, the AlFeOH spectral band is located at 890 cm
−1, and
the AlAlOH spectral band is located at 915 cm
−1.
Table 4. Raman band assignments for montmorillonite clay.
3620 cm−1 υ(OH) structural OH groups
1110 cm−1 υ(SiO) asymmetric mode of SiO4 tetrahedron
840 cm−1 δ(OH) bonded with octahedral cations; MgAlOH; wagging mode
785 cm−1 δ(OH) bonded with octahedral cations; AlOH; wagging mode
710 cm−1 δ(SiO) symmetric mode (A1) of SiO4 tetrahedron
430 cm−1 δ(OH) libration of OH
Before the analysis, spectra of pure montmorillonite were subtracted from the spectra of
hydrated. Figure 9 reports, for the concentration value of 25 wt% of montmorillonite and 75 wt% of
water, the Raman OH stretching contribution as a function time, while in the insert, the behavior of
the weights of the water open contribution as a function of time is reported. In agreement with FTIR
data, while the total water contribution decreases as a function of time, the relative weight of the open
contribution decreases faster; in the meantime, the relative weight of the closed contribution, in
respect to the open contribution, increases. Furthermore, the inflection point for Raman data
coincides with that obtained for the same concentration value with FTIR data.
Figure 9. Raman OH stretching contribution as a function time for the concentration value of 25 wt% of montmorillonite and 75 wt% of water. In the insert, the behavior of the weights of the water open contribution vs. time is reported.
These behaviors are due to the global decrease of the water content in the montmorillonite‐water
mixtures, and to the fact that while the tetrahedral contribution connected with free water decreases
faster in respect to the closed contribution, being this latter connected to water bonded to the
montmorillonite surface.
4. Conclusions
FTIR and Raman data have been collected for montmorillonite‐water mixtures, at a starting
weight composition (wt%) of 20%
–80%, 25%
–75%, and 35%
–65%, until the dehydrated state where
the samples appear as a homogeneous rigid layer of clay. To get some insight into the water hydrogen
bond network in the presence of montmorillonite, FTIR and Raman spectra have been analyzed
following two alternative approaches. In particular, the intramolecular OH stretching mode in the
frequency range of 2700
–3900 cm
−1has been deconvoluted into two Gaussian bands, while the same
spectral contributions were analyzed by means of a wavelet cross‐correlation approach. The two
procedures suggest that the total water contribution decreases in time, with a characteristic time of
1093 sec at room temperature. The percentage of the open water contribution decreases in time faster,
whereas the percentage of the closed water contribution, in respect to the open contribution,
increases, so indicating that a residual water content, characterized by a higher structural disorder,
rests entrapped in the montmorillonite layer structures for a longer time, promoting the self‐assembly
of montmorillonite layers.
Author Contributions: Conceptualization, visualization, methodology, M.T.C, G.M and S.M.; formal analysis, M.T.C., G.M.; investigation, M.T.C, G.M and S.M.; writing‐original draft preparation, M.T.C, G.M, L.M., D.L., S.M.; writing ‐ review and editing, S.M, L.M., and D.L.; supervision and project administration, S.M.; All authors have read and agreed to the published version of the manuscript. Funding: This research received no external funding. Acknowledgments: This work is to be framed within the Progetto di Ricerca e Sviluppo ““Materiali di nuova generazione per il restauro dei Beni Culturali: nuovo approccio alla Fruizione (AGM for CuHe: Advanced Green Materials for Cultural Heritage)” Asse II “Sostegno all’innovazione”, Area di Specializzazione “Cultural Heritage” Avviso n. 1735/Ric del 13 luglio 2017 ‐ Codice CUP B66G18000500005, codice identificativo Progetto ARS01_00697 nell’ambito del Programma Operativo Nazionale “Ricerca e Innovazione” 2014‐2020 (PON R&I 2014‐2020). Conflicts of Interest: The authors declare no conflict of interest.References
1. Kloprogge, J.T.; Komarneni, S.; Amonette, J.E. Synthesis of smectite Clay mineral: A critical review. Clays Clay Miner. 1999, 47, 529–554. 2. Kalo, H.; Milius, W.; Breu, J. Single crystal structure refinement of one‐ and two‐layer hydrates of sodium fluorohectorite. RSC Adv. 2012, 2, 8452–8459, doi:10.1039/C2RA20457F. 3. Dor, M.; Levi‐Kalisman, Y.; Day‐Stirrat, R.J.; Mishael, Y.; Emmanuel, S. Assembly of clay mineral platelets, tactoids, and aggregates: Effect of mineral structure and solution salinity. J. Colloid Interface Sci. 2020, 566, 163–170, doi:10.1016/j.jcis.2020.01.084. 4. Zhou, T.; Wang, Y.; Huang, S.; Zhao, Y.; Synthesis composite hydrogels from inorganic‐organic hybrids based on leftover rice for environment‐friendly controlled‐release urea fertilizers. Sci. Total Environ. 2018, 15, 422–430, doi:10.1016/j.scitotenv.2017.09.084. 5. Bhattacharyya, K.G.; Sen Gupta, S. Adsorption of a few heavy metals on natural and modified kaolinite and montmorillonite: A review. Adv. Colloid Interface Sci. 2008, 40, 114–131, doi:10.1016/j.cis.2007.12.008. 6. Kumar, P.; Jasra, R.V.; Bhat, T.S.G. Evolution of porosity and surface acidity in montmorillonite clay on acid activation. Ind. Eng. Chem. Res. 1995, 34, 1440–1448, doi:10.1021/ie00043a053.7. He, H.; Guo, J.; Xie, X.; Lin, H.; Li, L. A microstructural study of acid‐activated montmorillonite from Choushan, China. Clay Miner. 2002, 37, 337–344, doi:10.1180/0009855023720037.
8. Leite, F.L.; Bueno, C.C.; Da Róz, A.L.; Ziemath, E.C.; Oliveira, O.N., Jr. Theoretical models for surface forces and adhesion and their measurement using atomic force microscopy. Int. J. Mol. Sci. 2012, 13, 12773–12856, doi:10.3390/ijms131012773.
9. Cecilia, J.A.; García‐Sancho, C.; Franco, F. Montmorillonite based porous clay heterostructures: Influence of Zr in the structure and acidic properties. Microporous Mesoporous Mater. 2013, 176, 95–102, doi:10.1016/j.micromeso.2013.03.037.
10. Li, S.; Wu, P.; Li, H.; Zhu, N.; Dang, Z. Synthesis and characterization of organo‐montmorillonite supported iron nanoparticles. Appl. Clay Sci. 2010, 3, 330–336, doi:10.1016/j.clay.2010.08.021.
11. Hosseini, M.G.; Jafari, M.; Najjar, R. Effect of polyaniline–montmorillonite nanocomposite powders addition on corrosion performance of epoxy coatings on Al 5000. Surf. Coat. Int. 2011, 206, 280–286, doi:10.1016/j.surfcoat.2011.07.012.
12. Komatsu, L.G.H.; Oliani, W.L.; Lugao, A.B.; Parra, D.F. Environmental ageing of irradiated polypropylene/montmorillonite nanocomposites obtained in molten state. Radiat. Phys. Chem. 2014, 97, 233– 238, doi:10.1177/0892705715569825.
13. Kang, M.K.; Cha, E.J.; Song, H.H.; Na, Y.H. Interlayer structure and magnetic field‐induced orientation of
modified nanoclays in polymer aqueous solution. Heliyon 2019, 5, e02421,
doi:10.1016/j.heliyon.2019.e02421.
14. Chen, Q.; Zhu, R.; Ma, L.; Zhou, Q.; He, H. Influence of interlayer species on the thermal characteristics of montmorillonite. Appl. Clay Sci. 2017, 135, 129–135, doi:10.1016/j.clay.2016.09.014.
15. Andronescu, C.; Gârea, S.A.; Deleanu, C.; Nicolescu, A.; Iovu, H. The influence of montmorillonite concentration and solvent polarity on the synthesis of benzoxazine monomers in the presence of montmorillonite. Appl. Clay Sci. 2013, 86, 99–105, doi:10.1016/j.clay.2013.10.012.
16. Fernández, M.; Alba, M.D.; Torres Sánchez, R.M. Effects of thermal and mechanical treatments on montmorillonite homoionized with mono‐ and polyvalent cations: Insight into the surface and structural changes. Colloids Surf. A 2013, 423, 1–10, doi:10.1016/j.colsurfa.2013.01.040.
17. Fan, M.; Yuan, P.; Zhu, J.; Chen, T.; Liu, D. Core–shell structured iron nanoparticles well dispersed on montmorillonite. J. Magn. Magn. Mater. 2009, 321, 3515–3519, doi:10.1016/j.jmmm.2009.06.060.
18. Tunç, S.; Duman, O. Preparation and characterization of biodegradable methyl cellulose/montmorillonite nanocomposite films. Appl. Clay Sci. 2010, 48, 414–424, doi:10.1016/j.clay.2010.01.016.
19. Savelyev, Y.V.; Gonchar, A.N. Exfoliation of Montmorillonite in polymer matrix and its influence on the nanocomposites properties. Polym. J. 2019, 41, 149–158, doi:10.15407/polymerj.41.03.149.
20. Santos, K.S.; Bischoff, E.; Liberman, S.A.; Oviedo, M.A.; Mauler, R.S.; The effects of ultrasound on
organoclay dispersion in the pp matrix. Ultrason. Sonochem. 2011, 18, 997–1001,
doi:10.1016/j.ultsonch.2011.03.011.
21. Nicolosi, V.; Chhowalla, M.; Kanatzidis, M.G.; Strano, M.S.; Coleman, J.N. Liquid exfoliation of layered materials. Science 2013, 340, 1–18.
22. Chaudhary, D.; Liu, H. Ultrasonic treatment and synthesis of sugar alcohol modified Na+‐montmorillonite
clay. Ultrason. Sonochem. 2013, 20, 63–68.
23. Martinez‐Colunga, J.G.; Sanchez‐Valdes, S.; Blanco‐Cardenas, A.; Ramírez‐Vargas, E.; Ramos‐De Valle, L.F.; Benavides‐Cantu, R.; Espinoza‐Martinez, A.B.; Sanchez‐Lopez, S.; Lafleur, P.G.; Karami, S.; et al. Dispersion and exfoliation of nanoclays in itaconic acid funcionalized LDPE by ultrasound treatment. J.
Appl. Polym. Sci. 2018, 46260, 1–10, doi:10.1002/app.46260.
24. Li, Z.; Su, G.; Zheng, Q.; Nguyen, T.S. A dual‐porosity model for the study of chemical effects on the swelling behaviour of MX‐80 bentonite. Acta Geotech. 2019, doi:10.1007/s11440‐019‐00762‐5.
25. Murad, M.A.; Moyne, C. A dual‐porosity model for ionic solute transport in expansive clays. Comput.
Geosci. 2008, 12, 47–82, doi:10.1007/s10596‐007‐9060‐z.
26. Musso, G.; Romero, E.; della Vecchia, G. Double‐structure effects on the chemo‐hydro‐mechanical behaviour of a compacted active clay. Geotechnique 2013, 63,206–220, doi:10.1680/geot.SIP13.P.011. 27. Emiel, J.M.; Hensen, S.B. Why clay swell. J. Phys. Chem. B 2002, 106, 12664–12667.
28. Tyagi, B.; Chudasama, C.D.; Jasra, R.V. Determination of structural modification in acid activated montmorillonite clay by FT‐IR spectroscopy. Spectrochim. Acta A 2006, 64, 273–278. 29. Zheng, Y.; Zaoui. A. Mechanical behavior in hydrated Na‐montmorillonite clay. Physica A 2018, 582–590, doi:10.1016/j.physa.2018.03.093. 30. Wan, Y.; Zhao, D. On the controllable soft‐templating approach to mesoporous silicates. Chem. Rev. 2007, 107, 2821–2860, doi:10.1021/cr068020s. 31. Bonaccorsi, L.; Calandra, P.; Kiselev, M.A.; Amenitsch, H.; Proverbio, E.; Lombardo, D. Self‐assembly in poly(dimethylsiloxane)‐poly(ethylene oxide) block copolymer template directed synthesis of linde type A zeolite. Langmuir 2013, 29, 7079–7086, doi:10.1021/la400951s. 32. Stein, A.; Rudisill, S.G.; Petkovich, N.D. Perspective on the influence of interactions between hard and soft templates and precursors on morphology of hierarchically structured porous materials. Chem. Mater. 2013, 26, 259–276, doi:10.1021/cm402184h.
33. Bonaccorsi, L.; Lombardo, D.; Longo, A.; Proverbio, E.; Triolo, A. Dendrimer template directed self‐ assembly during zeolite formation. Macromolecules 2009, 42, 1239–1243, doi:10.1021/ma802393e.
34. Bonaccorsi, L.; Calandra, P.; Amenitsch, H.; Proverbio, E.; Lombardo, D. Growth of fractal aggregates during template directed SAPO‐34 zeolite formation. Microporous Mesoporous Mater. 2013, 167, 3–9. 35. Strangman, G.; Boas, D.A.; Sutton, J.P. Non‐invasive neuroimaging using near‐infrared light. Biol. Psych.
36. Villringer, A.; Chance, B. Non‐invasive optical spectroscopy and imaging of human brain function. Trends
Neurosci. 1997, 20, 435–42, doi:10.1016/S0166‐2236(97)01132‐6.
37. Doménech Carbó, M.T.; Bosch Reig, F.; Gimeno Adelantado, J.V.; Periz Martínez, V. Fourier transform infrared spectroscopy and the analytical study of works of art for purposes of diagnosis and conservation. Anal. Chim. Acta 1996, 330, 207–215. 38. Rohman, A.; Che Man, Y.B. Analysis of cod‐liver oil adulteration using Fourier transform infrared (FTIR) spectroscopy. J. Am. Oil Chem. Soc. 2009, 86, 1149–1153. 39. Coates, J. Interpretation of infrared spectra, a practical approach. Encycl. Anal. Chem. 2006 10815–10837. 40. Caccamo, M.T.; Cannuli, A. PEG acoustic levitation treatment for historic wood preservation investigated by means of FTIR spectroscopy and wavelets. Curr. Chem. Biol. 2019, 13, 60–72. 41. Deepa, M.; Sharma, N.; Agnihotory, S.A.; Chandra, R. FTIR investigation on iondion interactionin liquid and gel polymeric electrolytes‐LiCF3SO3‐PC‐PMMA. J. Mater. Sci. 2001, 37, 1759–1765. 42. Suthanthiraraj, S.A.; Kumar, R.J.; Paul, B. Vibrational spectroscopic and electrochemical characteristics of Poly (Propylene Glycol)‐silver triflate polymerelectrolyte system. Ionics 2009, 16, 145–151. 43. Winie, T.; Arof, A.K. FT‐IR studies on interactions among components in hexanoyl chitosan‐based polymer electrolytes. Spectrochim. Acta A 2006, 63, 677–684.
44. Migliardo, F.; Magazù, S.; Caccamo, M.T. Infrared, Raman and INS studies of poly‐ethylene oxide oligomers. J. Mol. Struct. 2013, 1048, 261–266, doi:10.1016/j.molstruc.2013.05.060.
45. Duval, M.; Gross, E. Degradation of poly (ethylene oxide) in aqueous solutions by ultrasonic waves.
Macromolecules 2013, 46, 4972–4977, doi:10.1021/ma400737g.
46. Magazù, S. NMR, static and dynamic light and neutron scattering investigations on polymeric aqueous solutions. J. Mol. Struct. 2000, 523, 47–59, doi:10.1016/S0022‐2860(99)00411‐1.
47. Polik, W.F.; Burchard, W. Static light scattering from aqueous poly (ethylene oxide) solutions in the temperature range 20–90 °C. Macromolecules 1983, 16, 978–982, doi:10.1021/ma00240a030.
48. Iguchi, C.Y.; dos Santos, W.N.; Gregorio, R., Jr. Determination of thermal properties of pyroelectric polymers, copolymers and blends by the laser flash technique Polym. Test. 2007, 26, 788–792. 49. Magazù, S.; Migliardo, F.; Gonzalez, M.A.; Mondelli, C.; Parker, S.F.; Vértessy, B.G. Molecular mechanisms of survival strategies in extreme conditions. Life 2012, 2, 364–376, doi:10.3390/life2040364. 50. Bukowski, R.; Szalewicz, K.; Groenenboom, G.C.; van der Avoird, A. Predictions of the properties of water from first principles. Science 2007, 315, 1249–1252, doi:10.1126/science.1136371. 51. Cesaro, A.; Magazu, S.; Migliardo, F.; Sussich, F.; Vadalà, M. Comparative study of structural properties of trehalose water solutions by neutron diffraction, synchrotron radiation and simulation. Physica B 2004, 350, E367–E370, doi:10.1016/j.physb.2004.03.098. 52. Magazu, S.; Migliardo, F.; Ramirez‐Cuesta, A.J. Changes in vibrational modes of water and bioprotectants in solution. Biophys. Chem. 2007, 125, 138–142, doi:10.1016/j.bpc.2006.07.003.
53. Uchida, T.; Nagayama, M.; Shibayama, T.; Gohara, K. Morphological investigations of disaccharide molecules for growth inhibition of ice crystals. J. Cryst. Growth. 2007, 299, 125–135, doi:10.1016/j.jcrysgro.2006.10.261.
54. Blazhnov, I.V.; Magazù, S.; Maisano, G.; Malomuzh, N.P.; Migliardo, F. Macro‐ and microdefinitions of
fragility of hydrogen‐bonded glass‐forming liquids. Phys. Rev. E 2006, 73, 031201,
doi:10.1103/PhysRevE.73.031201.
55. Magazu, S.; Migliardo, F.; Telling, M.T.F. Study of the dynamical properties of water in disaccharide solutions. Eur. Biophys. J. 2007, 36, 163–171, doi:10.1007/s00249‐006‐0108‐0.
56. Errington, J.R.; Debenedetti P.G. Relationship between structural order and the anomalies of liquid water.
Nature 2001, 409, 318–321, doi:10.1038/35053024.
57. Magazu, S.; Migliardo, F.; Telling, M.T.F. alpha,alpha‐Trehalose‐water solutions. VIII. Study of the diffusive dynamics of water by high‐resolution quasi elastic neutron scattering. J. Phys. Chem. B 2006, 110, 1020–1025, doi:10.1021/jp0536450.
58. Magazu, S.; Migliardo, F.; Mondelli, C.; Vadalà, M. Correlation between bioprotective effectiveness and dynamic properties of trehalose‐water, maltose‐water and sucrose‐water mixtures. Carbohydr. Res. 2005,
340, 2796–2801, doi:10.1016/j.carres.2005.09.026.
59. Mahoney, M.W.; Jorgensen, W.L. Quantum, intramolecular flexibility, and polarizability effects on the reproduction of the density anomaly of liquid water by simple potential functions. J. Chem. Phys. 2001, 115, 10758, doi:10.1063/1.1418243.
60. Branca, C.; Maccarrone, S.; Magazu, S.; Maisano, G.; Bennington, S.M.; Taylor, J. Tetrahedral order in homologous disaccharide‐water mixtures. J. Chem. Phys. 2005, 122, 174513, doi:10.1063/1.1418243. 61. Stone, A.J. Water from first principles. Science 2007, 315, 1228–1229, doi:10.1126/science.1140758.
62. Caccamo, M.T.; Magazù, S. Intramolecular OH stretching analysis of hydrated lysozyme in presence of trehalose by IR spectroscopy. Atti Accad. Pelorit. Pericol. Cl. Sci. Fisiche Mat. Nat. 2019, 97, A2, doi:10.1478/AAPP.97S1A2, ISSN 1825‐1242.
63. Gerstein, M.; Levitt, M. Simulating water and the molecules of life. Sci. Am. 1998, 279, 100–105, doi:10.1038/scientificamerican1198‐100. 64. Rahman, A.; Stillinger, F. Molecular dynamics study of liquid water. J. Chem. Phys. 1971, 55, 3336–3359, doi:10.1063/1.1676585. 65. Sharp, K. Water: Structure and properties. Encycl. Life Sci. 2001, 1–7, doi:200110.1038/npg.els.0003116. 66. Liu, J.H.; Xiao, Z.; John Z.H. Structure of liquid water—A dynamical mixture of tetrahedral and ‘ring‐and‐ chain’ like structures. Phys. Chem. Chem. Phys. 2017, 19, 11931–11936, doi:10.1039/c7cp00667e.
67. Cipcigan, F.S.; Sokhan, V.P.; Jones, A.P.; Crain, J.; Martyna, G.J. Hydrogen bonding and molecular orientation at the liquid‐vapour interface of water. Phys. Chem. Chem. Phys. 2015, 17, 8660–8669, doi:10.1039/C4CP05506C.
68. Soper, A.K. The radial distribution functions of water as derived from radiation total scattering experiments: Is there anything we can say for sure? ISRN Phys. Chem. 2013, 2013, 279463, doi:10.1155/2013/279463. 69. Stillinger, F.H.; Rahman, A. Improved simulation of liquid water by molecular dynamics. J. Chem. Phys. 1974, 60, 1545–1557. 70. Magazu, S.; Migliardo, F.; Ramirez‐Cuesta, A.J. Inelastic neutron scattering study on bioprotectant systems. J. Royal Soc. Interface 2005, 2, 527–532, doi:10.1098/rsif.2005.0059. 71. Magazu, S.; Migliardo, F.; Telling, M.T.F. Structural and dynamical properties of water in sugar mixtures. Food Chem. 2008, 106, 1460–1466, doi:10.1016/j.foodchem.2007.05.097.
72. Magazù, S.; Migliardo, F.; Caccamo, M.T.; Innovative wavelet protocols in analyzing elastic incoherent neutron scattering. J. Phys. Chem. B 2012, 116, 9417–9423, doi:10.1021/jp3060087. 73. Sweldens, W. The lifting scheme: A construction of second generation wavelets. SIAM J. Math. Anal. 1998, 29, 511–546, doi:10.1137/S0036141095289051. 74. Magazù, S.; Migliardo, F.; Vertessy, B.G.; Caccamo, M.T. Investigations of homologous disaccharides by elastic incoherent neutron scattering and wavelet multiresolution analysis. Chem. Phys. 2013, 424, 56–61, doi:10.1016/j.chemphys.2013.05.004. 75. Machado, J.A.; Costa, A.C.; Quelhas, M.D. Wavelet analysis of human DNA. Genomics 2011, 98, 155−163, doi:10.1016/j.ygeno.2011.05.010. 76. Migliardo, F.; Caccamo, M.T.; Magazù, S. Elastic incoherent neutron scatterings wavevector and thermal analysis on glass‐forming homologous disaccharides. J. Non Crys. Solids 2013, 378, 144–151, doi:10.1016/j.jnoncrysol.2013.06.030. 77. Benson, N.C.; Daggett, V. Wavelet analysis of protein motion. Int. J. Wavel. Multiresolut. Inf. Process 2012, 10, 1250040, doi:10.1142/S0219691312500403. 78. Caccamo, M.T.; Magazù, S. Variable mass pendulum behaviour processed by wavelet analysis. Eur. J. Phys. 2017, 38, 015804, doi:10.1088/0143‐0807/38/1/015804. 79. Liu, J.; Moulin, P. Information‐theoretic analysis of interscale and intrascale dependencies between image wavelet coefficients. IEEE Trans. Image Process 2001, 10, 1647−1658.
80. Caccamo, M.T.; Magazù, S. Variable length pendulum analyzed by a comparative fourier and wavelet
approach. Rev. Mex. Fisica E 2018, 64, 81–86. 81. Magazù, S.; Caccamo, M.T. Wavelets approach in physics education. In Wavelets: Principles, Analysis and Applications; Nova Science Publishers, Inc.: Hauppauge, NY, USA, 2018; pp. 1–20. 82. Lio, P. Wavelets in bioinformatics and computational biology: State of art and perspectives. Bioinformatics 2003, 19, 2−9, doi:10.1093/bioinformatics/19.1.2. 83. Colombo, F.; Caccamo, M.T.; Magazù, S. Wavelet analysis as a tool for characterizing trends in climatic data. In Wavelets: Principles, Analysis and Applications; Nova Science Publishers, Inc.: Hauppauge, NY, USA, 2018; pp. 55–76. 84. Hsua, W.Y.; Lin, C.C.; Ju, M.S.; Suna, Y.N. Wavelet‐based fractal features with active segment selection: Application to single‐trial EEG data. J. Neur. Methods 2007, 163 145–160, doi:10.1016/j.jneumeth.2007.02.004.
85. Caccamo, M.T.; Magazù, S. Applications of wavelet analyses on spectroscopic experiments. In Wavelets:
Principles, Analysis and Applications; Nova Science Publishers, Inc.: Hauppauge, NY, USA, 2018; pp. 77–90.
86. Torrence, C.; Compo, G.P. A Practical Guide to Wavelet Analysis. Bull. Am. Meteorol. Soc. 1998, 79, 61–78. 87. Martin, R.L.; Gardiner, E.J.; Senger, S.; Gillet, V.J. Compression of molecular interaction fields using wavelet
thumbnails: Application to molecular alignment. J. Chem. Inf. Model. 2012, 52, 757−769, doi:10.1021/ci200348h.
88. Otsuka, T.; Nakai, H. Wavelet transform analysis of ab initio molecular dynamics simulation: Application to core‐excitation dynamics of BF3. J. Comput. Chem. 2007, 28, 1137−1144, doi:10.1002/jcc.20599.
89. Caccamo, M.T.; Magazù, S. “EG‐PEG mixtures: IR spectra wavelet cross‐correlation analysis”. Appl.
Spectrosc. 2017, 71, 401–409, doi:10.1177/0003702816662882.
90. Caccamo, M.T.; Magazù, S. Multiscaling wavelet analysis of infrared and raman data on polyethylene glycol 1000 aqueous solutions. Spectrosc. Lett. 2017, 50, 130–136, doi:10.1080/00387010.2017.1291524. 91. Li, H.; Nozaki, T. Wavelet cross‐correlation analysis and its application to a plane turbulent jet. JSME Int. J. Ser. B 1997, 40, 58–66, doi:10.1299/jsmeb.40.58. 92. Caccamo, M.T.; Cannuli, A.; Magazù, S. Wavelet analysis of near‐resonant series RLC circuit with time‐ dependent forcing frequency. Eur. J. Phys. 2018, 39, aaae77. 93. Grinsted, A.; Moore, J.C.; Jevrejeva, S. Application of the cross wavelet transform and wavelet coherence to geophysical time series. Nonlin. Processes Geophys. 2004, 11, 561–566. 94. Caccamo, M.T.; Magazù, S. “A Conic Pendulum of Variable Length Analysed by wavelets”. In New Trends in Physics Education Research; Nova Science Publishers, Inc.: Hauppauge, NY, USA, 2018; pp. 117–131, ISBN 978‐1‐53613‐893‐1. 95. Veleda, D.; Montagne, R.; Araujo, M. Cross‐wavelet bias corrected by normalizing scales. J. Atmos. Ocean. Technol. 2012, 29, 1401–1408, doi:10.1175/JTECH‐D‐11‐00140.1. 96. Razdan, A. Wavelet correlation coefficient of ‘strongly correlated’ financial time series. Physica A 2004, 333, 335–342, doi:10.1016/j.physa.2003.10.042.
97. Brito, A. A.; Rodrigues Santos, F.; de Castro, A. P. N.; da Cunha Lima, A. T.; Zebende, G. F.; da Cunha Lima, I. C. Cross‐correlation in a turbulent flow: Analysis of the velocity field using the ρDCCA coefficient.
EPL 2018, 123, 20011, doi: 10.1209/0295‐5075/123/20011
98. Magazù, S.; Caccamo, M.T. Fourier and wavelet analyses of climate data. In New Trends in Physics Education
Research; Nova Science Publishers, Inc.: Hauppauge, NY, USA, 2018; pp. 226–241, ISBN 978‐1‐53613‐893‐1.
99. Caccamo, M.T.; Magazù, S. Tagging the oligomer‐to‐polymer crossover on EG and PEGs by infrared and Raman spectroscopies and by wavelet cross‐correlation spectral analysis. Vib. Spectr. 2016, 85, 222–227, doi:10.1016/j.vibspec.2016.04.017.
100. Migliardo, F.; Caccamo, M.T.; Magazù, S. Thermal analysis on bioprotectant disaccharides by elastic incoherent neutron scattering. Food Biophys. 2014, 9, 99–104, doi:10.1007/s11483‐013‐9322‐3.
101. Caccamo, M.T.; Magazù, S. Thermal restraint on PEG‐EG mixtures by FTIR investigations and wavelet cross‐correlation analysis. Polym. Test. 2017, 62, 311–318, doi:10.1016/j.polymertesting.2017.07.008. 102. Cannuli, A.; Caccamo, M.T.; Castorina, G.; Colombo, F.; Magazù, S. Laser techniques on acoustically
levitated droplets. EPJ Web Conf. 2018, 167, 05010, doi:10.1051/epjconf/201816705010.
103. Magazù, S.; Calabrò, E.; Caccamo, M.T.; Experimental study of thermal restraint in bio‐protectant disaccharides by FTIR spectroscopy. Open Biotechnol. 2018, 12, 123–133, doi:10.2174/1874070701812010123. 104. Caccamo, M.T.; Zammuto, V.; Gugliandolo, C.; Madeleine‐Perdrillat, C.; Spanò, A.; Magazù, S. Thermal
restraint of a bacterial exopolysaccharide of shallow vent origin. Int. J. Biol. Macromol. 2018, 114, 649–655, doi:10.1016/j.ijbiomac.2018.03.160.
105. Caccamo, M.T.; Gugliandolo, C.; Zammuto, V.; Magazù, S. Thermal properties of an exopolysaccharide produced by a marine thermotolerant Bacillus licheniformis by ATR‐FTIR spectroscopy. Int. J. Biol.
Macromol. 2020, 145, 77–83, doi:10.1016/j.ijbiomac.2019.12.163.
106. Ritz, M.; Vaculíkovác, L.; Kupkováe, J.; Plevovác, E.; Bartonová, L. Different level of fluorescence in Raman spectra of montmorillonites. Vib. Spectr. 2016 84, 7–15, doi:10.1016/j.vibspec.2016.02.007.
© 2020 by the authors. Licensee MDPI, Basel, Switzerland. This article is an open access article distributed under the terms and conditions of the Creative Commons Attribution (CC BY) license (http://creativecommons.org/licenses/by/4.0/).