Università degli Studi di Ferrara
DOTTORATO DI RICERCA IN
" BIOLOGIA EVOLUZIONISTICA E AMBIENTALE"
CICLO XXIV
COORDINATORE Prof. GUIDO BARBUJANI
ECOLOGY AND CONSERVATION OF TIGER Panthera tigris AND LEOPARD
Panthera pardus IN A SUBTROPICAL LOWLAND AREA, NEPAL
Settore Scientifico Disciplinare BIO/05
Dottorando Tutore
Dott. Pokheral Chiranjibi Prasad Prof. Fusani Leonida
Co-Tutori Prof. Lovari Sandro Dr. Jnawali Shant Raj Anni 2009/2011
i ECOLOGY AND CONSERVATION OF TIGER Panthera tigris AND LEOPARD
Panthera pardus IN A SUBTROPICAL LOWLAND AREA IN NEPAL
ABSTRACT
Ecology and conservation of tigers Panthera tigris and leopards Panthera pardus are studied in this thesis. The study was carried out between 2008 and 2011 in the Shuklaphanta Wildlife Reserve (SWR), a subtropical lowland area in Nepal. Both these large carnivores are sympatric in many parts of their distributional ranges in Asia. Due to poaching, habitat loss and prey depletion, the tiger is already considered an endangered species globally, whereas leopard is nearly threatened. The present study addresses the ecology and conservation of these sympatric carnivores in one densely settled area situated within the Terai Arc Landscape of Nepal, where the tiger population recently declined by about sixty percent within a decade long period. Because carnivore ecology is largely governed by their prey, understanding the feeding ecology and behavioural flexibility of felids in prey selection is essential to address their conservation requirements. The prey selection by the two carnivores were quantified by scat analysis and the distance sampling line transect method in an area of about 250 km2. Results obtained from camera trapping were used to quantify the activity patterns
as well as the status and spatial behaviour of the tigers and leopards. In addition, non- invasive genetic analysis of their scats were made to identify the minimum number of tigers and leopards in SWR. For the genetics part, the Karnali floodplain area (ca. 100km2) of Bardia National Park (BNP) located 150 km further east was also included.
On average, 131 and 175 individual prey animals per km2 were estimated during the dry seasons of 2010 and 2011, respectively. Of these, 62-63% was wild prey and 38% were domestic animals. Individually, swamp deer was the most abundant wild prey, followed by chital, rhesus, langur, hog deer, wild boar, nilgai and muntjac in 2010. However, in 2011 chital was the most abundant among wild prey, followed by swamp deer, rhesus, hog deer, langur, wild boar, muntjac and nilgai. The analysis of 194 tiger and 42 leopard scats showed the occurrence of 12 and 14 prey species, respectively. Tiger and leopard diets were composed of a large quantity of wild ungulates (77% for tigers and 51% for leopards). The relative occurrences of prey items (wild ungulates) in the diet differed significantly between tiger and leopard (G=11.12; df=1, p<0.001). Medium sized prey species, such as chital were most common in the tiger diet, whereas small species showed up most frequently in the leopard diet, followed by medium sized species. Tigers consumed more large prey than the leopards did. The niche overlap values indicated a great dietary overlap of tiger than leopard. Camera trapping data showed that both tigers and leopards were photo-captured more frequently at night than during the day thus indicating that both have a nocturnal activity, however, tigers were found to have more diurnal activity than leopards. Variances in time use, temporally or spatially, have been recognized as behavioural characteristics that may motivate coexistence. In general, between 11AM- 5PM leopards were less active than tigers, probably to avoid the hottest period of the day, and because of a preference for the small sized prey that are most active during dusk and dawn. Concentration within certain areas and limited diurnal activity of leopards indicated the existence of temporal niche segregation between these cats. Camera trapping identified 11 individual tigers (six males and five
ii
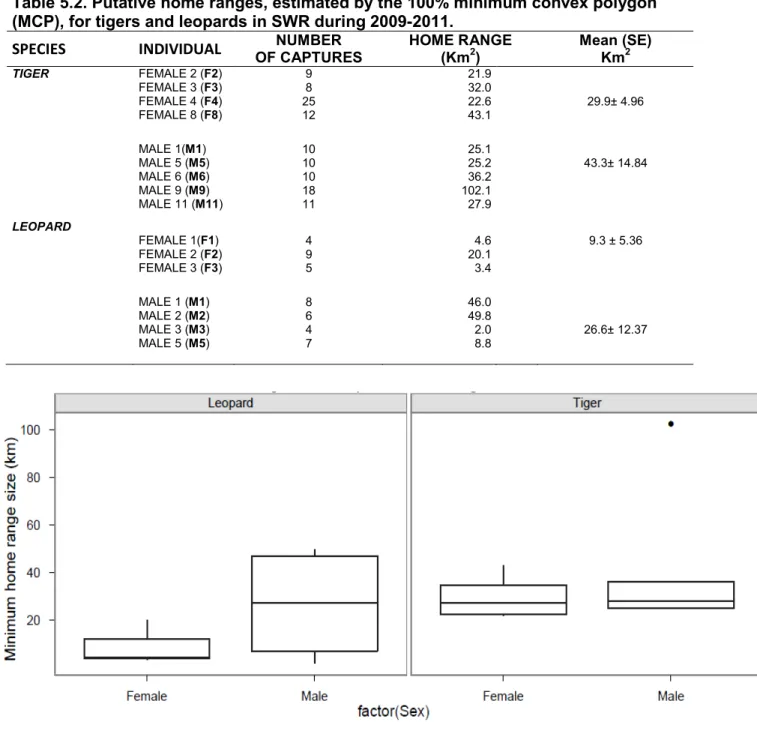
females) and 9 leopards (five males and four females) in SWR. The genetic analysis identified only 5 tigers and 4 leopards from SWR, and 6 tigers from the Karnali floodplain of BNP. Population density of tigers in SWR was estimated at between 1.8 and 2.9/100 km2, while that for leopards was estimated at between 1.8 and 2.6/100 km2 during the study period. From 9 tigers in SWR. I calculated an average home range (HR) of 36.6 km2, with male HR (43.3 km2) being 1.45 times larger on average than
those of females (29.9 km2). Among leopards (n=7) an average HR of 17.9 km2, was recorded, with males HRs (26.6 km2) 2.86 times larger than those of females (9.3 km2).
The HRs of all male tigers overlapped each other at least partially and almost completely in some cases. HRs of male tigers overlapped more than those of female tigers, and male HRs overlapped with more than one individual female. Leopard HRs tended to overlap less than those of tigers, with values ranging up to 7 km2 for females
to 2-24 km2 for males (overall mean 8.83 km2). As displayed by the tiger, male leopard
HRs tended to overlap with those of several females. The data suggested that even though there was 12 to 18 % median overlap between tiger and leopard HRs, there was a clear spatial separation between them. Leopards were more restricted to the periphery of the reserve, while tigers occupied the core or mostly undisturbed areas of the reserve. This research provides the first set of data on tigers, leopards and their prey in SWR, Nepal during the dry season. However, immediate needs for further research on wildlife disease, especially focused on large carnivores, and human-disturbance in the reserve including prey availability in the eastern selection of the reserve area, an issue which was not included in this study. Furthermore research is needed on predator-prey relation with the inclusion of trans-boundary wildlife corridor utilization and the link between the smaller protected areas in the trans-border level.
iii ECOLOGIA E CONSERVAZIONE DELLA TIGRE Panthera tigris E
DEL LEOPARDO COMUNE Panthera pardus IN UN’AREA SUBTROPICALE DEL NEPAL
RIASSUNTO
L’ecologia della tigre Panthera tigris e del leopardo comune Panthera pardus è stata studiata tra il 2008 e il 2011 nella Shuklaphanta Wildlife Reserve (SWR), un’area subtropicale del Nepal. Entrambi questi carnivori vivono in simpatria in gran parte dei loro areali di distribuzione in Asia. A causa del bracconaggio, della perdita di habitat e della rarefazione delle prede, la tigre è già considerata una specie in pericolo di estinzione su scala globale, mentre il leopardo comune è quasi in pericolo. Questo studio ha analizzato aspetti di ecologia e conservazione di questi carnivori simpatrici in un’area con abbondanti insediamenti umani, nel Terai (Nepal), dove la popolazione di tigre si è ridotta di c. il 60% nell’ultimo decennio. Dal momento che l’ecologia dei carnivori è largamente influenzata dalla presenza delle prede, lo studio dell’alimentazione e della flessibilità trofica nella selezione delle prede è essenziale per indirizzare le misure di conservazione dei predatori. La selezione delle prede è stata valutata con il metodo del distance sampling, in un’area di c.250 km2. Il camera trapping
è stato utilizzato per stimare ritmi di attività e comportamento spaziale di tigri e leopardi. Inoltre, analisi genetiche di campioni fecali hanno consentito di stimare il numero minimo di tigri e leopardi nell’area di studio. Per la stime numeriche, è stata considerata anche la pianura alluvionale del Karnali (c. 100 km2) del Bardia National Park (BNP), 150 km a est. In media, 131 e 175 prede / km2 sono state stimate nelle stagioni asciutte del 2010 e 2011, rispettivamente. Di queste, il 62-63% erano prede selvatiche e il 37-38% domestiche. Nel 2010, il barasingha è stato la preda più abbondante, seguito da chital, macaco, langur, cervo porcino, cinghiale, nilgai e muntjac. Al contrario, nel 2011 il chital è stato la preda più abbondante, seguito da barasingha, macaco, cervo porcino, langur, cinghiale, muntjac e nilgai. 12 e 14 specie preda sono state trovate in 194 campioni fecali di tigre e 42 di leopardo comune, rispettivamente. Le diete di tigre e leopardo comune sono risultate composte da un’ampia quantità di ungulati selvatici (tigre: 77%; leopardo comune: 51%). Le frequenze relative di comparsa degli ungulati selvatici nella dieta è risultata significativamente diversa tra tigre e leopardo. Prede di dimensioni medie, come il chital, sono risultate più frequenti nella dieta della tigre, mentre specie piccole sono comparse più frequentemente nella dieta del leopardo, seguite da specie di dimensioni medie. La tigre ha utilizzato più prede di grandi dimensioni rispetto al leopardo. La sovrapposizione alimentare tra i due felidi è risultata ampia. Entrambi i carnivori sono stati rilevati, mediante camera trapping, più frequentemente di notte che durante il giorno. La tigre ha mostrato una maggiore frequenza di attività diurna rispetto al leopardo comune. Queste differenze nell’uso del tempo potrebbero favorire la coesistenza tra i due felidi. In generale, tra le 11 AM e le 5 PM, il leopardo comune è stato meno attivo della tigre, probabilmente per evitare le fasi più calde del giorno e a causa dell’attività crepuscolare delle sue prede principali.
L’utilizzo di aree circoscritte e la ridotta attività diurna del leopardo comune suggeriscono l’esistenza di segregazione temporale con la tigre.
iv
Il camera trapping ha identificato 11 individui di tigre (6 maschi e 5 femmine) e 9 di leopardo comune (5 maschi e 4 femmine) nella SWR. Le analisi genetiche hanno identificato solo 5 individui di tigre e 4 di leopardo comune nella SWR, oltre a 6 tigri nella pianura del Karnali. La densità di tigri nella SWR è risultata 1.8-2.9 ind/100 km2, mentre quella di leopardi comuni è risultata 1.8-2.6 ind/100 km2. Le dimensioni medie
delle aree familiari (home range, HR) di tigre (n = 9 individui) sono risultate 33.6 km2. Gli HR maschili (43.3 km2) sono risultati 1.45 volte più grandi di quelli femminili (29.9 km2), in media. Per il leopardo comune (n = 7), sono stati stimati HR di 17.9 km2, in media. Gli
HR maschili (26.6 km2) sono stati 2.86 volte più ampi di quelli femminili (9.3 km2). Gli
HR di maschi di tigre hanno sempre mostrato sovrapposizione, talvolta totale. La sovrapposizione tra HR maschili è risultata più alta di quella tra HR femminili; inoltre gli HR di ogni maschio di tigre hanno mostrato sovrapposizione con quelli di più di una femmina. Gli HR dei leopardi hanno mostrato una minore sovrapposizione intra-specifica rispetto a quelli di tigre. Come per la tigre, gli HR di ogni maschio di leopardo hanno mostrato sovrapposizione con quelli di più di una femmina. Una chiara separazione spaziale è stata riscontrata tra tigre e leopardo comune, con una sovrapposizione mediana interspecifica del 12-18%. I leopardi sono risultati maggiormente confinati nelle zone periferiche dell’area di studio, mentre le tigri hanno occupato la porzione centrale, meno disturbata, dell’area. Questa ricerca fornisce i primi dati su tigre, leopardo comune e loro prede nella SWR, durante la stagione asciutta. C’è urgente bisogno di informazioni su patologie (per i grandi carnivori, soprattutto), sul disturbo antropico e sulla disponibilità di prede all’esterno della SWR. Ulteriori informazioni sono necessarie sulle relazioni predatore-preda, analizzando anche l’uso delle aree di corridoio ecologico, che fungono da connessione tra le piccole aree protette nella fascia esterna alla SWR.
v ACKNOWLEDGEMENTS
Since the first moment of this research my academic supervisor Prof. Leonida Fusani, Department of Biology and Evolution, University of Ferrara and co-supervisor Prof. Sandro Lovari, Dipartimento di Scienze della Vita, Università di Siena for providing me excellent scientific guidance and supervision throughout my study period. Indeed, their contribution was invaluable and for this reason I would like to express my sincere gratitude. I would also like to thank co-supervisor Dr. Shant Raj Jnawali (then Director, NTCN), Biodiversity Coordinator, Hariyo Ban WWF Nepal for his guidance and encouragement throughout my field work and write up.
This research would not have been accomplished without the PhD position opportunity that was given by the University of Ferrara and the economic support of the Ministero dell'l Ministero dell'Istruzione, dell'Università e della Ricerca (MIUR), that was a three-year scholarship; therefore both of them are greatly acknowledged. Moreover, I am indebted to the Department of National Park and Wildlife Conservation (DNPWC) for the continuous support and for allowing me to conduct this study. In more particular, I would like to thank Mr. Gopal P. Upadhaya (then Director General), and Mr. Krishan Acharya (then Director General), Mr. Megh B. Pandey, Director General and Dr. Maheshwar Dhakal, Ecologist and Dr. J.B. Karki, Chief Warden Banke NP.
I would like to sincerely thank Prof. Guido Barbujani, Coordinator of the PhD program who has always been supportive and very helpful since the first day of my doctorate study. Prof. Augusto Foà , Prof. G. Grandi, Prof. Cristiano Bertolucci, Prof. Giorgio Bertorelle, Prof. Silvia Fuselli and Dr. Virginie Canoine are also acknowledge for their help, encouragement and cooperative during the PhD course.
I would like to thank the National Trust for Natural Conservation (NTNC) for providing me a leave for higher education, and support during the field work in Nepal and in more particular Mr Bimal Kumar Baniya (Then Member secretary), Mr. Juddha Gurung, Member Secretary, NTNC, Mr. Ganga J. Thapa, Executive Officer, Mr. J. R. Onta, Director Finance, Mr. Deepak K. Singh, Director Administration and Mrs. Sarita Jnawali, Project Manager, Central Zoo for their continue support and encouragement throughout my study period.
vi
I owe sincere and earnest thankfulness to Prof. Per Wegge (University of Life Science, Ås, Norway) for his helpful edits and for concrete comments on the thesis, and I am grateful to Dr. Alexander S. Anderson, Mr. Ben Morrison and Mr. Komal Sharma for their great help during the thesis write up. I gratefully acknowledge Prof. Torstein Storaas, Mr.
Håkon Solvang
and Mr. Mikkel Kvasnes from Hedmark University College, Norway for helping with distance sampling analysis. I am grateful to Mr. DibeshKarmacharya from CMDN, Prof. E. Randi and Dr. N. Mucci from ISPRA/INFS for
helping with genetic analysis. I would also like to thanks Professor Lorenzo Fattorini from the Siena University for statistical work and discussion on the data, Dr. Francesco Ferretti for his help during staying in Siena and also for translation my thesis abstract into Italian language, Dr. Isabelle Minder, Dr. Anna Bocci and other friends from Siena University for their suggestions, help and encouragement.
I would like to offer my special thanks to Mr. Jaga Nath Singh (then Chief warden, SWR), Mr. Ubraj Regmi, Chief Warden, Shuklaphanta Wildlife Reserve (SWR), Mr. Keshor Mehata and Mr. Chandra Bd. Chand Asst. Wardens, Mr Karna Bd, Bom, Vet, asst, S. Game scout M.D. Bhatta, Lilam Thakur, S. Negi, and all the staff from SWR including elephant staff for their great contribution in the field. My special thanks are extended to Mr. Tikaram Adhikari, Chief Warden BNP and Asst. Warden Mr. Ramesh Thapa for their great support and being always supportive during my field work in Barida.
I wish to acknowledge the help provided by NTNC-SCP throughout my filed work. My special thanks are extended to the whole team from SCP including Mr. Hemanta K. Yadav, Project Chief NTNC-SCP, Mr. Suman Malla, Mr. Hira Chettri, Mr. Pamananda Garga, Mr. Raju Chaudhary, Mr. Parmod Subedi, Mr. Dev R. Joshi, Ms. Geeta Choudhary, Mr. Jog R. Rana, Mr. Hari Choudhary, Mr. T. Badu, Mr. Ganesh Rana, Mr. O.P. Choudhary for their incredible support during my fieldwork.
I would like to thanks especially WWF Nepal and international for the travel support provided during my first trip to the university and for the final exam. I am particularly grateful for the partial travel support given by Awely (Mr. Renaud Fulconis, Executive Director, France) during the third year and CCF (Dr. Deborah Mccauley and
vii
Prof. Gretchen Kaufman, USA) for living and other expenses for the period of final exam. I would like to offer my special thanks to Mr. Anil Manandhar (WWF Nepal, CR), Dr. Ghana Shyam Gurung (Director) Mr. Shiv Raj Bhatta (Deputy Director), Mr. Santosh Nepal (Director), Dr. Bivash Pandav (then WWF International) WII India, Dr. Narendra B. Pradhan, Dr. R. Shrestha (WWF Canada) and Mr. Shubash Lohani (WWF US) for provided me with valuable support during my study period. Assistance provided by Ms. Bunu Vaidya, Ms. Sabital Malla, Mr. Pradeep Khanal, Mr. Gokarna J. Thapa was greatly appreciated.
My special thanks are extended to the staff of BCP, particularly Mr. Rabin Kadariya, Project Chief NTNC-BCP, Mr. Bintiram Tharu, Mr. Phiru Lal, Mr. Shree R. Ghimire and Mr. Ramji B. Thapa for their kind support during the field work in Bardia. I am truly indebted and thankful to Dr Kamal Gaira (S. Vet. Officer, CNP), Mr. Purshutam Pandey (vet. Asst. BNP), Chief Wildlife technician for NTNC-BCC, Mr. Bishnu Lama, including senior Wildlife technicians Mr. Harka Lama and Mr. Man Badhur dai, Mr. Nandu Acharya (Wildlife Technician) and Mr. Tirtha Lama (J. Wildlife Technician) for their kind support and being good team during the field work in Shuklaphanta specially when we were trying to put satellite collar on tigers.
I am grateful to my friend Mr. Naresh Subedi, NTNC-BCC, Project Chief also a PhD fellow at Wildlife Institute of India for his wonderful support in all aspect. Also like to extend my thanks to Mr. Ram Kumar Aryal (Admin. Officer-BCC) for his regular support and encouragement. Mr. Babu Ram Lamachanna (Conservation Officer-BCC) and Mr. Bishnu Thakuri for helping on preparing maps.
I wish to thank all the staffs and my colleagues from the Department of Biology and Evolution, University of Ferrara and the Doctoral School Office for their cooperation and help, I am particularly grateful for the help given by Dr. Lena Fabbri. I also wish to thanks Dr. Tej Bd Thapa (Central Department of Zoology, Nepal), Dr. Hem Sagar Baral (Himalaya Nature), Dr. C.M. Sharma (Kathmandu University), Mr. Kanchan Thapa (PhD fellow at the Univ. of Virginia Tech.) for their help and encouragement.
Thanks to my great friends whom I met the first day of my PhD study in Italy, Dr. Ahmed Rjoob, Dr. Sboras Sotiris and Dr. Thenesh Sathiyaseelan for taking care me like brother, their help and encouragement was one of the sources for the success of this
viii
study, other great friends who help me in different ways during the course of study including Dr. Abdul Haseeb, Mr. Parviz Holakooel, Dr. Mahmood Ali, Dr. Bellal Abuhelaleh, Mr. Rishikanta S. Ngangbam, Ms. Joice Sophia, Ms. Ika Riswanti Putranti, Mr. Naresh Rana, Ms. Kiki Lordanidou, Ms. Annie Sasani, Dr. Awad Abbas, Mr. Arash
Sattar, Dr. Khalil Allahyari, Mr. Hamed Salem, Dr. Angela Pluchinotta, Dr. Silvietta Ghirotto, Dr. Andrea Benazzo, Dr. Giulia Beltrami, Ms. Alice Lui and Ms. Simona Granatiero. Thanks to all the friends I met in Il Cenacolo for their good company and friendship. I am grateful to my friends from Norway Mr. Per Øyvind Heggdal and Mr. Rune FrØyland for their visit in Italy during my course and for their encouragement.
I would like to acknowledge all my family members and relatives for their love and encouragement. Special thanks goes to my dear mother for her constant support and love. I would also like to thanks to my father, although he is no more with us, for taught me the importance of the education. Thank to my dearest wife, Sulochana and son, Ayushman for their patience, love and encouragement throughout the study period.
ix CONTENTS Page ABSTRACT ... i ACKNOWLEDGMENTS ... .. v CONTENTS ... ix LIST OF TABLES ... .. xi
LIST OF FIGURES ... .. xii
CHAPTER 1 1. INTRODUCTION ... 1 1.1. AIMS... 8 1.2. REFERENCES... 9 CHAPTER 2 2. STUDY AREA ... 14
2.1. SHUKLAPHANTA WILDLIFE RESERVE... 14
2.1.1. LOCATION ... 15
2.1.2. GEOLOGY AND SOIL... 15
2.1.3. CLIMATE... 16
2.1.4. VEGETATION ... 17
2.1.5. FAUNA... 18
2.2. INTENSIVE STUDY AREAS ... 19
2.3.REFERENCES... 22
CHAPTER 3 3. PREY SELECTION OF TIGERS AND COMMON LEOPARDS... .. 23
ABSTRACT ... 24
3.1. INTRODUCTION ... 25
3.2. MATERIAL AND METHODS ... 29
3.3. RESULTS... 36
3.4. DISCUSSION ... 44
x CHAPTER 4
4. ACTIVITY PATTERNS OF TIGERS AND LEOPARDS... 57
ABSTRACT ... 58
4.1. INTRODUCTION ... 59
4.2. MATERIAL AND METHODS ... 62
4.3. RESULTS... 66
4.4. DISCUSSION ... 72
4.5. REFERENCES ... 75
CHAPTER 5 5. SPATIAL BEHAVIOUR OF TIGERS AND LEOPARDS... 79
ABSTRACT ... 80
5.1. INTRODUCTION ... 81
5.2. MATERIAL AND METHODS ... 85
5.3. RESULTS... 92
5.4. DISCUSSION ... 102
5.5. REFERENCES ... 108
CHAPTER 6 6. CONSERVATION AND MANAGEMENT... 116
6.1. CONCLUSIONS ... 117
6.2. RECOMMENDATIONS ... 119
6.3. REFERENCES ... 121
xi LIST OF TABLES
Table Page
Table 1.1. Subspecies of tigers and their region... ... 3 Table 1.2. Subspecies of leopards and their region... ... 5 Table 3.1. Estimated group and individual densities of prey species between
March-May 2010... ... 36 Table 3. 2.Estimated group and individual densities of prey species between
February and April 2011... 36 Table 3.3. Prey species frequency of occurrence, relative occurrence and
percentage of volume for tigers... 38 Table 3.4. Prey species, average body weight, correction factor, estimated relative
biomass consumed and estimated relative number of prey individuals of tigers.... 39 Table 3.5. Standardized Levin’s index of trophic niche breadth and Pianka’s index of trophic
niche overlap of the tiger and the leopard, based on relative occurrence and
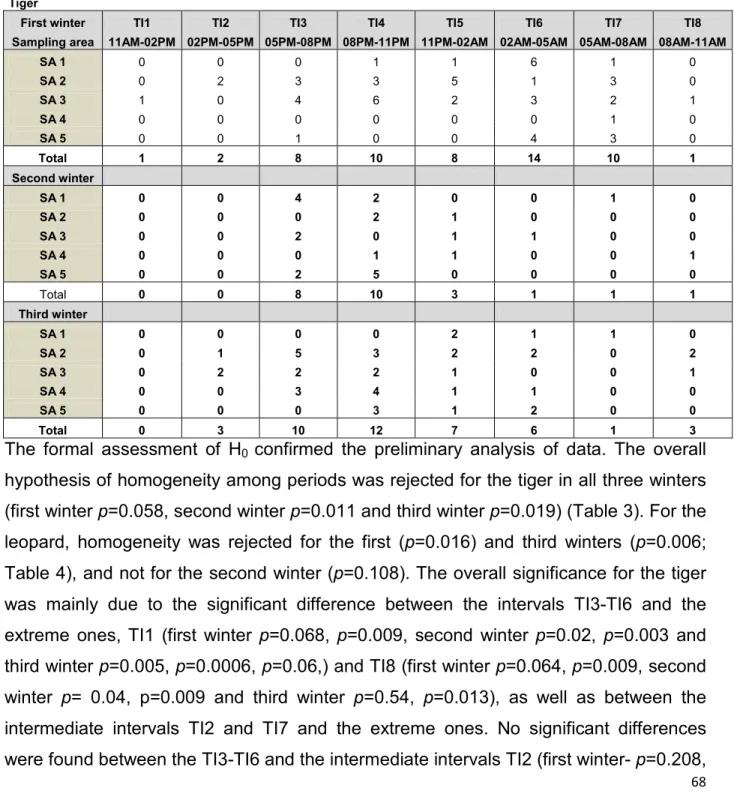
estimated volume... 41 Table 4.1. Total number of tiger photo events recorded in each sampling area for each time
interval during three consecutive winters... ... 68 Table 4.2. Total number of leopard photo events recorded in each sampling area for each
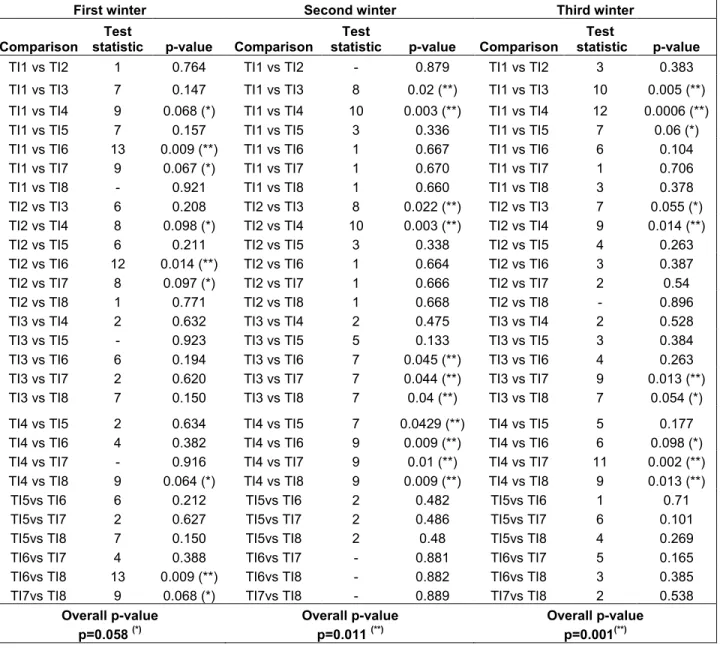
time interval during three consecutive winters... ... 69 Table 4.3. Differences between the number of total photos recorded in each pair
of time intervals and their corresponding p-values achieved on the basis
of 10,000 permutations of data in Table 4.1. (Tiger)... ... 70 Table 4.4. Differences between the number of total photos recorded in each pair
of time intervals and their corresponding p-values achieved on the basis
of 10,000 permutations of data in Table 4.2. (Leopard)... ... 71 Table 5.1. The mean maximum distance moved, effective area sampled by
camera trapping, minimum numbers and estimated tiger and leopard
densities recorded during 3 successive winter in SWR, Nepal... ... 92 Table 5.2. Putative home ranges, estimated by the 100% minimum convex polygon
for tigers and leopards in SWR during 2009-2011... ... 94 Table 5.3. Home range overlap within and between species... ... 96 Table 5.4. Home range within species (median and quartile overlaps)... ... 97
xii LIST OF FIGURES
Figure Page
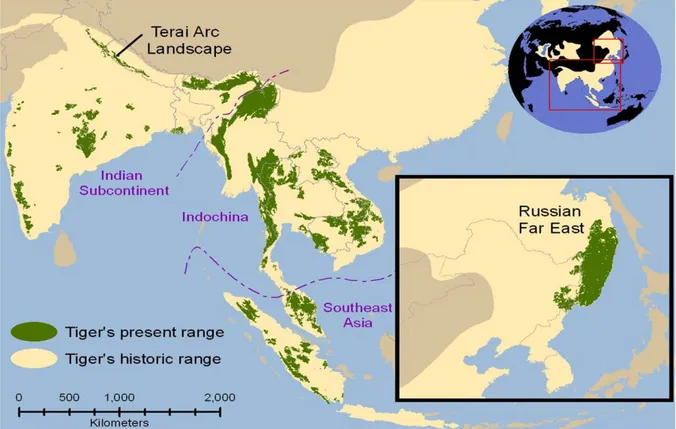
Figure 1.1. Historic and present range of tigers... 4
Figure 1.2. Historic and present range of leopards... 4
Figure 2.1. Map showing the Shuklaphanta Wildlife Reserve... 14
Figure 2.2. Mean monthly rainfall (a), relative humidity (b) and temperature (c) for 12 years from 1999 to 2010... 16-17 Figure 2.3. Map showing the intensive study area in SWR... 19
Figure 2.4. Map showing Bardia National Park and the intensive study area... 20
Figure 3.2. Map showing the line transects and blocks in the study area... 30
Figure 3.3. Estimated volume of tiger and leopard prey species versus their frequency of occurrence Isopleths connect points of equal relative volume in the overall diet.. 40
Figure 3.4. Comparison of the tiger and the leopard diets during the dry season... 40
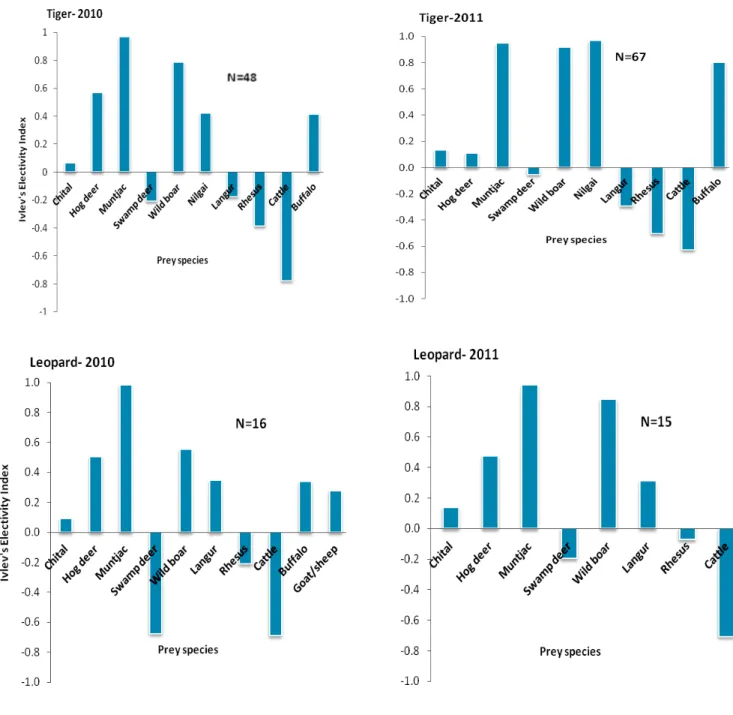
Figure 3.5. Prey selection by tigers and leopards (dry season)... 42
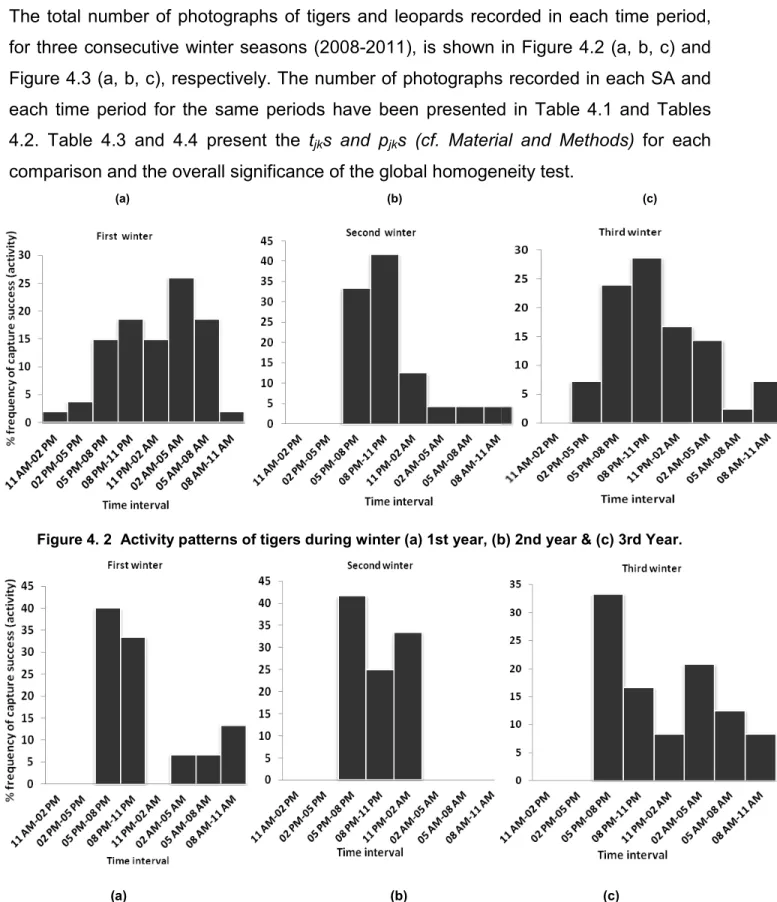
Figure 4.2. Activity patterns of tigers during winter... 66
Figure 4.3 . Activity patterns of leopards during winter... 66
Figure 4.4. Activity patterns of tigers & leopards during the period of three winters in SWR.. 67
Figure 5.1. Camera trapping locations in the study area... 86
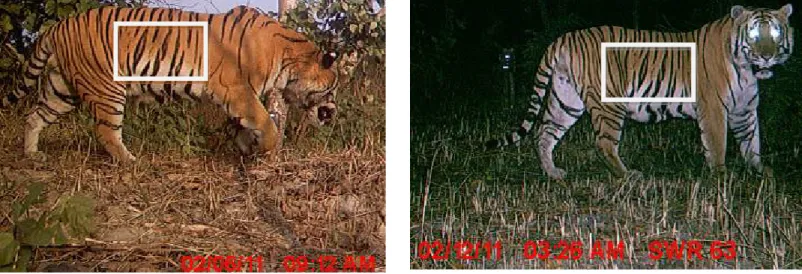
Figure 5.2 (a) Camera-trap photographs of the same male tiger from different locations, showing similar stripe patterns. (b). Camera-trap photographs of two different female tigers, showing differences in stripe patterns. (c). Camera-trap photographs of two different leopards, showing differences in body spot/mark patterns... 87
Figure 5.3. Number of individual tigers and leopards photographed in different winters... 92
Figure 5.4. Tiger and leopard home range size... 94
Figure 5.5. Tiger and leopard home range overlap... 95
Figure 5.6. Winter home ranges of male tigers (2009-2011)... 98
Figure 5.7. Winter home ranges of female tigers (2009-2011)... 99
Figure 5.8. Winter home ranges of male leopards (2009-2011)... 100
1
CHAPTER 1
2
CHAPTER 1
1. INTRODUCTION
Large mammalian carnivores are normally susceptible to landscape change because of their low population density, inadequate resources of habitat requirements, prey base, which is greatly dominated by human influences, and other trails that decreases ecological resilience (Weaver et al. 1996). Their conservation is one of the most challenging tasks for conservationists globally. Large carnivores received a high proportion as the most focal species for conservation due to because the position they occupy in ecosystem. Their foraging, spatial behaviour and distribution patterns often strongly reflect in the landscape level of conservation. Large carnivores with large area requirement are considered as umbrella species, on the assumption that the area of habitat requirement to support a viable population will protect sufficient habitat for other numerous co-occurring species with smaller area requirements (Noss et al. 1996). In the ecological studies, large carnivores such as tigers and leopards are the most vital components, where these species are sympatric in similar habitats, serving as umbrella species across a wide range of habitats and are functionally important components of the ecosystem.
The tiger Panthera tigris is the largest felid in the world it is extremely endangered globally, whereas the leopard Panthera pardus is 3 to 4 times smaller in body size (Seidensticker 1976) and is also declining in abundance. Both these large predators are sympatric in many parts of their distributional ranges in Asia. They are important species within their ecosystems; the tiger is considered as the top predator and the leopard the co-predator in the area. Due to poaching, prey depletion and habitat destruction, they are now mostly restricted to protected habitats (PAs and some outside PAs). Owing to above reasons, three sub-species, the Bali tiger Panthera tigris balica, the Caspian tiger Panthera tigris virgata and the Javan tiger Panthera tigris sondaica have already become extinct from the wild (Table 1.1). The tiger occurs over a wide range of geographical regions, from tropical forests of southern Asia to the temperate and boreal forests of the Russian Far East (Figure1.1). However this distribution has
3
been reduced significantly over the last century with the growth of the human population (Sunquist, Karanth & Sunquist 1999, Schaller 1967). Currently, tigers survive in fragmented population in thirteen countries (Bangladesh, Bhutan, Cambodia, China, India, Indonesia, Lao PDR, Malaysia, Myanmar, Russia, Thailand and Vietnam) including Nepal. At present the species occupies 40% less habitat than a decade ago, and only 7% of their historic range, and is estimated at around 3000-3500 individuals (Dinerstein et al. 2006, Sanderson et al. 2006). Initially, eight subspecies had been characterized based on physical characteristic and geographical distribution (Herrington 1987, Nowell & Jackson 1996). Of these eight, only five were known to exist in the wild (Weber & Rabinowiz 1996). Recently, Luo et al. (2004) described that six existing subspecies of tigers have been identified on the basis of distinctive molecular markers (Luo et al. (2004) cited in IUCN, 2012) (Table 1.1).
Table 1.1. Subspecies of tigers and their region
Subspecies Region
Amur Tiger Panthera tigris altaica Russian Far East & northeastern China Northern Indochinese Tiger P. t. corbetti Indochina north of the Malayan peninsula Malayan Tiger P. t. jacksoni Peninsular Malaysia
Sumatran Tiger P. t. sumatrae Sumatra
Bengal Tiger P. t. tigris Indian sub-continent
South China Tiger P. t. amoyensis (This subspecies has not been directly observed in the wild since 1970s and is possibly extinct)
Three subspecies previously recognized on the basis of morphology are extinct: Bali Tiger P. t. balica Schwarz, 1912 Bali
Javan Tiger P. t. sondaica (Temminck, 1844) Java
Caspian Tiger P. t. sondaica (Illiger, 1815) Dry river valleys of the Takla Makan, Western slope of the Tianshan mountains, Amudarya and Syrdarya river valleys, shores of the Caspian sea, Elburz mountains, eastern Turkey, Tigris and Eupharates river valleys.
4 Source: http://www.picture-of-cats.org/Leopard-Habitat.htm
Source: http://upload.wikimedia.org/wikipedia/commons/c/c8/Tiger_map.jpg Figure 1.1. Historic and present range of tigers
5
Leopard is the most widespread member of the large felids (Myers, 1986) being existent throughout Asia, Africa, the Middle East and South Eastern Europe (Bailey 1993, Nowell & Jackson 1996, Uphyrkina et al. 2001) (Figure 1.2). Nevertheless, they are declining in large parts of their range due to habitat loss and fragmentation, and hunting for trading and pest controlling reasons. Because of their extensive distribution, ecological flexibility and cryptic habits, the leopard has so far received little scientific consideration. Leopards are found widely in the forests of the Indian sub-continent, through Southeast Asia and into China, although they are becoming increasingly rare outside protected areas. Regardless of conservation efforts, the populations of both species (tigers and leopards) are known to be declining throughout their ranges. According to genetic analysis, nine subspecies of leopard are recognized, with all continental African leopards attributable to the nominate form (Miththapala et al. 1996, Uphyrkina et al. 2001 cited in IUCN 2012) (Table 1.2).
Table 1.2. Subspecies of leopards and their region
Source: IUCN 2012
Subspecies Region
Panthera pardus pardus (Linnaeus, 1758) Africa
Panthera pardus nimr (Hemprich & Ehrenberg, 1833) Arabia
Panthera pardus saxicolor (Pocock, 1927) Central Asia
Panthera pardus melas (Cuvier, 1809) Java
Panthera pardus kotiya (Deraniyagala, 1956) Sri Lanka
Panthera pardus fusca (Meyer, 1794) Indian sub-continent
Panthera pardus delacourii (Pocock, 1930) Southeast Asia into southern China
Panthera pardus japonensis (Gray, 1862): Northern China
Panthera pardus orientalis (Schlegel, 1857): Russian Far East, Korean peninsula and
north-eastern China
The recognition of P. p. melas and P. p. nimr was based on very small sample sizes and is considered tentative. Based on morphological analysis, Khorozyan et al. (2006) recognize P. p. tulliana (Valenciennes, 1856) in western Turkey and P. p. sindica (Pocock, 1930) in Pakistan, and possibly also parts of Afghanistan and Iran. They also consider P. p. ciscaucasica (Satunin, 1914) as the senior synonym for P. p. saxicolor.
6
More studies on leopards have been carried out in African region (e.g. Hamilton 1976, Bertran 1982, Bailey 1993, Jenny 1996, Bothma et al. 1997, Stander et al. 1997, Mizutani and Jewell 1998) compare to other places of their range. The few studies on leopards in the Indian sub-continent usually come from studies that are focused on tigers (Seidensticker 1976, Sunquist 1981, Karanth and Sunquist 1995, Wegge et al. 2009, Odden and Wegge 2005).
In Nepal, tigers can be found only in lowland Terai PAs with just few animals recorded outside PAs, whereas leopards can be found in all the protected areas in the lowland and also outside protected areas, in the lowland Terai and in highland protected areas (for example in Sagarmatha National Park, Lovari, et al 2009).
This study addresses the ecology and conservation of these sympatric carnivores in one densely settled area situated within the Terai Arc Landscape of Nepal. The main problems of wildlife conservation in Nepal is poaching and the conversion of tropical forest habitat to a human-dominated landscape through illegal encroachment for settlements and agriculture. Given that carnivore ecology is largely governed by their prey, understanding the feeding ecology and behavioural flexibility of felids in prey selection is essential for addressing their conservation requirements (Sunquist & Sunquist 1989, Seidensticker & McDougal 1993). However, the mysterious, solitary and nocturnal habits of tigers and leopards, along with their wide-ranging movements, have limited our knowledge of their feeding ecology and how this may diverge under varying environmental circumstances (Sunquist 1981). Recent studies on the food habits of tigers and leopards show that these felids have substantial dietary overlap (Andheria et
al. 2007, Wang and Macdonald 2009, Wegge et al. 2009), with both species preying on
large as well as small-sized ungulates (Johnsingh 1983, Karanth and Sunquist 1995, Sankar and Johnsingh 2002, Ramesh et al. 2009). This probably leads to competition for prey and therefore each cat species can affect prey availability for the other species.
7
Ecologically similar and closely related species in sympatry may differ in their activity patterns to avoid interspecific encounter competition. Activity patterns of large sympatric carnivores are influenced by prey availability (Zielinski et al. 1983, Karanth & Sunquist 2000), seasonal variation in prey abundance (Lourens and Nel 1990; Zub et al. 2009), human disturbance (Beckmann and Berger 2003; Griffiths and Schaik 1993, Kolowski et
al. 2007), interspecific competition (Hayward and Slotow 2009, Hunter and Caro 2008,
Romero-Muñoz et al. 2010) and intra-guild predation (Palomares and Caro 1999). The knowledge of activity patterns provides a scientific basis for the development of conservation plans for endangered species (Hwang and Garshelis 2007), such as tigers and leopards. In Nepal activity patterns of carnivores have not been studied extensively. Activities of particularly elusive, nocturnal animals are often difficult to assess without the use techniques such as radio telemetry or camera traps. The only studies of activity patterns of large carnivores in Nepal are from Bardia National Park (common leopard: Odden & Wegge, 2005) and Chitwan National park (tigers and leopards: Seidensticker 1976; tiger: Sunquist 1981).
Whenever the ecology of these species is poorly understood, and population dynamics are not carefully considered, conservation resources are likely to be poorly allocated. Complete counts of carnivore populations are often impractical, expensive, and time-consuming (Balme et al. 2009). However, reliable estimates of population trends are critical for their conservation as they play an important role in providing standardized data for future management decisions. In addition, home range is the fundamental measure of space use by territorial animals, such as tigers and leopards. Species have their intra-sexual restricted territories with one to several females residing inside one male's territory (McDougal, 1977). Competition for mates is the proximate factor determining male territoriality, whereas food, cover and a secure place to raise young are the critical resources for which females will complete, these factors thus playing an important part in determining animal population densities (Sunquist 1981). In Nepal, most studies of the behavioural ecology and home range use of tigers and leopards have been conducted in Chitwan and Bardia National Parks using radio telemetry (Seidensticker 1976, Sunquist 1981, Smith 1984, Wegge et al. 2009, Odden and
8
Wegge 2005). Similar studies have also been carried out in India (Karanth and Sunquist, 1995, 2000) and Thailand (Rabinowitz, 1989, Grassman, 1999). However, no such studies have been conducted in the Shuklaphanta Wildlife Reserve (henceforth SWR) in the far western lowland Terai of Nepal.
1.1. AIMS
This study aims at gathering information on the population and behavioural ecology of tigers and leopards in the SWR in lowland Terai of Nepal, in order to support site-specific conservation and management policies. The study objectives are: (a) to analyse the prey selection of tigers and leopards in SWR using scat analysis and distance sampling of prey; (b) to quantify the activity patterns of these two sympatric carnivores, using camera traps; and (c) to identify the present status of tigers and leopards in SWR and to describe their spatial behaviour using noninvasive techniques such as camera trapping and genetic analysis of their scats. For the scat genetics part, samples from the Karnali floodplain area of Bardia National Park were also included.
9 1.2. REFERENCES
Andheria, A. P., Karanth, K. U. and Kumar, N.S. 2007. Diet and prey profiles of three sympatric large carnivores in Bandipur Tiger Reserve, India. Journal of Zoology 273:
69-175.
Bailey, T. N. 1993. The African leopard: ecology and behavior of a solitary felid. New York: Columbia University Press, NewYork.
Balme, G.A., L.T.B, Hunter and R. Slotow. 2009. Evaluating methods for counting cryptic carnivores. Journal of Wildlife Management 73: 433-441.
Beckmann, J.P and Berger, J. 2003. Rapid ecological and behavioural changes in carnivores: the responses of black bears (Ursus americanus) to altered food. Journal of
Zoology 261: 207-212.
Bertram, B. C. R. 1982. Leopard ecology as studied by radio tracking. Symp. zool. Soc. Lond:341-352.
Bothma, J. Du P., Knight, M. H., le Riche, E. A. N. & Van Hensbergen, H. J. 1997. Range size of Kalahari leopards. South African Journal of Wildlife Research 27: 94-99.
Dinerstein E, Louks C, Heydlauff A, Wikramanayake E, Bryja G, Forrest J, Ginsberg J, Klenzendorf S. Leimgruber P, O’Brien T, Sanderson J, Seidensticker & Songer M. 2006.
Setting Priorities for the conservation and recovery of wildlife tigers: A user’s guide.
2005-2015. WWF, Smithsonian, STF (Ed.).
Grassman, L.I. 1999. Ecology and behavior of the Indochinese leopard in Kaeng Krachan National Park, Thailand. Natural History Bulletin of the Siam Society 47: 77–
93.
Griffiths, M. and Schaik, C.P.V. 1993. The impact of human traffic on the abundance and activity periods of Sumatran rain forest wildlife. Conservation Biology 7: 623-626.
Hamilton, P. H. 1976. The movements of leopards in Tsavo National Park, Kenya, as determined by radio-tracking. University of Nairobi.
Hayward, M.W. and Slotow, R. 2009. Temporal Partitioning of Activity in Large African Carnivores: Tests of Multiple Hypotheses. South African Journal of Wildlife Research
39: 109-125.
Herrington, S.J. 1987. Subspecies and the conservation of Panthera tigris: preserving genetic heterogencity. Pp. 51-63 in R.L. Tilson and U.S. Seal, eds. Tigers of the world:
the biology, biopolities, management, and conservation of an endangered species.
10
Hunter, J and Caro, T. 2008. Interspecific competition and predation in American carnivore families. Ethology Ecology & Evolution 20: 295-324.
Hwang, M.H. and Garshelis, D.L. 2007. Activity patterns of Asiatic black bears (Ursus
thibetanus) in the Central Mountains of Taiwan. Journal of Zoology 271: 203–209.
Jenny, D. 1996. Spatial organization of leopards Panthera pardus in Tai National Park, Ivory Coast: Is rain forest habitat a 'tropical haven'? Journal of Zoology 240: 427-440.
Johnsingh, A.J.T. 1983. Large mammalian prey-predator in Bandipur. J. Bombay Nat.
Hist. Soc. 80: 1-57.
Karanth, K.U. and Sunquist, M. E. 1995. Prey selection by tiger, leopard and dhole in tropical forest. Journal of Animal Ecology 64: 439-450.
Karanth, K.U. and Sunquist, M.E. 2000. Behavioural correlates of predation by tiger (Panthera tigris), leopard (Panthera pardus) and dhole (Cuon alpinus) in Nagarahole, India. J. Zool. 250: 255-265.
Kolowski, J.M., Katan, D., Theis, K.R., Holekamp, K.E. 2007. Daily patterns of activity in the spotted hyena. Journal of Mammalogy 88: 1017-1028.
Lourens, S., Nel, J. 1990. Winter activity of bat-eared foxes Otocyon megalotis in the Cape West Coast. South African Journal of Zoology 25: 124-132.
Lovari S, R. Boesi, I. Minder, N. Mucci, E. Randi, A. Dematteis and S.B. Ale. 2009. Restoration a keystone predator may endanger a prey species in a human-altered ecosystem: the return of the snow leopard to Sagarmatha National Park. Animal
Conservation 12: 559–570.
Luo, S.J., Kim,J.H., Johnson,W.E., Walt, J.vd., Martenson, J., Yuhki, N., Miquelle, D.G., Uphyrkina, O., Goodrich, J.M., Quigley, H.B., Tilson, R., Brady, G., Martelli, P., Subramaniam, V., McDougal, C., Hean, S., Huang, S.Q., Pan, W., Karanth, U.K., Sunquist, M., Smith, J.L.D., O'Brien, S.J. 2004. Phylogeography and Genetic Ancestry of Tigers (Panthera tigris). PLoS Biol 2(12): e442. doi:10.1371/journal.pbio.0020442
McDougal C. 1977. The face of the tiger. Rivington Books, London.
Miththapala, S., Seidensticker, J. and O'Brien, S. J. 1996. Phylogeographic Subspecies Recognition in Leopards (Panthera pardus): Molecular Genetic Variation. Conservation
Biology 10: 1115–1132. doi: 10.1046/j.1523-1739.1996.10041115.x
Mizutani, F. & Jewell, P. A. 1998. Home-range and movements of leopards on a livestock ranch in Kenya. Journal of Zoology, London 244: 269-286.
11
Myers, N. 1986. Conservation of Africa’s cats: problems and opportunities. In Cats of
the world: 437-457. Miller, S.D. & Everett, D.D. (Eds). Washington, DC: National Wildlife
federation.
Noss, R.F., H.B. Quigley, M.G. Hornocker, T. Merrill, and P.C. Paquet. 1996. Conservation biology and carnivore conservation in the Rocky Mountains. Conservation
Biology 10: 949–963.
Nowell, K. and Jackson, P. 1996. Wild cats: status, survey and conservation action
plan. Gland, Switzerland: IUCN/Species Survival Commission Cat Specialist Group.
Odden, M and Wegge, P. 2005. Spacing and activity patterns of leopards Panthera pardus in the Royal Bardia National Park, Nepal. Wildlife Biology 11: 145–152.
Palomares, F., Caro, T.M. 1999. Interspecific Killing Among Mammalian Carnivores.
The American Naturalist 153: 492-508.
Rabinowitz, A.R. 1989. The density and behaviour of large cats in a dry tropical forest in Huai Kha Khaeng Wildlife Sanctuary, Thailand. J. Nat. Hist. Soc. Bull. Siam. Soc. 37:
235-251.
Ramesh, T., Snehalatha, V., Sankar, K. and Qureshi Q. 2009. Food habits and prey selection of tiger and leopard in Mudumalai Tiger Reserve, Tamil Nadu, India. J. Sci.
Trans. Environ. Technov. 2 (3): 170-181.
Romero-Muñoz, A., Maffei, L., Cuéllar, E., Noss, A.J. 2010. Temporal separation between jaguar and puma in the dry forests of southern Bolivia. Journal of Tropical
Ecology 26: 303-311.
Sanderson, E., J. Forrest, C. Loucks, J. Ginsberg, E. Dinerstein, J. Seidensticker, P. Leimgruber, M. Songer, A. Heydlauff, T. O’Brien, G. Bryja, S. Klenzendorf, and E. Wikramanayake. 2006. Setting priorities for the conservation and recovery of wild
tigers: 2005-2015. The technical assessment. WCS, WWF, Smithsonian, and
NFWF-STF, New York - Washington, D.C.
Sankar, K. and Johnsingh, A.J.T. 2002. Food habits of tiger (Panthera tigris) and leopard (Panthera pardus) in Sariska Tiger Reserve, Rajasthan, India, as shown by scat analysis. Mammalia, 66: 285-289.
Schaller, G. B. 1967. The deer and the tiger. Chicago: University of Chicago Press. Seidensticker, J. 1976. On the ecological separation of tigers and leopards. Biotropica 8 (4): 225-234.
Seidensticker, J. and C. McDougal. 1993. Tiger predatory behaviour, ecology and conservation. Symp. Zool. Soc. London, 65: 105-125.
12
Smith, J. L.D. 1984. Dispersal, communication, and conservation strategies for the tiger (Panthera tigris) in Royal Chitawan National Park, Nepal. Ph.D. dissertation, University of Minnesota, Minneapolis.
Stander, P.E., Haden, P. J., Kaqece & Ghau, X. 1997. The ecology of asociality in Namibian leopards. Journal of Zoology, London 242: 343-364.
Sunquist, M.E. 1981. The social organisation of tigers (Panthera tigris) in Royal Chitwan National Park. Smithson. Contrib. Zool. 336: 1-98.
Sunquist, M.E. and Sunquist, F.C. 1989. Ecological constraints on predation by large Felids. In: Carnivore Behaviour, Ecology and Evolution. Gittleman, J. L. (Ed.), New York: Chapman and Hall. P. 283-301.
Sunquist, M.E., Karanth, K.U and Sunquist, F.C. 1999. Ecology, behaviour and resilience of the tiger and its conservation needs. In: Riding the tiger: tiger conservation in human dominated landscapes: 5-18. Seidensticker, J., Christie, S. & Jackson, P. R. (Eds). London: Cambridge University Press.
Uphyrkina, O., Johnson, W.E., Quigley, H., Miquelle, D., Marker, L., Bush, M., O’Brian, S.J., 2001. Phylogenetics, genome diversity and origin of modern leopard, Panthera
pardus. Molecular Ecology 10: 2617–2633.
Wang, S.W. and Macdonald, D.W. 2009. Feeding habits and niche partitioning in a predator guild composed of tigers, leopards and dholes in a temperate ecosystem in central Bhutan. Journal of Zoology, 277: 275-283.
Weaver, J. L., P.C. Paquet, and L.F. Ruggiero. 1996. Resilience and conservation of large carnivores in the Rocky Mountains. Conservation Biology 10: 964–976.
Weber, W. and A. Rabinowitz. 1996. A global perspective on large carnivore conservation. Conservation Biology 10: 1046–1054.
Wegge, P., Odden. M., Pokheral, C.P. and Storaas, T. 2009. Predator-prey relationships and responses of ungulates and their predators to the establishment of protected areas: a case study of tigers, leopards and their prey in Bardia National Park, Nepal. Biol. Conserv. 142: 189-202.
Zielinski, W.J., Spencer, W.D., Barrett, R.H. 1983. Relationship between Food Habits and Activity Patterns of Pine Martens. Journal of Mammalogy 64: 387-396
Zub, K., Szafrańska, P.A., Konarzewski, M., Redman, P., Speakman, J.R. 2009. Trade-offs 140 between activity and thermoregulation in a small carnivore, the least weasel Mustela nivalis. Proceedings of the Royal Society B: Biological Sciences 276:
13
CHAPTER 2
15 2.1.1. Location
The Shuklaphanta Wildlife Reserve is located in the Kanchanpur district the southwestern corner of the far western Terai region in the west most area of Nepal. It is located between 280 45’ 16’’ and 280 57’ 23’ N and 800 06’ 04’’ and 800 21’ 40’’ E. The
reserve is generally a flay plane with elevation ranging from 90m to 300 m above mean Sea level. It is bordered to the east and west by the rivers Syali and Mahakali, respectively. The northwestern adjoins the agricultural land settlements of Bhimdutta Municipality. The northeastern boundary follows the Mahendra-Highway and the crest of the churia hills. The southern and western boundary adjoins agricultural land and the international border between Nepal and India. The reserve is surrounded by a Buffer
Zone (BZ) covering an area of 243.5 km2, consisting of approximately 80% human
settlements and very poor/inadequate forest resources. In the BZ of the Reserve, one (1) Municipality and eleven (11) Village Development Committees (agricultural land and human settlements) are located.
2.1.2. Geology and soil
The Reserve area is a generally flat Terai lowland with the deposits of Gangatic alluvia. This Terai region consists of alluvial sediments which were deposited by the north river systems and their tributaries (Schaaf 1978). The alluvia are transferred from the Churiya and the Himalayan Mountain ranges, where the large river arise and vary from fine silts to clays. The common soil types that are met within the SWR are loamy soils, sandy loam, loam, sity loam and clay loam (Bhatta & Shrestha 1977). These soil types have variable chemical composition which ranges from slightly acidic to moderately alkaline. In the Khair-sisso and mixed type forest, the soil is sandy-loam with stones and gravel comprising 75 per cent of it, in the sal forest the range varies from loam to sandy loam with high organic content, in the grassland areas they are clay loam and sticky and in the churiya the soil consists mainly of sandstone, conglomerates, quartzite, shales and micaceous sandstone (Bhatta & Shrestha 1977).
16 2.1.3. Climate
The Reserve's climate is subtropical monsoonal documenting a wet period from June until September of heavy rainfall (above 90% per year) and a dry period between October and May (Figure 2.2 a).
(a)
(b)
Figure 2.2. (a & b)
Mean monthly rainfall (a) and relative humidity (b) for 12 years from 1999 to 2010, recorded at Mahendranagar, Kanchanpur (source: GoN Dept. of Hydrology and Meteorology)
17
(C)
Figure 2.2. (c) Mean monthly temperature (c) for 12 years from 1999 to 2010, recorded at Mahendranagar, Kanchanpur (source: GoN Dept. of Hydrology and Meteorology)
Between 1999 and 2010, the highest rainfall (2843 mm) was recorded in the year 2009 and lowest (1055 mm) in 2006. The mean maximum temperature was recorded during the month of May (36.50C) and mean minimum in January (7.40C) (Figure2.2.b.). The
recorded mean relative humidity reached its maximum value (95.40 %) during the month of January and the minimum one (49.06 %) in April (Figure 2.2.c).
2.1.4. Vegetation
Generally the vegetation types of Shuklaphanta Wildlife Reserve were classified into forest, grassland, wetlands and floodplains (DNPWC 2006, Rijal & Yonzon 2003). Schaaf (1978) distinguished eight different habitat types in the reserve, viz. Sal forest, Sal Savanna, Mixed deciduous forest, Khair-Sissoo forest, Lowland grasslands, Dry grassland, Seasonally-wet grassland and Lowland savannas. The Reserve is dominated by Sal forest (climax vegetation type) and approximately one-third of the reserve is covered by grassland (Balson 1976). The Sal (Shorea robusta) forest is associated with Terminalia alata, Lagestroemia parviflora, Cleistocalyx operculatus,
18 racemosa. Riverine forest is dominated by Trewia nudiflora, Syzyzium cumini, Mallotus philippensis, Acacia catechu, Ficus racemosa, Ehretia laevis, Ficus glomerata, Butea frondosa, Dalbergia sissoo and Aegle marmelos. Grasslands are a variety of short and
tall grasslands in small and large patches. Tall grasslands are dominated by Themeda
spp, Saccharum spontaneum, Saccharum bengalensis, Narenga porphyrocoma, Desmostachya bipinnata and Phragmites karka. The short grassland is dominated by Imperata cylindrica, Vetivera zizanoides, Saccharum spontaneum and Cynodon dactylon.
2.1.5. Fauna
Shuklaphanta Wildlife Reserve is wealthy in biodiversity. The large grassland stretched covers an area of over 54 km2 providing prime habitat to endangered swamp deer Cervus
duvauceli duvauceli, locally known as “Barashinga”. More than 45 species of mammals
including the endangered one-horned rhinoceros Rhinoceros unicorns, wild elephant
Elephas mixmus, hispid hare Caprolagus hispidus. The two major predators are the tiger Panthera tigris tigris (endangered) and the leopard Panthera pardus (nearly threatened)
including other small carnivores such as fishing cat Prionailurus viverrinus, jungle cat Felis chaus, large civet Viverra zibetha, small civet Viverricula indica and Asian palm civet Paradoxurus hermaphroditus. The potential prey species are chital Axis axis, swamp deer, hog deer Axis porcinus, wild boar Sus scrofa, sambar deer Cervus unicolor, barking deer Muntiacus muntjak, nilgai Boselaphus tragocamelus, common langur Presbytis
entellus, and rhesus macaque Macaca mulatta. More than 349 species (Subedi et al. 2003)
of birds including endangered and threatened bengal florican Huboropsis bengalensis, Lesser florican Sypheotides indicus, swamp francolin Francolinus gularis, sarus crane Grus
antigone, and white-rumped vulture have been recorded in the Reserve. Shrestha et al.
(2008) also recorded five species of amphibians and twenty species of reptiles from the Reserve.
19 2. 2. INTENSIVE STUDY AREA
2.2.1. Shuklaphanta Wildlife Reserve
The intensive study area is commonly known as the western sector of the SWR, however some part of the eastern sector is also included in this research. The remaining part of the eastern
sector was not included in this research because the area is more disturbed with both illegal livestock grazing and
anthropogenic activities (Personal observation). The main study area is approximately 250 km2 (Figure 2.3).
Figure: 2.3. Map showing the intensive study area in SWR. Intensive Study area
20 2.2.2. Bardia National Park
In Bardia National Park, study was concentrated only in Karnali floodplain for genetic components, which is approximately 100 Km2. Bardia National Park is located in the
southerwestern part about 150 km east from Shuklaphanta Wildlife Reserve (Figure2.4). BNP covers an area of 968 Km2. The altitude ranges between 152m above msl and 1441m above msl (Dinerstein 1979a). The climate is sub-tropical with three main seasons, namely dry winter (November-February), hot dry (March-June) and monsoon
(July-October). The area undergoes heavy rainfall above 90% (1560-2230 mm) similar to SWR, between June and September. The minimum temperature is 5 0 C during winter and
maximum 450 C during
the monsoon.
Figure: 2.4. Map showing Bardia National Park and the intensive study area. N E P A L
BARDIA NATIONAL PARK (BNP) (968 Km2) Karnali floodplain of BNP (Approx. 100 km2)
Ü
Study area21 The park consists of deciduous vegetation. Dinerstein (1979a) classified vegetation into six major types, later modified into seven major types by Jnawali and Wegge (1993). Sharma (1999) further classified and described 17 different sub-types.
Out of 17 habitats, 15 are covered with vegetation. The most important vegetation type is Sal forest, dominated by sal Shorea robusta. Wegge et al. (2009) divided habitats into four main types, two forest types and two grasslands types: (i) climax Sal forest (CSF) consisted of Sal forests with small, interspersed patches of Terminalia forest, (ii) successional forest (SF) consisted of all forest types other than Sal forest, (iii) Savannah grasslands (SG) included all Imperata-dominated vegetation types, (iv) tall floodplain grasslands (TG) were dominated by Saccharum spontaneum.
The diverse vegetation provides habitats for fifty-five species of mammals including tiger Panthera tigris tigris, leopard Panthera pardus wild elephant Elephas maximus, greater one horned rhinoceros Rhinoceros unicornis, swamp deer Cervus duvauceli duvauceli, four horned antelopes tetracerus quadricornis, fresh water Gangetic dolphin Platanista gangetica and Himalayan black bear Urus thibetanus. Other mammals are spotted deer Axis axis, sambar deer Cervus unicolor, hog deer Axis porcinus, Muntjac Muntiacus muntjak, nilgai Boselaphus tragocamelus, sloth bear Melursus ursinus, wild boar Sus scrofa, pangolin Manis panthdactyala, striped hyena Hyanea hyena, wild dog Cuon alpines and common otter Lutra perspicillata. The park harbours about 400 resident and migrant birds species, and two species of crocodiles, marsh mugger Crocodilus palustris and gharial Gavialis gangeticus (Dinerstein 1979a).
22 2.3. REFERENCES
Balson, E.W. 1976. General Report on the Shuklaphanta Wildlife Reserve. FAO. Kathmandu. Bhatta, D.D. and T.K. Shrestha. 1977. The environment of Shuklaphanta. Curriculum Development Centre, Tribhuvan University, Nepal.
Dinerstein, E. 1979a. An ecological survey of the Royal Karnali-Bardia wildlfie Reserve, Nepal. Part I: Vegetation modifying factors and successional relationships. Biological Conservation 15: 127-150.
DNPWC. 2006. Shuklaphanta Wildlife Reserve and Buffer Zone Management Plan. DNPWC, MFSC, GoN.
Jnawali, S.R. & Wegge, P. 1993. Space and habitat use by small re-introduced population of greater one-horned rhinoceros Rhinoceros unicornis in Royal Bardia National Park in Nepal a Preliminary report. In Proceedings of an International conference: Rhinoceros Biology and Conservation, ed. O.A. Ryder. Zoological Society of San Diego San Diego, pp. 208-217.
Rijal, A. and P. Yonzon. 2003. Vegetation Ecology of the Shuklaphanta Wildlife Reserve. Resources Himalaya and Participatory Conservation Program (UNDP). Kathmandu, Nepal.
Schaaf, C.D. 1978. Population size and structure and habitat relations of the barasingha (Cervus duvauceli duvauceli) in Sukla Phanta Wildlife Reserve, Nepal. Ph.D. dissertation Michigan State University
Sharma, B.K. 1999. Wildlife habitat mapping by using geographic information systems (GIS) in the Karnali floodplain of Royal Bardia National Park in lowland Nepal. MSc. Thesis, Agricultural University of Norway.
Shrestha, A., R. Shrestha, S. Adhikari and C. Pokheral. 2008. Status of herpetofauna in Shuklaphanta Wildlife Reserve, Nepal. Abstract. 5th National Conference, Kathmandu, Nepal.
Subedi, H., H. K. Shrestha., R. Karmacharya and P. Yonzon. 2003. Birds of the Shuklaphanta Wildlife Reserve. Resources Himalaya and Participatory Conservation Program (UNDP). Kathmandu.
Wegge, P., M. Odden, C. P. Pokheral and T. Storaas. 2009. Predator-prey relationships and responses of ungulates and their predators to the establishment of protected areas: A case study of tigers, leopards and their prey in Bardia National Park, Nepal. Biological Conservation. 142: 189-202.
23
CHAPTER 3
PREY SELECTION OF TIGERS Panthera tigris AND COMMON
LEOPARDS Panthera pardus
24
CHAPTER 3
PREY SELECTION OF TIGERS Panthera tigris AND COMMON
LEOPARDS Panthera pardus
ABSTRACT
Prey selection of the two sympatric large carnivores, tiger Panthera tigris tigris and leopard Panthera pardus, has been evaluated in the Shukalphanta Wildlife Reserve (SWR), Nepal, during the dry seasons between 2008 and 2011. The Distance line transect method and scat analysis were used to estimate density of prey species and to determine food habits, respectively. The 250 km2 intensive study area was found to have high prey density of 131 and
175 individual animals/km2 during the dry seasons of 2010 and 2011, respectively. Wild prey
(chital, hog deer, muntjac, swamp deer, wild boar, nilgai, langur and rhesus) were estimated to compose around 62-63% and domestic (cattle, buffalo and goat/sheep) 38%-37% of the prey in 2010 and 2011, respectively. Among the wild preys, swamp deer (32 animals/km2) was the
most abundant during 2010, followed by chital (26 animals/km2). In 2011, chital (41
animals/km2) was the most abundant followed by swamp deer (32 % animals/km2). Large-sized
prey made up 55.7% and 55.6%, medium-sized prey 21.1% and 23.9%, and small-sized prey 23.2% and 20.4% of the overall densities in 2010 and 2011, respectively. The analysis of 194 tiger and 42 leopard scats showed the occurrence of 12 and 14 prey species, respectively. Around 73% of the tiger scats contained remains of one prey species, 26.8% of two prey species and 0.5% of three prey species. In terms of frequency of occurrence in the tiger scats, medium-sized prey made up the majority, followed by large and then smaller prey species. A high proportion of chital contributed to this. However, in terms of prey biomass, tiger preyed mainly on large sized prey. Fifty percent of leopard scats contained remains of one prey species, 36% of two prey species and 14% of three prey species. Small prey species made up the majority of the leopard diet, followed by medium species, whereas large prey contributed little to the leopard diet. Tiger and leopard diets were composed of a large quantity of wild ungulates (77% for tigers and 51% for leopards). The relative frequency of occurrence of wild ungulates in the diet differed significantly between tiger and leopard. Feral domestic dogs, rodents and birds were not recorded in tiger scats, but they were present in the leopard diet. There was a high dietary overlap between tiger and leopard. Muntjac, wild boar, hog deer, nilgai, buffalo and chital were consumed more by tiger than expected, whereas swamp deer, langur, rhesus and cattle were consumed less in relation to their availability. For the leopard, muntjac, wild boar, hog deer, langur, buffalo, goat/sheep and chital were consumed more than expected, and swamp deer, rhesus and cattle were consumed less than availability. This study was the first in SWR, suggesting that the study area part of SWR has abundant wild prey density. Both tiger and leopard seem mostly dependent on wild prey, however, considerable proportions of domestic prey were observed in diet, bringing challenges for the management of the Reserve.
Key words: food habits, line transect, tiger, leopard, prey selection, scat analysis; Nepal.
25 3.1. INTRODUCTION
A broad understanding of the feeding habits of felids and their behavioural flexibility in hunting is essential for addressing their conservation requirements (Seidensticker & McDougal 1993). However, the mysterious, solitary and nocturnal habits of tigers and leopards, along with their wide-ranging movements, have limited our understanding of their feeding ecology and how this may diverge under varying environmental circumstances (Sunquist 1981).
Resource availability influences feeding habits, which, in turn, may lead to interspecific competition for scarce key-resources with more than one user (De Boer & Prins 1990). Competing species may show evolutionary response, leading to ecological divergence (Pianka 1973, Schoener 1974). In extreme cases, competition may lead one species to disappear locally (Bengtsson 1989). Competition between carnivores may include resource exploitation and behavioural interference, especially through interspecific killing and kleptoparasitism (Palomares & Caro 1999, Donadio & Buskirk 2006). In particular, killing the inferior competitor is a widespread tactic among carnivores, with negative effects on the population size of victim species: interspecific differences in body size and diet, as well as taxonomic relatedness, are factors influencing the level of competition (e.g. Palomares & Caro, 1999; Donadio & Buskirk, 2006).
Interacting species can avoid resource competition by specialising on different prey species. Well-known examples of systems that exhibit such niche partitioning include the interactions between tiger Panthera tigris, common leopard Panthera pardus, dhole
Cuon alpinus (Karanth & Sunquist 2000, Johnsingh 1983), cougar Puma concolor and
bobcat Lynx rufus (Hass 2009), and cougar and jaguar Panthera onca (Foster et al. 2010). Interference competition may also be decreased by temporal segregation in the same habitat (as reported for the lion Panthera leo, cheetah Acinonyx jubatus and wild dog Lycaon pictus (Schaller 1972, Mills & Biggs 1993)), by habitat separation (e.g. Iberian lynx Lynx pardinus, common genet Genetta genetta and Egyptian mongoose
26
like in the cheetah, lion and spotted hyaena Crocuta crocuta (Durant 1998), but also by preying on different species, e.g. wild dog and lion (Mills & Gorman 1997) and tiger, common leopard and dhole (Karanth & Sunquist 1995).
Tiger is the largest endangered felid and it is found in small populations in various habitat types: temperate forests, tropical forests and mangrove forests, where they mostly prey on small to large ungulates, depending on the availability of prey species within their range (Sunquist & Sunquist,1989, Støen & Wegge 1996). The common leopard is often a sympatric large felid, considered as the most successful large wild cat because of its adaptable killing and feeding behaviour (Bertram 1999). This species is widespread throughout Asia and Africa (Myers 1986, Bailey 1993, Nowell & Jackson 1996). Both species are near-threatened because of continuous poaching and loss of habitat across their range. The number of individuals of both species has been decreasing in the last decade (Henschel et al. 2008, Chundawat et al. 2011 cited in IUCN 2012).
Knowledge of the feeding biology, as well as availability and distribution of prey base is crucial to secure the long term survival of these large carnivores (Milla 1992), and to increase awareness of their conservation needs. While poaching and habitat degradation have been shown to play a role in their population declines, low prey availability due to prey habitat loss could also be an important factor. Prey availability and distribution can exert a strong influence on prey selection and hunting success (Fuller et al. 1992), as well as activity patterns and spatial distribution.
Tigers and leopards are stalking predators and are expected to kill more opportunisticly as opposed to dhole, which is a coursing predator (Schaller 1967). Nepal is one of the tiger range countries with more than 150 adult tigers and has committed to double the number by 2022. The Terai Arc Landscape, which bridges Nepal and India, is one of the priority Tiger Conservation Landscapes (Sanderson et al. 2006) with at least 5 core breeding sites (Ranganathan et al. 2008). Tigers and leopards are sympatric through most of the tiger’s range including the lowland Terai of Nepal, and play an important role
27
in influencing population levels of prey species. Recent studies on the food habits suggest that tigers and leopards have substantial dietary overlap (Andheria et al. 2007, Wang & Macdonald 2009, Wegge et al. 2009), with both species preying on large as well as small size ungulates (Johnsingh 1983, Karanth & Sunquist 1995, Sankar & Johnsingh 2002, Ramesh et al. 2009). This probably leads to competition for prey and therefore each cat species can affect prey availability for the other species.
The leopard consumes almost every animal that it can kill, from the smallest peafowl, porcupine up to the buffalo (Rabinowitz 1989, Seidensticker et al. 1990, Karanth & Sunquist 1995, Sankar & Johnsingh 2002, Andheria et al. 2007). In Asia, leopards are found to prefer prey species within the range of 10 to 40 kg, with an average prey weight of 23 kg (Hayward et al. 2006, Odden & Wegge 2009, Odden et al. 2010, Bhattarai & Kindlmann 2012), and in Africa their diet was found to consist of at least 92 species within the range 20-80 kg (Mills & Harvey 2001).
Prey selectivity can be defined as the killing of prey types in frequencies that are different from those expected based on their availability in the environment (Chesson 1978). Prey choice by large felids, which ultimately determines the food habits of these predators, plays a key part in determining their life history strategies, including movement, habitat selection, social structure, geographical distribution and reproductive success (Sunquist & Sunquist 1989). Tiger prey selection seems to vary. Biswas & Sankar (2002), provided data which suggest that tigers relied more on medium-sized prey followed by the large sized prey regardless of an ample supply of large prey in the area. Similar results were recorded by Bhattarai & Kindlmann (2012) from Chitwan National Park, Nepal. Karanth & Sunquist (1995) suggest that in the absence of large prey, tigers would remove non-selectively medium-sized prey. In contrast, StØen & Wegge (1996) and later (Wegge et al. 2009) demonstrated that tigers show significant selection among medium-sized prey species when large prey was scarce. Sambar, which are commonly taken by tigers in other areas, were not preyed upon by Badia and Shuklaphanta tigers. This was thought to occur due to scarcity of sambar in both areas (Karnali floodplain, Bardia and present study area).