Energy landscape in protein folding and unfolding
Francesco Mallamacea,b,c,1, Carmelo Corsaroa,d, Domenico Mallamacee, Sebastiano Vasid, Cirino Vasia, Piero Baglionif, Sergey V. Buldyrevg, Sow-Hsin Chenb, and H. Eugene Stanleyc,1
aCNR-Istituto per i Processi Chimico Fisici Messina, I-98166 Messina, Italy;bDepartment of Nuclear Science and Engineering, Massachusetts Institute of Technology, Cambridge, MA 02139;cCenter for Polymer Studies and Department of Physics, Boston University, Boston, MA 02215;dDipartimento di Fisica e di Scienze della Terra, Università di Messina, I-98166 Messina, Italy;eConsorzio per lo Sviluppo dei Sistemi a Grande Interfase, Unità di Catania, I-95125 Catania, Italy;fDipartimento di Chimica, Università di Firenze and Consorzio per lo Sviluppo dei Sistemi a Grande Interfase, I-50019 Florence, Italy; andgDepartment of Physics, Yeshiva University, New York, NY 10033
Contributed by H. Eugene Stanley, December 22, 2015 (sent for review March 17, 2015; reviewed by Anders Nilsson and Michele Parrinello)
We use1H NMR to probe the energy landscape in the protein fold-ing and unfoldfold-ing process. Usfold-ing the scheme⇄ reversible unfolded (intermediate)→ irreversible unfolded (denatured) state, we study the thermal denaturation of hydrated lysozyme that occurs when the temperature is increased. Using thermal cycles in the range 295< T < 365 K and following different trajectories along the protein energy surface, we observe that the hydrophilic (the amide NH) and hydrophobic (methyl CH3and methine CH) peptide groups evolve and exhibit different behaviors. We also discuss the role of water and hydrogen bonding in the protein configurational stability. protein folding
|
proton NMR|
energy landscape|
hydration waterA
n intriguing problem of statistical physics concerns theevolutionary pathways that molecular systems follow as they form mesoscale structures and exhibit new functional behaviors (1). An example of this problem is the self-organization of bio-systems that evolve from basic molecules. This challenging sub-ject is studied by using a variety of theoretical methods (2–4). The free-energy landscape model is nowadays the most used to describe such phenomena and especially the aging of the protein folding mechanism (1, 5, 6), i.e., the way in which proteins fold to their native state and then unfold (protein denaturation) (6, 7). The model is based on the idea that in complex materials and systems there are many thermodynamical configurations in which the free-energy surface exhibits a number of local minima sepa-rated by barriers, i.e., as the system explores its phase space the trajectory of its evolution is an alternating sequence of local energy minima and saddle points (transition states), which are associated with the positions of all of the system particles. A trajectory thus specifies the path of the system as it evolves by moving across its energy landscape.
A peptide is a linear chain of amino acids, and globular pro-teins are polypeptide chains that fold into their native confor-mation. During the folding process a polypeptide undergoes many conformational changes and there is a significant decrease in the system configurational entropy as the native state is approached. To understand folding we focus on how proteins search conformational space. The process is accompanied by many microscopic reactions, the nature of which is determined by the specifics of the energy surface. Thus, the characteristics of the energy surface of a polypeptide chain are the key to a quan-titative understanding of folding. Although the degrees of freedom of a polypeptide chain allow an enormously large number of possible configurations,“constraints” on the energy decrease these configurations visited in the folding reaction to a limited number (8). Understanding the free-energy surface (“landscape”) enables us to understand the folding process. A balance between the potential energy and the configurational entropy leads to a free-energy barrier that generates the two-state folding behavior usu-ally observed in small proteins. The potential energy decreases as the native state is approached and favors folding, but decreasing the entropy of the configuration is unfavorable to folding.
The thermodynamics and kinetics of folding and unfolding have been intensively studied by molecular dynamics (MD)
simulation (9, 10) and different experimental techniques (11–16). Whereas MD simulations directly model peptide conformational transitions in terms of the energy landscape, experiments supply useful but limited information, revealing some details in the structure and the collective dynamics of protein, both dry and in solution. Examples of this include the spectroscopic techniques (e.g., NMR, neutron, X-ray, Raman, and FTIR) that supply data on structure and dynamical modes of the protein, and the calorimetric measurements that follow the reversible folding– unfolding as far as irreversible denaturation (9, 10). The protein dynamics have been studied from the glass state in the deep supercooled regime (T < 200 K) to the completely denatured state (T ’ 350 K) by proving the essential role of the hydration water. As for bulk water, hydrogen bond (HB) interactions strongly determine the properties of these systems, for which water is not simply a solvent but is also an integral and active component, i.e., it is itself an important“biomolecule” that plays both a dynamic and structural role (17). Hence, HB interactions are the key to understanding water’s properties and how water functions in biological environments (18).
Among the different experimental methods, calorimetry, by monitoring the process reaction rates, focuses directly the energetic properties of the hydrated proteins folding–unfolding mechanism and measures the enthalpy and entropy behaviors. Unlike common chemical reaction rates, which increase as the temperature is in-creased, the rate constant of the protein folding reaction initially increases on increasingT, by following an Arrhenius law goes to a maximum, and then decreases as the temperature continues to increase (19). This latter situation is also well-described in MD simulations (20). The activation enthalpy is thusT-dependent and the corresponding protein specific heat, CPðTÞ, exhibits large
Significance
Protein folding represents an open question in science, and the free-energy landscape framework is one way to describe it. In particular, the role played by water in the processes is of spe-cial interest. To clarify these issues we study, during folding– unfolding, the temperature evolution of the magnetization for hydrophilic and hydrophobic groups of hydrated lysozyme using NMR spectroscopy. Our findings confirm the validity of the theoretical scenario of a process dominated by different energetic routes, also explaining the water role in the protein configuration stability. We also highlight that the protein native state limit is represented by the water singular temperature that characterizes its compressibility and expansivity and is the origin of the thermodynamical anomalies of its liquid state.
Author contributions: F.M., C.C., P.B., S.V.B., and H.E.S. designed research; F.M., C.C., D.M., S.V., and C.V. performed research; F.M., D.M., S.V., P.B., S.V.B., and S.-H.C. analyzed data; and F.M., C.C., and H.E.S. wrote the paper.
Reviewers: A.N., SLAC National Accelerator Laboratory; and M.P., ETH Zurich. The authors declare no conflict of interest.
1To whom correspondence may be addressed. Email: [email protected] or [email protected]. APPLIED PHYSICAL SCIENCES BIOPHYSICS AND COMPUTATIONAL BIOLOGY
changes: first it increases withT, reaches a maximum, and then decreases. Hence aCPðTÞ plot against T exhibits an endothermic
peak whose area is related to the enthalpy of transformation of the protein. Such a behavior is also strongly influenced by the protein hydrophobic side chains and hydration water (19, 21, 22). NMR spectroscopy instead can be used to follow folding (or unfolding) processes by probing interactions as they form at the level of individual residues, and to compare the findings obtained with simulations (13, 23–25). NMR studies involve in-vestigation of the equilibrium conversion between native and denatured states resulting from a protein being subjected to heat, extremes of pH, or chemical denaturants. The kinetics of the process may limit the observations. If the folding occurs on a time scale for which spectra can be measured and recorded se-quentially, the spectral changes accompanying the reaction can be monitored at the individual residue level and thus be accu-rately studied. Recently, new methods have been developed to probe very fast processes or by slowing down the protein folding kinetics by means of proper reactants.
One example of1H NMR spectroscopy in which the protein folding can be properly detailed is represented by a real-time study of bovineα-lactalbumin (BLA) refolding, at 293 K, where spectra show significant resonance changes from methyl and methine groups of aromatic residues (25). In this case the experimental strategy was in the control of the Ca2+concentration for which the folding kinetics can vary over several orders of magnitude. The BLA refolding was initiated by a pH jump (in the absence of Ca2+) by injecting a solution at pH 8.8 containing a proper buffer into a protein solution at pH 2.0. In such a way the 1H NMR spectra were recorded at incremented time points (between 1.2 s and 10.3 min, with steps of 10 ms) after initiation of refolding. Such an approach, in enlarging the folding kinetics, represents the poten-tiality of the NMR methodology in its capability of monitoring specific aspects of the folding, like the protein structural changes, the energetic configurations, and the role of the hydration water. Here, to study the folding–unfolding of hydrated lysozyme we use a different approach based on its thermal denaturation. More
precisely, to quantify the behavior of the protein hydrophilic (the amide NH) and hydrophobic (methyl and methine) groups, during the folding–unfolding process, we use as control variable the temperature, which slows the process kinetics to many hours. The goal is to determine the topography of the protein energy landscape by following different trajectories along the energy surface. This allows us also to consider explicitly the role of water and hydrogen bonding in protein configurational stability. Results
Thermal denaturation of lysozyme occurs according to the scheme, native state (N) ⇄ reversible unfolded (intermediate) state (RU) → irreversible unfolded (denatured) state (IU); N ⇄ RU → IU (21, 22). This is consistent with the general view that the first step in the denaturation of small one-domain globular proteins, e.g., lysozyme, is a reversible conformational (unfolding) transition, and the second step is an irreversible denaturation. Studies performed in the 290< T < 370 K range have revealed that the observedCPðTÞ peak is caused by heat absorption when the
equilibrium constant between the native lysozyme state and a conformational different intermediate state increases withT (26, 27). TheCmax
P ðTÞ peak temperature is TD= 347 K and seems to
represent the reversibility limit. Lysozyme at a hydration level of h = 0.3 has a water monolayer covering its surface (27). As de-scribed inMethods, we have conducted the experiments using dif-ferent heating/cooling cycles exploring completely or partially the folding process N ⇄ RU → IU. Briefly, cycles A (295 K → 365 K→ 297 K) and B (296 K→ 366 K→ 298 K) follow the complete denaturation starting from the native state with steps ofΔT = 2 K. Cycle C (295 K→ 320 K → 298 K) operates only inside the native N state withΔT = 1 K. Cycles D (310 K → 349 K → 310 K) and E (310 K → 343 K → 310 K) work inside the N ⇄ RU → IU and N⇄ RU regions, respectively, with ΔT = 1 K.
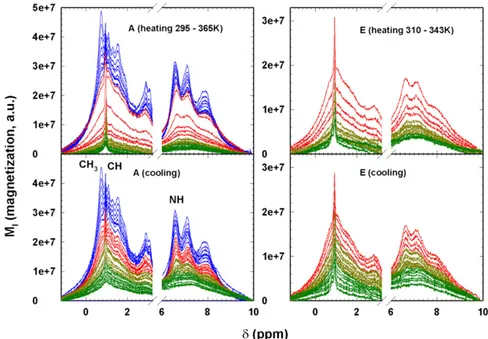
Fig. 1 shows the NMR spectra of the hydrated protein for two thermal cycles after the water contribution has been extracted. In case A the thermal evolution moves from the native state (N) to the fully denatured state (295–365 K), and vice versa. In case E
Fig. 1. Protein1H NMR spectra (magnetization versus the chemical shift) of cycles A (Left) and E (Right). (Top) Spectra in the heating phase; (Bottom) spectra in the cooling phase. Cycle A regards the complete thermal denaturation of lysozyme, whereas cycle E deals with the reversible evolution from the native to the unfolded (intermediate) state. In both cycles the spectral evolution from the native to the denatured state is reported in different colors just to clarify the protein thermal behavior. The spectra of the native state are reported in green, those of the RU region before the onset of the CPðTÞ peak (320 − 336 K) in
dark yellow, the spectra above this region up to the Cmax
the protein is in the N⇄ RU phase (310–343 K). From the spectra in cycle A in the heating phase (shown in red), a marked change in the T region around Cmax
P ðTÞ (337–347 K) occurs.
Thus, Fig. 1 shows that the folding–unfolding reaction at the individual residue level can be quantitatively monitored, and it supplies the details of the system energy configurations. Among the several residues observable in the1H NMR spectra in Fig. 1, we considered the hydrophilic (the amide NH) and hydrophobic (CH3 and CH) side-chain groups centered at chemical shifts δ ’ 6.7 ppm, δ ’ 0.8 ppm, and δ ’ 0.94 ppm, respectively (28). Data Analysis and Discussion.The hydrogens attached to the amide nitrogen atoms of peptide via HB (29–31) rapidly exchange with solvent hydrogen atoms in unfolded states, but are often protected from exchange when the protein folding is the result of the in-volvement of amides in the HBs and burial in the protein interior. It is well known that the HBs of water molecules—with the car-bonyl oxygen (C= O) and an amide N–H molecular group— trigger the biomolecular activity of the protein peptides. The most stable water–protein configuration has two HBs: (i) a water proton donor bond to the carbonyl oxygen and (ii) an amide N–H proton donor bond to the water oxygen (29–31). In protein folding, the water HBs play a role in protein–protein binding and in molecular recognition. In short, water acts as an HB“glue” between the carbonylic and amidic groups in a protein (31), and during the folding phase the formation of hydrophobic clusters compensates for the loss of system configurational entropy.
Hence, the protein stability is strongly dependent on the HB strength (or lifetime) that decreases by increasing temperature. It is just this change in the HB strength that determines the thermodynamic properties of the hydrated protein and the cor-responding heat capacity effects (30). All of this is reflected in Fig. 1. Figs. 2–4 show an Arrhenius plot [the log of the measured magnetizationMIðTÞ vs. 1=T] that provides a detailed analysis of
the different energetic behaviors of the protein groups, namely hydrophilic (the amide NH) and hydrophobic (methyl and methine) groups, evaluated using the procedure described inMethods.
Fig. 2 deals with the Arrhenius representation of the measured magnetization values [MIðTÞ] of the hydrophilic amide groups.
All five different thermal cycles (A, B, C, D, and E) studied are illustrated. There is a largeT interval in A and B for which the complete protein denaturation can be studied, and a smallerT interval in C and D. All figures show theTD andT*
tempera-tures.T*is the compressibility minimum temperature of bulk
water. It is invariant with increasing pressure, and coincides with the cross-over point at which thermal expansion is found to be constant with pressure (32).T*also signals the breakdown of the
tetrahedral structure of water (33) and the limit of the protein native state (34). AboveT*water becomes a“simple” liquid and
thus a bad solvent (32). Fig. 2 shows theT region of the lyso-zyme-water configurational CPðTÞ peak (dotted line) (26, 27).
The overall behavior of cycles A, B, and D is essentially the same. By increasing T, MIðTÞ exhibits a pure Arrhenius (AR)
behavior (with an activation energyEA’ 4.58 kcal=mol) up to
the onset of theCPðTÞ peak. Above that it presents a marked
increase [super-Arrhenius (SA) in character] that stops at ap-proximatelyTD, after which it evolves again according to the AR
law (EA’ 7.38 kcal=mol) up to 365 K, where the thermal cycle
is inverted. During the cooling phase the energetic behavior of this amide group is about the same as the heating phase up toTD.
At the lowest temperatures,MIðTÞ shows two other AR
behav-iors: (i) one that stops near T*withEA’ 9.91 kcal=mol and (ii)
one at T < T* that differs somewhat from that of the heating
phase in the sameT range. Note that cycle D inverts (in T after the heating phase) aboveTDand denatures in the same way as A
and B. Cycle C operating in the native state shows complete reversibility and thus has the same activation energy as the other cycles during the early heating phase. Note that the energy
behavior shown in cycle E reverses atT = 343 K, i.e., 4 K below TD, butMIðTÞ in the heating phase exhibits the same behavior as
the corresponding behavior in cycles A, B, and D and, in the cooling phase, differs completely because it recovers its native behavior as it nears T*. All of this demonstrates the energetic
behavior of the hydrophilic protein group NH in a cycle that operates reversibly between the N native state and the RU state (as in cycle E). We evaluate the energy (EA) and enthalpy
dif-ference between the native and unfolded state (in cycles A, B, and D) and the energy of the reversible unfolding (in cycle E). We find ’50 kcal/mol for the first case and ’12 kcal/mol for the second, values that agree with those calculated for lysozyme (58 kcal/mol and 14 kcal/mol) and for globular proteins (35).
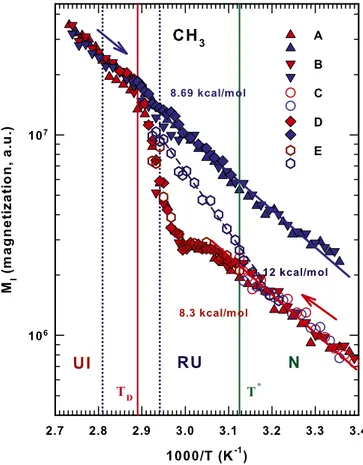
Fig. 3 shows the thermal behavior of the methyl (CH3) lysozyme groups and reports all of the studied cycles. Note that there are qualitative similarities with the amide groups but that the differing energies indicate a different pathway in both the irreversible de-naturation and the reversible unfolding. In the first case the cooling phase appears to be fully AR across the wideT range with EA’ 8.69
kcal/mol. In the cooling side of the RU regionEA’ 12 kcal=mol. In
the heating phase the N region has anEA’ 8.3 kcal=mol, the AR
behavior stops atT*, and in the RU region a weak maximum appears
at’330 K, after which MIðTÞ assumes the values of the irreversible
denatured phase and rapidly increases toTD.
Fig. 4 showsMIðTÞ for methine (CH) that in the heating phase is
larger than that of the cooling phase. Unlike the amide and methyl polypeptide groups, which are more mobile in the fully denatured phase (IU), i.e., the protein is an open polyelectrolyte and the Fig. 2. AR representation of the measured magnetization values of the hydrophilic amide groups (NH). Data for all five different studied thermal cycles (A, B, C, D, and E) are illustrated. The characteristic temperatures T*
and TDare also reported. Lines represent AR behaviors; the corresponding
activation energies EAare indicated in kcal/mol. Cycles A, B, and D deal with
a complete denaturation; C operates in the native protein state (N), whereas E refers to the native and intermediate states (N⇄ RU).
APPLIED PHYSICAL SCIENCES BIOPHYSICS AND COMPUTATIONAL BIOLOGY
water a bad solvent, the methine groups are more mobile during the heating phase of the RU region than in the IU phase. This confirms that the hydrophobic groups are buried during protein folding—more so in CH3than in CH—and that they are affected by the presence of solvent hydrogen atoms. However, in cycles A, B, and C the methine groups exhibit AR behavior in the cooling phase (EA’ 6.41 kcal/mol), and their thermal evolution during the
heating phase is more complex. Within the native region the heating phase has an AR evolution (EA’ 9.09 kcal/mol) that stops
nearT*,MIðTÞ has a maximum at T ’ 330 K and then decreases
to a minimum atTDand further evolves, exhibiting AR behavior
that is nearly identical to that of the cooling phase. In cycle D the methineMIðTÞ recovers (from the RU phase) the thermal trend of
the native state, which is an AR behavior withEA’ 5 kcal/mol.
T*strongly affects protein folding; it marks the cross-over in
bulk water from “normal” liquid behavior when T > T* to be-havior characterized by thermodynamic anomalies whenT < T*.
In particular,T*indicates a“singular and universal expansivity
point” related to the balance between the entropy and volume cross-correlations hδSδVi. In normal liquids δS and δV fluctua-tions become smaller as T decreases and they are positively correlated, but in water they become more pronounced atT*and
are anticorrelated at the density maximum (at ambient pressure). Structurally T* is identified as the onset temperature of HB
clustering (32). Such transport properties as self-diffusion data in the high-temperature regime of bulk waterDsðTÞ indicate that T*
signals a new dynamic cross-over. Specifically, whenT deceases the dynamics change and there is a shift from AR to SA be-havior. We used the Adam–Gibbs approach, connected Dsto the
configurational entropySc, and found that at this temperature
the local order of water becomes more structured (36). Note that
there is a violation of the Stokes–Einstein relationship for T > T*in
the first NMR measurement of the proton diffusion in water as a function ofT (33). This physical effect of T*in bulk water is also
found in confined water. In protein hydration and internal water it is the internal water that“drives” the protein structure from a globular configuration to an open, unfolded configuration. The mechanism for this is the HB structure shared by water, carbonyl oxygen (C= O), and amidic proton (N–H). Figs. 2–4 show that our findings confirm this picture. They also show that aboveT*asTDis
approached the role of hydration water becomes increasingly im-portant and causes irreversible unfolding in the biopolymer. In the reversibility interval betweenT*andTDthat defines the interval of
the reversibility, the HB structure of the protein side chains enables the internal water to impose a persistent folded structure. All of the measured activation energies quantitatively confirm this picture.
In summary, this study reports the energetic evolution that occurs during the folding and unfolding of separate peptide hy-drophilic and hydrophobic groups in single-layer hydrated lyso-zyme. After studying different thermal cycles, including those that are reversible and those involving complete denaturation, we find that protein properties during this process are strongly affected by different energetic routes.
A comparison between the behavior of these three peptide groups confirms that HBs play a role in protein folding. Evidence for this rests not only in the activation energy values that are of the same order of magnitude as in the HBs, but also in the thermal behavior of the methine groups, specifically in their magnetization MIðTÞ
behavior in the N and the RU phases. The higher molecular mobility is caused by the burial effect of the HBs on the hydrophobic groups, which is particularly strong in the case of the methyl groups.
The two forms of protein water, hydration water and internal water, are essential in protein folding. Because all water in the Fig. 3. Thermal evolution of the magnetization, MIðTÞ, of the protein
methyl (CH3) groups for all of the studied thermal cycles. Lines and symbols
are the same as used in Fig. 2.
Fig. 4. Protein methine (CH) magnetization, MIðTÞ, for all of the different
unfolded state belongs to the solvent, hydrogens in the amide groups with peptide bonds interact rapidly via HBs with water. When the protein folds these interactions involve only internal water, which is linked with amides and buries the protein interiors. Thus, clusters of hydrophobic residues are formed in the folded protein and the methine groups are more mobile than the methyl groups. Methods
We used hen egg white lysozyme at the hydration level h= 0.3 prepared according to a precise procedure (27). The enzymatic activity in lysozyme is very low up to h∼ 0.2, but when h is increased from 0.2 to 0.5 the activity increases sharply. The hydration level was determined by thermogravimetric analysis and also confirmed by directly measuring the weight of the absor-bed water. This hydration level corresponds to a monolayer coverage on the protein surface. For each experimental run we used different samples.
Hydrated lysozyme has been studied at ambient pressure and different temperatures (essentially in the 290< T < 370 K range) by using a Bruker AVANCE 700-MHz NMR spectrometer. We focused on the1H NMR spectra obtained from free-induction decay, and explored the hydrated protein as a function of temperature in heating–cooling cycles with an accuracy of ±0.1 K by using the T dependence of the chemical shift of ethylene glycol as a T standard. The spectroscopic experimental technique was“magic angle spinning” (37). The NMR signal intensity MIis directly related to the system
equilibrium magnetization M0, which is related to the susceptibility χ0,
which depends linearly on the total number of mobile spins per unit volume, on the mean-square value of the nuclear magnetic moment, and on 1=T (the Curie law); hence, the spectra were corrected for the Curie effect.
We used different heating and cooling cycles to explore, completely or partially, the folding process N⇄ RU → IU. (i) In cycles A and B we began in the native state and studied the entire process up to complete denaturation. In cycle A the hydrated lysozyme was heated from 295 to 365 K and then cooled down to 297 K, and in cycle B cycle from 296 to 366 K and down to 298 K. In both the warming and the cooling cycles the spectra were mea-sured using steps ofΔT = 2 K. (ii) Cycle C operates inside the native N state. (iii) Cycle D operates inside the N⇄ RU → IU region and cycle E inside the N⇄ RU region. We started both cycles at the sample heating temperature (310 K), but cycle D was inverted immediately above TDat T= 349 K and the
cooling in cycle E was initiated at 343 K (4 K below TD).
To avoid unwanted abrupt T changes, heating and cooling steps were executed slowly and were∼20 min in duration. Fig. 1 shows all of the spectra (magnetization intensity MI versus chemical shift δ in the −1.2–10-ppm
range) of cycle A (Left) and cycle E (Right) after subtracting from the spectra the central contribution due to water. Both the spectra in the heating phase (Top) and the cooling phase (Bottom) are shown. Fig. 1 also shows the many different contributions made by different protein chemical groups when MI
is increased by increasing T. During the cooling phase the reverse is true. Note that in cycle A the starting spectra and the final spectra (at the same temperature, 297 K) differ to the extent that the spectral evolutions during the heating and cooling phases differ. To clarify the temperature spectral evolution, the different phases are color-coded: the native state spectra in green, the RU region before the CPðTÞ peak at 320–336 K in dark yellow,
the spectra above this region up to the Cmax
P ðTÞ at 337–347 K in red, and
the irreversible denatured (IU) region in blue. Note that in the heating phase of the cycle A spectra the corresponding MIrapidly increases in the
interval 339< T < 351 K immediately inside the temperature range of the CPðTÞ peak, and in the cooling phase MIseems to continuously evolve with
T. In contrast, cycle E exhibits a different thermal evolution in which the initial and final spectra are essentially the same, indicating that we were in the N⇄ RU region, that TDrepresents the limit of the reversibility, and
that the thermal evolution appears to be continuous in both the heating and cooling phases. Note that in the cooling phase we collected spectra in steps ofΔT = 1 K.
To obtain the thermal behavior of hydrophilic (the amide NH) and hy-drophobic (methyl CH3and methine CH) groups, we performed a spectral deconvolution in terms of their Lorentzian contributions by examining all of the spectra contributions shown in Fig. 1. For all of the measured spectra we used an AR plot to analyze the MIof the three groups centered at chemical
shifts NH’ 6.7 ppm, CH3’ 0.8 ppm, and CH ’ 0.94 ppm. The results in Figs. 2–4 are shown for the same MI-reduced temperature (1,000=T) intervals, and
are explicitly indicated for the N and IU regions.
ACKNOWLEDGMENTS. The authors acknowledge the Consiglio Nazionale delle Ricerche for its support. The Boston University research is supported by the National Science Foundation, Grants CHE 1213217, CMMI 1125290, and PHY 1505000. The research at Massachusetts Institute of Technology is funded by US Department of Energy Grant DE-FG02-90ER45429. S.V.B. acknowledges the support of this research through the Dr. Bernard W. Gamson Computational Science Center at Yeshiva College.
1. Yip S, Short MP (2013) Multiscale materials modelling at the mesoscale. Nat Mater 12(9):774–777.
2. Laio A, Parrinello M (2002) Escaping free-energy minima. Proc Natl Acad Sci USA 99(20):12562–12566.
3. Stillinger FH (1988) Supercooled liquids, glass transition and Kauzmann paradox. J Chem Phys 88(12):7818–7825.
4. Laughlin RB, Pines D, Schmalian J, Stojkovic BP, Wolynes P (2000) The middle way. Proc Natl Acad Sci USA 97(1):32–37.
5. Mallamace F, et al. (2010) Transport properties of glass-forming liquids suggest that dynamic crossover temperature is as important as the glass transition temperature. Proc Natl Acad Sci USA 107(52):22457–22462.
6. Wolynes PG, Onuchic JN, Thirumalai D (1995) Navigating the folding routes. Science 267(5204):1619–1620.
7. Karplus M (2011) Behind the folding funnel diagram. Nat Chem Biol 7(7):401–404. 8. Zwanzig R, Szabo A, Bagchi B (1992) Levinthal’s paradox. Proc Natl Acad Sci USA 89(1):
20–22.
9. Sali A, Shakhnovich E, Karplus M (1994) How does a protein fold? Nature 369(6477): 248–251.
10. Baldwin RL (1994) Protein folding. Matching speed and stability. Nature 369(6477):183–184. 11. Schuler B, Eaton WA (2008) Protein folding studied by single-molecule FRET. Curr
Opin Struct Biol 18(1):16–26.
12. Colletier JP, et al. (2008) Shoot-and-Trap: Use of specific x-ray damage to study structural protein dynamics by temperature-controlled cryo-crystallography. Proc Natl Acad Sci USA 105(33):11742–11747.
13. Boehr DD, McElheny D, Dyson HJ, Wright PE (2006) The dynamic energy landscape of dihydrofolate reductase catalysis. Science 313(5793):1638–1642.
14. Li CB, Yang H, Komatsuzaki T (2008) Multiscale complex network of protein conforma-tional fluctuations in single-molecule time series. Proc Natl Acad Sci USA 105(2):536–541. 15. Ihalainen JA, et al. (2007) Folding and unfolding of a photoswitchable peptide from
picoseconds to microseconds. Proc Natl Acad Sci USA 104(13):5383–5388. 16. Ihalainen JA, et al. (2008) Alpha-Helix folding in the presence of structural constraints.
Proc Natl Acad Sci USA 105(28):9588–9593.
17. Levy Y, Onuchic JN (2006) Water mediation in protein folding and molecular recog-nition. Annu Rev Biophys Biomol Struct 35:389–415.
18. Jeffrey GA, Saenger W (1991) Hydrogen Bonding in Biological Structures (Springer, Berlin).
19. Oliveberg M, Tan YJ, Fersht AR (1995) Negative activation enthalpies in the kinetics of protein folding. Proc Natl Acad Sci USA 92(19):8926–8929.
20. Dobson CM, Sali A, Karplus M (1998) Protein folding: A perspective from theory and experiment. Angew Chem Int Ed 37(7):868–893.
21. Privalov PL (1996) Intermediate states in protein folding. J Mol Biol 258(5):707–725. 22. Privalov PL, Dragan AI (2007) Microcalorimetry of biological macromolecules. Biophys
Chem 126(1-3):16–24.
23. Best RB, et al. (2007) Effect of flexibility and cis residues in single-molecule FRET studies of polyproline. Proc Natl Acad Sci USA 104(48):18964–18969.
24. Dyson HJ, Wright PE (2002) Insights into the structure and dynamics of unfolded proteins from nuclear magnetic resonance. Adv Protein Chem 62:311–340. 25. van Nuland NAJ, Balbach J, Forge V, Dobson CM (1998) Real-time NMR studies of
protein folding. Acc Chem Res 31(11):773–780.
26. Salvetti G, Tombari E, Mikheeva L, Johary GP (2002) The endothermic effects during denaturation of lysozyme by temperature modulated calorimetry and an inter-mediate reaction equilibrium. J Phys Chem B 106(23):6081–6087.
27. Mallamace F, et al. (2011) A possible role of water in the protein folding process. J Phys Chem B 115(48):14280–14294.
28. Redfield C, Dobson CM (1988) Sequential 1H NMR assignments and secondary structure of hen egg white lysozyme in solution. Biochemistry 27(1):122–136. 29. Walsh STR, et al. (2003) The hydration of amides in helices; a comprehensive picture
from molecular dynamics, IR, and NMR. Protein Sci 12(3):520–531.
30. Cooper A (2005) Heat capacity effects in protein folding and ligand binding: A re-evaluation of the role of water in biomolecular thermodynamics. Biophys Chem 115(2-3):89–97.
31. Sundaralingam M, Sekharudu YC (1989) Water-inserted alpha-helical segments im-plicate reverse turns as folding intermediates. Science 244(4910):1333–1337. 32. Mallamace F, Corsaro C, Stanley HE (2012) A singular thermodynamically consistent
temperature at the origin of the anomalous behavior of liquid water. Sci Rep 2:993. 33. Simpson JH, Carr HY (1958) Diffusion and nuclear spin relaxation in water. Phys Rev
111(5):1201.
34. Mallamace F, et al. (2014) The influence of water on protein properties. J Chem Phys 141(16):165104.
35. Makhatadze GI, Privalov PL (1995) Energetics of protein structure. Adv Protein Chem 47:307–425.
36. Mallamace F, Corsaro C, Mallamace D, Vasi S, Vasi C, Stanley HE (2014) Thermody-namic properties of bulk and confined water. J Chem Phys 141(18):18C504. 37. Lindon JC, Beckonert OP, Holmes E, Nicholson JK (2009) High-resolution magic angle
spinning NMR spectroscopy: Application to biomedical studies. Prog Nucl Magn Reson Spectrosc 55(2):79–100. APPLIED PHYSICAL SCIENCES BIOPHYSICS AND COMPUTATIONAL BIOLOGY
![Fig. 2 deals with the Arrhenius representation of the measured magnetization values [M I ðTÞ] of the hydrophilic amide groups.](https://thumb-eu.123doks.com/thumbv2/123dokorg/4616167.40334/3.877.446.811.76.540/deals-arrhenius-representation-measured-magnetization-values-hydrophilic-groups.webp)