A U T I S M S P E C T R U M D I S O R D E R Copyright © 2019 The Authors, some rights reserved; exclusive licensee American Association for the Advancement of Science. No claim to original U.S. Government Works
Patients with autism spectrum disorders display
reproducible functional connectivity alterations
Štefan Holiga1*, Joerg F. Hipp1, Christopher H. Chatham1, Pilar Garces1, Will Spooren1, Xavier Liogier D’Ardhuy1, Alessandro Bertolino1,2, Céline Bouquet1, Jan K. Buitelaar3,
Carsten Bours3, Annika Rausch3, Marianne Oldehinkel3,4, Manuel Bouvard5, Anouck Amestoy5, Mireille Caralp6, Sonia Gueguen7, Myriam Ly-Le Moal8, Josselin Houenou9,10,
Christian F. Beckmann3, Eva Loth11, Declan Murphy11, Tony Charman11, Julian Tillmann11,12, Charles Laidi9, Richard Delorme13,14, Anita Beggiato13,14, Alexandru Gaman9, Isabelle Scheid9, Marion Leboyer9, Marc-Antoine d’Albis9,10, Jeff Sevigny1, Christian Czech1,
Federico Bolognani1,15, Garry D. Honey1, Juergen Dukart1,16,17*
Despite the high clinical burden, little is known about pathophysiology underlying autism spectrum disorder (ASD). Recent resting-state functional magnetic resonance imaging (rs-fMRI) studies have found atypical synchro-nization of brain activity in ASD. However, no consensus has been reached on the nature and clinical relevance of these alterations. Here, we addressed these questions in four large ASD cohorts. Using rs-fMRI, we identified func-tional connectivity alterations associated with ASD. We tested for associations of these imaging phenotypes with clinical and demographic factors such as age, sex, medication status, and clinical symptom severity. Our results showed reproducible patterns of ASD-associated functional hyper- and hypoconnectivity. Hypoconnectivity was primarily restricted to sensory-motor regions, whereas hyperconnectivity hubs were predominately located in prefrontal and parietal cortices. Shifts in cortico-cortical between-network connectivity from outside to within the identified regions were shown to be a key driver of these abnormalities. This reproducible pathophysiological phenotype was partially associated with core ASD symptoms related to communication and daily living skills and was not affected by age, sex, or medication status. Although the large effect sizes in standardized cohorts are encouraging with respect to potential application as a treatment and for patient stratification, the moderate link to clinical symptoms and the large overlap with healthy controls currently limit the usability of identified altera-tions as diagnostic or efficacy readout.
INTRODUCTION
Autism spectrum disorder (ASD) is a neurodevelopmental disorder characterized by deficits in social interaction and communication, and by the presence of restricted and stereotyped behaviors and sensory anomalies (1). ASD occurs in up to about 1% of general child popula-tion (2), and despite its early childhood onset and lifelong persistence,
little is known about the neurobiology underlying its cause and patho-genesis (3). On the basis of various divergent findings, several theories have been proposed to explain ASD at genetic, neuropathology, system-ic, and behavioral levels (4, 5). On a systemic level, the hypothesis of abnormal brain functional connectivity has been proposed more than a decade ago (6).
One of the prevailing experimental approaches to study brain func-tional connectivity noninvasively is by resting-state funcfunc-tional magnetic resonance imaging (rs-fMRI) (7). rs-fMRI reflects spontaneous neuro-nal activity by detecting slow fluctuations of local oxygen demands (8). Interregional temporal synchronization of the intrinsic hemodynamics is then considered as an index of functional connectivity (8). A substan-tial body of evidence now supports the existence of such functional connectivity alterations in ASD (9–15) and correlation of such altera-tions with autistic traits in neurotypical populaaltera-tions (16). However, the field has still failed to converge on the anatomy, nature, directionality, and clinical relevance of the observed alterations. Whereas some reports point to a hypoconnectivity phenotype (17–19), others reported hy-perconnectivity (12, 20), and some observed a mix of both phenomena (10, 21). Besides inherent disease heterogeneity, this discordance has been proposed to arise from age or methodological differences be-tween studies (19, 22, 23), or failures to account for medication effects in the analyses (24). Yet other works highlight the importance of spa-tial variability in connectivity as a key source of heterogeneity in ASD (21, 25). A common caveat in interpretation of these studies is the lack of replication of respective findings. A consensus on the nature and clinical relevance of the functional connectivity changes in ASD there-fore still needs to be reached. These uncertainties limit the usability of
1Roche Pharma Research and Early Development, Roche Innovation Center
Basel, F. Hoffmann–La Roche Ltd., Grenzacherstrasse 124, 4070 Basel, Switzerland.
2Department of Basic Medical Science, Neuroscience and Sense Organs, University of
Bari‘Aldo Moro’, 70121 Bari, Italy.3Department of Cognitive Neuroscience, Donders
Institute for Brain, Cognition and Behaviour, Centre for Cognitive Neuroimaging,
Radboud University Nijmegen Medical center, Nijmegen 6525 EN, Netherlands.4Brain
& Mental Health Laboratory, Monash Institute of Cognitive and Clinical Neurosciences and School of Psychological Sciences, Monash University, Clayton, VIC 3800, Australia.
5
Pôle Universitaire de Psychiatrie de l'Enfant et de l'Adolescent, Hôpital Charles Perrens
Bordeaux, 33076 Bordeaux, France.6INSERM, National Biobank Infrastructure, 75013
Paris, France.7INSERM, Clinical Research Department, 75014 Paris, France.8Institut
Roche, 92100 Boulogne-Billancourt, France.9Hôpitaux Universitaires Mondor, DHU
PePSY, Pôle de psychiatrie, Faculté de Médecine, Université Paris Est, INSERM U955, IMRB, Equipe 15, Psychiatrie Translationnelle, Fondation FondaMental, 94000 Créteil,
France.10NeuroSpin, UNIACT Lab, Psychiatry Team, CEA Saclay, 91191 Gif-Sur-Yvette,
France.11Institute of Psychiatry, Psychology & Neuroscience, King’s College London,
De Crespigny Park, Denmark Hill, London SE5 8AF, UK.12Department of Applied
Psy-chology: Health, Development, Enhancement, and Intervention, University of Vienna,
1010 Vienna, Austria.13APHP, Robert Debré Hospital, Child and Adolescent Psychiatry
Department, Paris, France.14Pasteur Institute, 75019 Paris, France.15Therachon AG,
Aeschenvorstadt 36, 4051 Basel, Switzerland.16Institute of Neuroscience and Medicine,
Brain & Behaviour (INM-7), Research Centre Jülich, 52428 Jülich, Germany.17Institute of
Systems Neuroscience, Medical Faculty, Heinrich Heine University Düsseldorf, 40223 Düsseldorf, Germany.
*Corresponding author. Email: [email protected] (J.D.); stefan.holiga@ roche.com (S.H.)
by guest on May 19, 2020
http://stm.sciencemag.org/
functional connectivity as a potential diagnostic or treatment bio-marker for ASD.
Here, we aimed to address these inconsistent findings by performing a large-scale evaluation and characterization of functional connectivity alterations in ASD in four independent cohorts. More specifically, we used the EU-AIMS (European Autism Interventions–A Multicentre Study for Developing New Medications) LEAP (Longitudinal European Autism Project) dataset for exploration and the other three cohorts [ABIDE (Autism Brain Imaging Data Exchange) I, ABIDE II, and InFoR (Inserm, la Fondation FondaMental et Roche)] for replication. We further evaluated the link between these alterations and age, med-ication status, and clinical symptoms.
RESULTS
Clinical and demographic characteristics are comparable between patients with ASD and TD
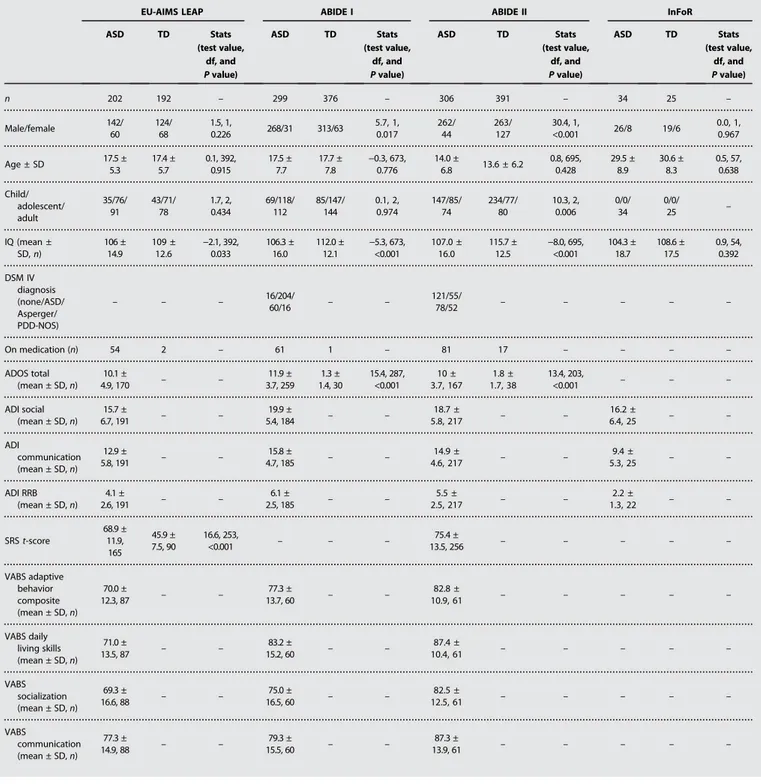
rs-fMRI data from four ASD cohorts (EU-AIMS LEAP, ABIDE I, ABIDE II, and InFoR) alongside with matched typically developing volunteers (TD) were included in the study (Table 1). The multicenter EU-AIMS LEAP and the single-center InFoR are prospective cohorts providing standardized rs-fMRI data alongside with various clinical parameters. ABIDE I and II represent large-scale retrospectively aggregated datasets provided by international brain imaging centers. Exclusion of individuals with low IQ and removal of poor image quality data resulted in exclusion of 35, 39, 33, and 14% of available EU-AIMS LEAP, ABIDE I, ABIDE II, and InFoR data, respectively [see Table 1 for final number of subjects (n)]. For all cohorts, mean age did not differ between individuals with ASD and TD and was comparable between EU-AIMS LEAP and ABIDE I (Table 1). ABIDE II cohort was signif-icantly younger (all P < 0.001), and the InFoR only comprised adult in-dividuals with ASD. A significantly higher fraction of males was observed in the ABIDE I and II as compared to EU-AIMS LEAP (ABIDE I, P < 0.001; ABIDE II, P = 0.005) and InFoR (for ABIDE I only, P = 0.042). Individuals with ASD in all cohorts had average IQ above 100, although lower than that for TD in all cohorts except InFoR (EU-AIMS LEAP, P = 0.033; ABIDE I and II, P < 0.001; InFoR, P = 0.392; Table 1).
Reproducible degree centrality alterations are observed in individuals with ASD
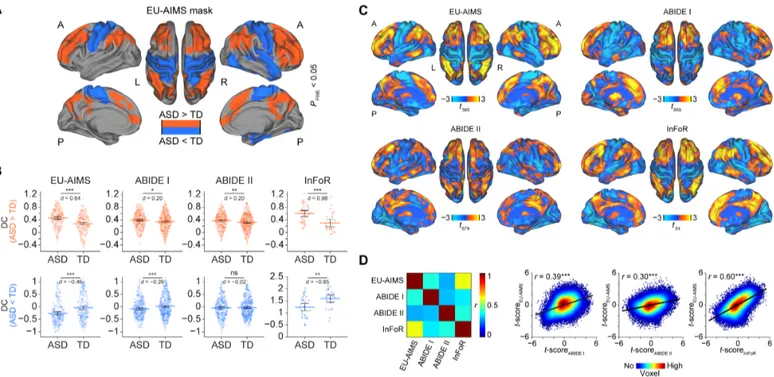
To test for functional connectivity differences between individuals with ASD and TD, we used the EU-AIMS LEAP dataset for exploratory analyses and the other three cohorts for replication. Degree centrality (DC) was chosen as an unbiased count-based functional connectivity measure that assigns to each voxel the sum of all correlation coefficients between the time series of that voxel and all other voxels in the brain exceeding a prespecified threshold. Group comparisons in the EU-AIMS cohort revealed significant DC increases in individuals with ASD in two clusters comprising bilateral parietal (P = 0.008): prefrontal and anterior and posterior cingulate regions (P = 0.001) (Fig. 1A and Table 2). Significantly decreased DC was observed in a cluster covering bilateral primary sensory-motor cortices and right temporal regions, in-sula, amygdala, and hippocampus (P < 0.001) (Fig. 1A). These results remained qualitatively and quantitatively similar to the initial findings after controlling for between-subject differences in motion (fig. S1 and table S1).
DC extracted from ABIDE I, ABIDE II, and InFoR based on the EU-AIMS LEAP DC increase mask revealed significant increases in
individuals with ASD in all three replication cohorts in the same areas showing increased connectivity in the exploratory cohort (ABIDE I, P = 0.011; ABIDE II, P = 0.01; InFoR, P < 0.001; Fig. 1B). Conversely, the DC decreases were successfully replicated in two of three cohorts (ABIDE I, P = 0.001; InFoR, P = 0.002) (Fig. 1B). We fur-ther evaluated the spatial similarity of the unthresholded DC alteration patterns by computing correlation coefficients between voxel-wise t-maps obtained for each cohort in the comparisons of ASD and TD (Fig. 1C). These analyses revealed significant correlations of the ASD profiles across all four cohorts (all P < 0.001; Fig. 1D).
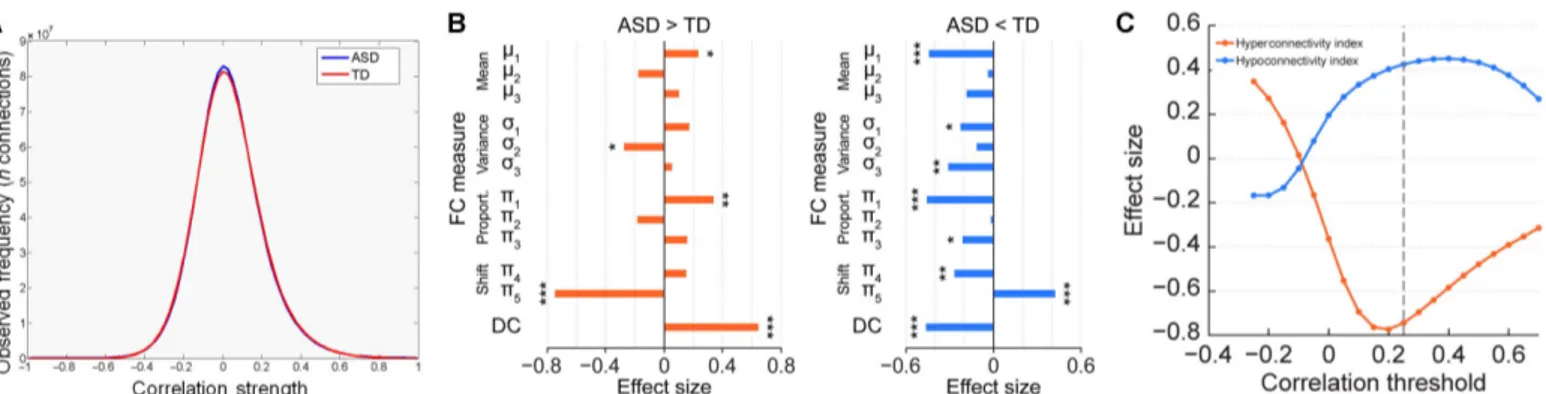
DC alterations in ASD are driven by shifts in connectivity Having identified replicable DC alterations in individuals with ASD, we aimed to explore the nature of these connectivity differences. To this end, we compared the whole-brain histograms of correlation coeffi-cients observed in individuals with ASD to TD, revealing a nearly iden-tical distribution of correlation strength (Fig. 2A). We next computed effect sizes for differentiation between individuals with ASD and TD for four types of metrics comparing means, variances, proportions, and shifts in connectivity within, outside, and from within to outside the identified DC alteration clusters (fig. S2). These analyses revealed that shifts in correlations from outside to inside the DC increase mask showed the largest effect size (Fig. 2B). This large effect reflects that, in ASD, voxels falling outside the DC increase mask show reduced connectivity to one another and an increased connectivity to voxels within the mask. This hyperconnectivity index was closely negatively correlated with the initial DC finding (r = −0.72; P < 0.001; n = 394) (fig. S3). In addition, reduced overall connectivity and reduced propor-tion of connected voxels were observed within the DC increase mask and an increased variance of connections outside the respective mask (Fig. 2B).
For the DC decrease findings, three indices revealed similar effect size as the initial DC finding: reduced mean connectivity and number of connected voxels within the DC decrease mask, and shift in connectivity from outside to inside the DC decrease mask (Fig. 2B). For the latter, the proportion of voxels connected to each other outside the DC decrease mask increased and the proportion of voxels connected from outside to inside decreased. Strong correlations were observed be-tween all these indices and the initial DC decrease findings (mean connectivity: r = 0.81, P < 0.001; proportion of connected voxels: r = 0.84, P < 0.001; shift in connectivity: r = −0.85, P < 0.001; n = 394) (fig. S3). As the shift in connectivity showed the strongest cor-relation with the initial DC findings, this hypoconnectivity index was selected for further testing of associations with clinical symptoms.
The further exploration in the EU-AIMS LEAP dataset of the choice of correlational threshold for DC computation on the observed differ-entiation between ASD and TD revealed a maximum differdiffer-entiation for the hyper- and hypoconnectivity index at r = 0.15 and r = 0.4, respec-tively (Fig. 2C). For both indices, the effect size for differentiation be-tween ASD and TD obtained at the initially chosen DC threshold (r = 0.25) recommended by the literature (26) was very close to the max-imum observed with those optimized thresholds. These results support the use of the recommended threshold for DC-based analyses of the ASD population.
To better understand the spatial specificity of the observed shifts from outside to inside the respective DC masks for both hyper-and hypoconnectivity indices, we have additionally recomputed both indices by splitting the outside regions into cortical, sub-cortical, or cerebellar regions of interest. Only the cortico-cortical
by guest on May 19, 2020
http://stm.sciencemag.org/
shifts in connectivity revealed significant (P < 0.001) and numeri-cally larger effect sizes for differentiation between ASD and TD than the initial whole-brain hyper- and hypoconnectivity indices (Table 3). No significant differences were observed for both indices when using subcortical and cerebellar outside regions, with effect sizes close to zero (Table 3).
Connectivity differences are linked to demographic and clinical factors
We next evaluated whether and how these hyper- and hypoconnec-tivity indices relate to clinical characteristics, age, sex, medication, and psychiatric comorbidity status in individuals with ASD. First, we used t tests to evaluate whether the hyper- and hypoconnectivity
Table 1. Clinical and demographic characteristics. ADI, autism diagnostic interview; ADOS, autism diagnostic observation schedule; PDD-NOS, pervasive developmental disorder not otherwise specified; RRB, restricted and repetitive behaviors; SRS, social responsiveness scale.
EU-AIMS LEAP ABIDE I ABIDE II InFoR
ASD TD Stats (test value, df, and P value) ASD TD Stats (test value, df, and P value) ASD TD Stats (test value, df, and P value) ASD TD Stats (test value, df, and P value) n 202 192 – 299 376 – 306 391 – 34 25 – Male/female 142/ 60 124/ 68 1.5, 1, 0.226 268/31 313/63 5.7, 1, 0.017 262/ 44 263/ 127 30.4, 1, <0.001 26/8 19/6 0.0, 1, 0.967 Age ± SD 17.5 ± 5.3 17.4 ± 5.7 0.1, 392, 0.915 17.5 ± 7.7 17.7 ± 7.8 −0.3, 673, 0.776 14.0 ± 6.8 13.6 ± 6.2 0.8, 695, 0.428 29.5 ± 8.9 30.6 ± 8.3 0.5, 57, 0.638 Child/ adolescent/ adult 35/76/ 91 43/71/ 78 1.7, 2, 0.434 69/118/ 112 85/147/ 144 0.1, 2, 0.974 147/85/ 74 234/77/ 80 10.3, 2, 0.006 0/0/ 34 0/0/ 25 – IQ (mean ± SD, n) 106 ± 14.9 109 ± 12.6 −2.1, 392, 0.033 106.3 ± 16.0 112.0 ± 12.1 −5.3, 673, <0.001 107.0 ± 16.0 115.7 ± 12.5 −8.0, 695, <0.001 104.3 ± 18.7 108.6 ± 17.5 0.9, 54, 0.392 DSM IV diagnosis (none/ASD/ Asperger/ PDD-NOS) – – – 16/204/60/16 – – 121/55/78/52 – – – – – On medication (n) 54 2 – 61 1 – 81 17 – – – – ADOS total (mean ± SD, n) 10.1 ± 4.9, 170 – – 11.9 ± 3.7, 259 1.3 ± 1.4, 30 15.4, 287, <0.001 10 ± 3.7, 167 1.8 ± 1.7, 38 13.4, 203, <0.001 – – – ADI social (mean ± SD, n) 15.7 ± 6.7, 191 – – 19.9 ± 5.4, 184 – – 18.7 ± 5.8, 217 – – 16.2 ± 6.4, 25 – – ADI communication (mean ± SD, n) 12.9 ± 5.8, 191 – – 15.8 ± 4.7, 185 – – 14.9 ± 4.6, 217 – – 9.4 ± 5.3, 25 – – ADI RRB (mean ± SD, n) 4.1 ± 2.6, 191 – – 6.1 ± 2.5, 185 – – 5.5 ± 2.5, 217 – – 2.2 ± 1.3, 22 – – SRS t-score 68.9 ± 11.9, 165 45.9 ± 7.5, 90 16.6, 253, <0.001 – – – 75.4 ± 13.5, 256 – – – – – VABS adaptive behavior composite (mean ± SD, n) 70.0 ± 12.3, 87 – – 77.3 ± 13.7, 60 – – 82.8 ± 10.9, 61 – – – – – VABS daily living skills (mean ± SD, n) 71.0 ± 13.5, 87 – – 83.2 ± 15.2, 60 – – 87.4 ± 10.4, 61 – – – – – VABS socialization (mean ± SD, n) 69.3 ± 16.6, 88 – – 75.0 ± 16.5, 60 – – 82.5 ± 12.5, 61 – – – – – VABS communication (mean ± SD, n) 77.3 ± 14.9, 88 – – 79.3 ± 15.5, 60 – – 87.3 ± 13.9, 61 – – – – – by guest on May 19, 2020 http://stm.sciencemag.org/ Downloaded from
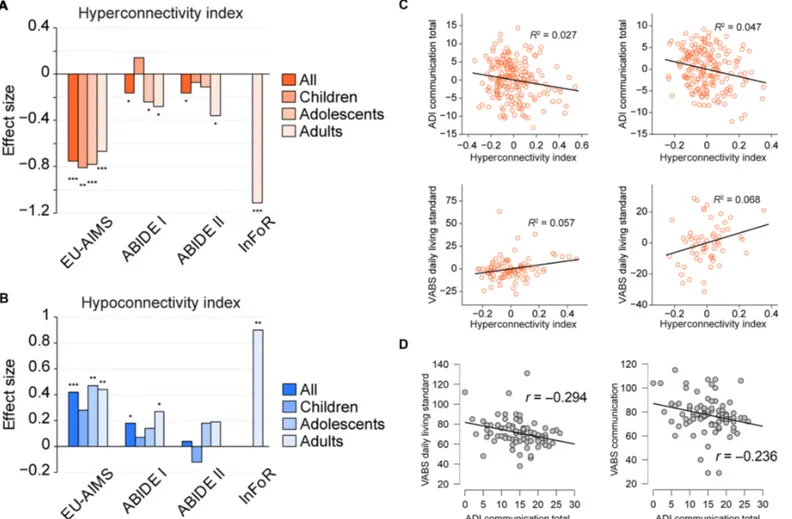
alterations persisted when splitting the cohorts into children, adoles-cents, and adults. As InFoR only comprised adults, these analyses were restricted to the other cohorts. For the hyperconnectivity index, significant differences and similar effect sizes were observed for all
age groups in the EU-AIMS LEAP cohort (all P < 0.001; Fig. 3A). In other cohorts, significant differences between individuals with ASD and TD were observed for adolescents (ABIDE I only, P = 0.028) and adults (ABIDE I, P = 0.014; ABIDE II, P = 0.015) but not for children
Fig. 1. Outcomes of DC comparisons between individuals with ASD and TD. (A) Representative reconstruction of a brain illustrating regions showing significant DC
increases (red) and decreases (blue) in individuals with ASD in the reference EU-AIMS LEAP cohort. (B) Distribution of DC values (first eigenvariate over the masks’ voxels)
across subjects for the hyperconnected (top row, red) and hypoconnected (bottom row, blue) network separately for individuals with ASD and TD. (C) Unthresholded t-maps showing regions with increased (warm colors) and decreased (cold colors) DC in individuals with ASD as compared to TD. (D) Spatial correspondence of the t-maps between the reference dataset (EU-AIMS LEAP) and all remaining replication datasets (ABIDE I, ABIDE II, and InFoR) in the form of a pairwise correlation
matrix and individual correlation plots. A, anterior; d, Cohen’s d effect size; FWE, family-wise error; L, left; P, posterior; R, right; ns, not significant. *P < 0.05, **P < 0.01,
***P < 0.001 as obtained using independent-samples t tests (B) and Pearson correlation analyses (D).
Table 2. Regions showing significant DC differences in the EU-AIMS LEAP cohort between individuals with ASD and TD.
Contrast Anatomical
region
Cluster size Exact cluster
P value
T value MNI coordinates
[x y z]
ASD > TD
Bilateral: Parietal, posterior cingulate, precuneus, primary visual
3066 0.008 5.35* −33 54 39
ASD > TD
Bilateral: Lateral and medial prefrontal, premotor, supplementary motor, anterior cingulate 4851 0.001 5.33* 36 42 3 Right: Anterior insula, caudate TD > ASD
Bilateral: Primary sensory, primary motor, middle cingulate
5777 <0.001 5.41* 12–33 69
Right: Posterior insula, temporal cortex, amygdala, hippocampus, entorhinal
*Significant at a whole-brain voxel-wise family-wise error-corrected threshold of P < 0.05.
by guest on May 19, 2020
http://stm.sciencemag.org/
(Fig. 3A). The hypoconnectivity index showed consistently larger ef-fect sizes in the adolescent and adult populations as compared to children in all three cohorts (Fig. 3B). In formal testing for age category–by–diagnosis interactions on the hyper- and hypoconnec-tivity indices using analysis of variance (ANOVA), no significant in-teractions were observed (table S2).
In ANOVA testing for the effects of sex on the observed hyper-and hypoconnectivity indices, no significant sex-by-diagnosis group interactions were observed for any of the cohorts (all P > 0.1) (table S2). A significant effect of psychotropic medication on functional connectivity was only found for DC increases in the EU-AIMS LEAP cohort with individuals, with ASD on medication being closer to the TD population (table S3). Psychiatric comorbidity status was only available for a subsample of the ABIDE II cohort. There was no significant difference between ASD with and without comorbidity diagnoses with respect to DC increases (t187= 0.1; P = 0.903),
de-creases (t187=−1.0; P = 0.335), or derived hyperconnectivity (t187=
0.6; P = 0.582) and hypoconnectivity (t187= 1.5; P = 0.147) indices
(fig. S4). Psychiatric comorbidity and medication status were only weakly associated in that sample (Kendall’s tau = 0.18; P = 0.014) (table S4).
After a similar exploration and replication strategy as for group comparisons, 12 general linear models (GLMs) were computed in the
EU-AIMS LEAP dataset to evaluate whether the obtained hyper- and hypoconnectivity indices are linked to clinical severity (table S5). These analyses revealed overall two significant relationships between the hy-perconnectivity index and ADI communication subscale (P = 0.026) and Vineland Adaptive Behavior Scale [VABS; (27)] daily living skills standard score (P = 0.024) (Table 4 and table S5). Stronger connectivity alterations were associated with stronger clinical impairment (Fig. 3C). In replication analyses, both relationships found in EU-AIMS LEAP were also significant in the ABIDE I cohort (ADI communication, P = 0.004; VABS daily living skills, P = 0.048) but not in the substantially younger ABIDE II subset (Table 4 and table S6). In an additional ex-ploratory analysis of the EU-AIMS LEAP cohort, we examined the correlational structure between the identified ADI communication subscale and the VABS subscales. This analysis was performed to better understand why VABS daily living skills (but not the corresponding communication subdomain) were associated with the hyperconnec-tivity index. ADI communication subscale was numerically more strongly associated with VABS daily living skills (r = −29; P = 0.006) than with the VABS communication (r = −0.24; P = 0.029) subdomain (Fig. 3D).
Understanding relationship to underlying structure
Last, we aimed to evaluate whether the observed DC alterations or the extracted ASD hyper- and hypoconnectivity indices were related to underlying gray matter structure or to previously reported white matter alterations (whole cerebral white matter and corpus callosum subre-gions) (28). For this, we first compared the respective volumetric information between ASD and TD and then correlated the respective structural information with the identified functional connectivity altera-tions. Overall, white (P = 0.017) and splenium of corpus callosum mat-ter (P = 0.014) were reduced in ASD displaying yet small effect sizes (table S7). Gray matter volume in the selected regions and genu and body of corpus callosum were not significantly different between ASD and TD. Only white matter in genu of corpus callosum but none of the other structural information was significantly correlated with the DC increase values (r = −0.1; P = 0.043) and the respective ASD hyper-connectivity index (r = 0.1; P = 0.04), with lower genu volume being associated with stronger rs-fMRI alterations (table S8).
Fig. 2. Functional connectivity indices and their effect size. (A) Distribution of the Pearson’s correlation coefficients between pairs of voxel-wise blood oxygen level
dependence activity time courses observed in ASD and TD in the EU-AIMS LEAP cohort. (B) Effect sizes of the functional connectivity indices based on DC masks for the
contrasts ASD > TD (left) and TD > ASD (right). Indices: mean connectivity (m), variance of connectivity (s), and proportion of connected voxels (p) within (1), outside (2),
and from within to outside (3) the DC alteration masks and shifts in connectivity from within to outside (p4) and from outside to within (p5) the DC alteration mask.
Details on computation are provided in fig. S2. *P < 0.05, **P < 0.01, ***P < 0.001 as obtained using independent-samples t tests. (C) Effect size for the hyper- and hypoconnectivity indices obtained in the EU-AIMS LEAP dataset plotted versus the applied correlational threshold. Dashed line indicates the correlational threshold used for the initial DC computation.
Table 3. Effect sizes and P values for the hyper- and hypoconnectivity indices computed using cortical, subcortical, and cerebellar subre-gions comparing ASD and TD.
“Outside” region Hyperconnectivity
index (Cohen’s d; P) Hypoconnectivity index (Cohen’s d; P) Cerebellar −0.12; 0.233 0.05; 0.619 Cortical −0.76; <0.001 0.46; <0.001
Subcortical 0.05; 0.604 −0.10; 0.332 by guest on May 19, 2020
http://stm.sciencemag.org/
DISCUSSION
Here, we provide evidence of reproducible functional hyper- and hypoconnectivity alterations in individuals with ASD, as demon-strated across several large single- and multicenter cohorts. We fur-ther show that these alterations persisted when controlling for motion and medication effects and were linked to clinical symp-toms as captured by several clinical and behavioral scales.
We reconcile previous divergent literature findings and report evi-dence of both functional hypo- and hyperconnectivity in individuals with ASD, with spatially varying signatures that are consistent with
some of the recent single-cohort evidence (10, 12, 19, 20). The identified hypo- and hyperconnectivity patterns that are based on a positive cor-relation threshold show spatial similarity across all cohorts, with the hy-poconnectivity being primarily restricted to sensory-motor regions and hyperconnectivity hubs being predominately located in prefrontal and parietal cortices. Both anatomical networks are consistent with some previous work reporting connectivity alterations in respective networks (10, 21, 29). Moreover, our results suggest that the identified alterations are primarily driven by cortico-cortical connectivity shifts with little to no cerebellar or subcortical contribution. These findings contrast with
Fig. 3. Relationships between hyper- and hypoconnectivity indices, age, and clinical outcomes. (A) Effect size of the hyperconnectivity index for all patients and split by age groups [children (<12 years), adolescents (12 to 18 years), and adults (>18 years)] for contrast ASD > TD (red). (B) Equivalent of (A) for the hypoconnectivity index (blue). (C) Correlations of the hyperconnectivity indices with ASD clinical scales in the EU-AIMS LEAP and ABIDE I datasets (adjusted for the effects of age, sex, site, and IQ). (D) Correlations between ADI communication and VABS daily living skills and communication subscales. *P < 0.05, **P < 0.01, ***P < 0.001 as obtained using independent-samples t tests.
Table 4. Results of correlations between hyper- and hypoconnectivity indices and clinical scales. Significant (P < 0.05) relationships between functional connectivity indices and respective clinical scales are indicated in bold.
Scale Connectivity measure EU-AIMS LEAP ABIDE I ABIDE II
ADI communication total Hyperconnectivity index F1,182= 5; P = 0.026 F1,171= 8.7; P = 0.004 F1,204= 0.3; P = 0.602
VABS daily living standard Hyperconnectivity index F1,80= 5.3; P = 0.024 F1,55= 4.1; P = 0.048 F1,55= 0.1; P = 0.75
by guest on May 19, 2020
http://stm.sciencemag.org/
some of the previous literature suggesting alterations in cerebro-cerebellar and cerebro-subcortical connectivity as a key alteration in ASD (30, 31). Substantial differences in preprocessing and methodology may account for some of these discrepancies. Consistent with some previous reports, we find the overall global connectivity to be preserved in ASD (21).
Anatomically, the DC increase regions closely correspond to the well-established central executive network (32–34). This network has been closely implicated in high-level cognitive functions such as planning, decision-making, and the control of attention and working memory (33). All of these functions have been consistently shown to be affected in ASD (35–37). Moreover, we demonstrate that the DC increases originate specifically from increased engagement of this network by regions outside the network. Similarly, DC decreases are mainly driven by disengagement of the sensory-motor network from other regions. However, we also observe a similar magnitude of reduced connectivity within the sensory-motor network, suggesting that both processes contribute to DC decreases. Biologically, these connectivity shifts may support the idea that individuals with ASD are unable to engage or disengage specific networks to the extent of TD and may therefore underlie deficits in mental switching and cogni-tive flexibility (35, 36).
Estimates of effect size range from small to very large across cohorts. The ABIDE I and II datasets are retrospectively established cohorts with large variation in diagnostic and inclusion criteria, sequence quality, scanning duration, and other parameters such as resting-state acquisi-tion instrucacquisi-tions. This variability may explain the observed low effect sizes. In contrast, the standardized multicenter EU-AIMS LEAP and the single-center InFoR cohort show a large effect size for the hypercon-nectivity and a moderate to large effect size for the hypoconhypercon-nectivity alterations, suggesting that these measures may have promise as strati-fication or treatment biomarkers for ASD. Although these results pro-vide a valuable first step demonstrating the existence of a consistent functional connectivity phenotype associated with ASD, they also, at the current stage, point to the limited usability of the respective altera-tions as a diagnostic biomarker considering the large overlap between ASD and TD. As a key focus of our study primarily in identification and replication of the respective alteration, a large amount of possible opti-mizations remains to be explored, including not only deployment of improved sequences but also evaluation of other than default processing parameters and further spatial dissection of respective alterations. All of these aspects may result in further increases in effect size, potentially lifting it to a clinically relevant magnitude.
The above results not only contribute to a growing consensus on the specific networks characterized by hyper- versus hypoconnectivity pro-files in ASD but also extend this work to demonstrate a key driver of ASD’s connectivity profile: the larger proportion of frontoparietal vox-els within our“DC increase” mask showing suprathreshold connectivity with voxels outside this mask, and the larger proportion of somato-sensory voxels within our“DC decrease” mask showing subthreshold connectivity with voxels outside this mask. Our somatosensory findings especially concord with emerging independent component-based analy-ses of the EU-AIMS LEAP and other cohorts (38), in which connectivity alterations in ASD are generally most pronounced when considering connectivity between networks. This concordance, despite different preprocessing and analysis methodologies, suggests ample robustness to the results reported here and motivate further characterization of the etiology, development, and clinical symptoms associated with these phenotypes in ASD. At the same time, we note that the most consistent ICA-based findings of between-network differences involve cerebellum,
which was only inconsistently acquired in the broader range of cohorts analyzed here. The role of cerebellar function in the broader ASD phenotype, and its relation to frontoparietal connectivity in particular, may be an important direction for future work (39). We do not find consistent age-by-diagnosis interactions on the identified hyper- and hypoconnectivity indices. Nonetheless, numerically, all cohorts show smaller effect size for the hypoconnectivity index in children, suggesting a potential increase of these alterations over age. As this index is not associated with any clinical scales, it may serve a more compensatory role that increases with age. In line with this hypothesis, previous studies reported age-related improvement among older individuals with ASD in terms of cognitive flexibility (40). The absence of the functional connectivity alterations in two of three children cohorts may also point to a potentially secondary role of the respective alterations, for example, emerging due to prolonged social interaction. However, other possible explanations such as differential neurodevelopmental trajectories or long-term exposure to medication are also possible. Prospective longi-tudinal studies are therefore essential to further dissect the role of the identified functional connectivity alterations in ASD.
In line with the idea of differential neurodevelopmental trajectories, a previous large diffusion tensor imaging study in toddlers with ASD demonstrated alterations in axon pathways connecting primarily pre-frontal and other brain regions (41), and these findings are also supported by an earlier postmortem study in ASD reporting altered white matter composition below prefrontal regions (42). The respective imaging study did not find any alterations in white mater connections in parietal regions. In line with that, the visualization of voxel-wise DC provided in our study illustrates a more dominant prefrontal pattern in both ABIDE cohorts, whereas the parietal effects are primarily observed in both EU-AIMS and the adult-only InFoR cohort. This discrepancy may point to the rather later emergence of the parietal alterations and also to some extent explain the low effect size in the younger ABIDE II cohort when extracting the signal from the whole fronto-parietal network identified in the EU-AIMS LEAP dataset. Supportively, the on-ly associations between structural and functional information identified in our study was the correlation of fronto-parietal DC and the respective hyperconnectivity index with white matter in genu of corpus callosum connecting specifically prefrontal regions to each other. The direction-ality of these correlations points to larger alterations in both resting-state measures being associated with lower genu volume. However, the rather weak nature of this association combined with the much low-er effect size for the white mattlow-er altlow-erations also point to a largely independent contribution of both endophenotypes with stronger relevance of the identified functional connectivity alterations going beyond changes in underlying structure. Our results also support the idea of an altered topology in ASD with a spatially distinct pattern of between-network connections, with both hyper- and hypoconnec-tivity being present (43).
When evaluating the link between imaging and clinical features, we find that the extent of hyperconnectivity abnormalities is correlated with autism symptoms in two of three cohorts. Hyperconnectivity was associated with ADI communication functioning as well as VABS daily living skills but not the respective VABS communication subscale. Greater connectivity alterations are thereby associated with greater se-verity of respective symptoms. Additional exploratory analyses illustrated the rather weak relationship between deficits captured by the corresponding ADI and VABS subscales, suggesting that VABS dai-ly living skills are more closedai-ly correlated with ADI communication scores. A potential reason for this closer link to VABS daily living skills
by guest on May 19, 2020
http://stm.sciencemag.org/
may be due to ADI collecting information about ASD-specific commu-nication deficits historically observed in daily living rather than differ-entiating these subdomains in terms of current functioning, as assessed by the VABS. These findings further support the idea that these altera-tions may reflect pathological processes related to skills needed for development of personal independence and social communication abilities. We also failed to replicate this association in the, on average, 6 to 10 years younger ABIDE II subpopulation. Considering that ABIDE II children diagnosed with ASD do not show any detectable connectivity abnormalities, the lack of significant correlation with clinical symptoms in this cohort is not unexpected. Overall, further research is needed to understand the specific reasons for these dis-crepant findings. Potential confounding effects of medication on functional connectivity have been raised for previous ASD studies (24). Here, we did not find consistent effects of psychotropic medi-cation on the functional connectivity measures, with the only effect pointing to reduced functional connectivity alterations with psycho-tropic medication use. On one side, the rather low effect size of those associations limits their immediate usability as potential surrogate efficacy readouts. On the other side, the large effect size in the stan-dardized cohorts, the link to the clinical symptoms, and, if replicated, the preliminary evidence in one of the cohorts that ASD medication may move the networks closer to TD warrant further exploration of these alterations as a potentially more sensitive and earlier pharma-codynamic readout for treatment evaluation. Similarly, in the only cohort (ABIDE II) where psychiatric comorbidity status was consistently provided, we did not find any evidence of its impact on the observed functional connectivity alterations. Although these results are consistent with the notion that the observed imaging al-terations are specific to ASD, further analysis of broader cohorts is needed to fully address the question of specificity.
For statistical and data quality reasons, we have excluded for all analyses data of individuals with ASD with low IQ or where imaging quality including excessive motion did not meet prespecified criteria. More specifically, motion is critically discussed in the literature as a potential contributor or even driver of functional connectivity altera-tions observed in previous studies (44, 45). Similarly, low IQ is often associated with specific factors such as genetic etiologies or prenatal events including exposure to specific drugs (46–49). Those factors are likely to increase variability of the overall population, potentially redu-cing the sensitivity to detect specific between-group differences. In ad-dition, the low prevalence of low IQ subjects was not equally distributed across cohorts and between ASD and TD in the EU-AIMS dataset, inducing an additional statistical bias that we aimed to avoid. It was therefore critical for interpretation of our findings to minimize any pos-sible confounding effects associated with both factors by excluding these subjects. Nonetheless, although these exclusion criteria are important to enable more clear interpretation of the outcomes, they also limit the generalizability of our findings to the excluded patient populations. In addition, also the role of other potential confounding factors such as the presence of specific neurological conditions or congenital malforma-tions may have contributed to observed differences and needs to be explored in future studies, collecting detailed information on the respective aspects.
Last, we did not use the InFoR dataset for replication of the clinical associations; considering the rather weak nature of the observed asso-ciations in the EU-AIMS LEAP cohort, the InFoR dataset did not pro-vide sufficient power (only 12% power based on power analysis using G-Power) to detect the respective associations.
In conclusion, we provide evidence of reproducible hyper- and hy-poconnectivity alterations in individuals with ASD. These alterations are mainly driven by shifts in connectivity from within to outside the respective networks and are partially associated with core clinical def-icits observed in ASD.
MATERIALS AND METHODS Study design
The primary objective of the study was to identify and independently replicate rs-fMRI–based functional connectivity alterations associated with ASD as compared to TD. Furthermore, we aimed to understand the specific nature of these alterations and whether they are associated with methodological, demographic, or clinical factors known to affect rs-fMRI–derived measures. Last, we explored whether these functional connectivity alterations are linked to core clinical symptoms observed in ASD. To enable an accurate identification and replication of functional connectivity alterations in ASD, four cross-sectional datasets were in-cluded into the study (Table 1, Supplementary Materials and Methods, and tables S9 to S11): EU-AIMS LEAP (www.eu-aims.com), ABIDE I, ABIDE II, and InFoR (10, 50–52). All cohorts acquired rs-fMRI data (Supplementary Materials and Methods, tables S12 to S15) in individ-uals with ASD and TD along with other cohort-specific measures. Only individuals with ASD with average range IQ (>70) were included for further analyses to reduce variability associated with low-functioning ASD (53). A further statistical reason for exclusion of this population was in the strong imbalance in the EU-AIMS dataset, with more than twice as many individuals with ASD meeting this criterion as compared to TD. In addition, only few subjects meeting this criterion were avail-able in all replication cohorts. In brief, EU-AIMS LEAP cohort is a large well-characterized multicenter cohort of individuals with ASD and TD. EU-AIMS LEAP recruitment was performed using existing local data-bases, clinic contacts, and local and national support groups. TD were recruited via mainstream schools, flyers, and existing databases. ABIDE I and II provide large, retrospectively aggregated multicenter data with varying diagnostic and recruitment criteria, rs-fMRI sequences, and clinic scales. InFoR is a smaller single-center cohort with standardized imaging assessments. As the only large cohort with standardized imag-ing assessments and inclusion/exclusion criteria, the EU-AIMS LEAP dataset was selected for exploratory analyses. The three other cohorts were used for replication of the identified functional connectivity altera-tions. All studies were approved by local ethics committees. Further de-tails on rs-fMRI data collection and preprocessing are provided in Supplementary Materials and Methods.
Statistical analyses
Identifying functional connectivity alterations
Given the divergent previous findings on functional connectivity altera-tions in ASD, we followed an unbiased exploratory approach by com-puting a simple connectivity metric [DC, (54)] to compare individuals with ASD and TD. DC is a count-based measure that assigns to each voxel the sum of all correlation coefficients between the time series of that voxel and all other voxels in the brain exceeding a prespecified threshold (r > 0.25) (26). Only positive correlations were included to avoid spurious negative correlations that may arise from global signal regression (55). This threshold was recommended in previous studies using DC to eliminate counting voxels that had low temporal correla-tion attributable to signal noise (26). All further group comparison and correlational analyses were controlled for site, sex, age, and IQ effects.
by guest on May 19, 2020
http://stm.sciencemag.org/
As compared to many other connectivity approaches proposed in the literature, DC does not require specific assumptions about the location of the signal and can be computed on a voxel-wise basis. Although di-mensionality reduction techniques, such as independent component analysis, are also often applied in the literature to evaluate functional connectivity, they are less optimal for the key focus of our study, which was in replication across different cohorts. Solutions provided by such algorithms are often highly susceptible to differences across study po-pulations such as sample size, demographics, and scanner and sequence differences. Also, there is no consistent approach for matching the iden-tified components across cohorts. The DC approach was therefore cho-sen for the replication focus of this study.
The resulting DC maps for EU-AIMS were entered into a voxel-wise GLM comparing individuals with ASD and TD. A liberal voxel-wise un-corrected threshold of P < 0.05 combined with an exact permutation-based (1000 permutations) family-wise error-corrected cluster threshold of P < 0.05 was used in those analyses to test for significance (56). All analyses were controlled for site, sex, age, and IQ effects. Identical GLM designs were then created for ABIDE I, ABIDE II, and InFoR data. Weighted mean DC signals (first eigenvariate) were extracted for the three replication cohorts based on EU-AIMS LEAP findings. Effect sizes (Cohen’s d) and independent-samples t tests were computed com-paring DC values between individuals with ASD and TD (P < 0.05). We then tested whether the whole-brain DC alteration patterns observed in ASD are similar across the cohorts by computing correlations between the unthresholded t-maps (degrees of freedom for P-value computation are based on the number of resolution elements in the images provided by SPM12) (Fig. 1, C and D). As residual motion effects have been re-peatedly criticized as potential sources of observed functional connectivity differences between ASD and TD (57), we have computed mean translational and rotational motion and frame-wise displacement and compared it between ASD and TD using t tests (table S1). As the mean frame-wise displacement was significantly higher in ASD as com-pared to TD, we have also recomputed all analyses by additionally controlling for the effects of the motion parameters in the between-group comparison. For this, we added mean translational and rotational motion and mean translational and rotational frame-wise displacement for each subject as additional covariates of no interest and recomputed the above analyses.
Understanding the nature of functional connectivity alterations
Although DC provides evidence of altered functional connectivity, it does not allow conclusions on the nature of those alterations. For exam-ple, DC changes could arise from alterations in mean strength and/or variance of the underlying connectivity, or shifts in connectivity from within to outside of the respective networks. To better understand the observed functional connectivity alterations, we first computed subject-specific pairwise correlations between time courses of all voxels in the brain. On the basis of these correlations, we computed the following four types of connectivity indices within and outside regions showing DC alterations as defined in fig. S2: (i) mean connectivity of all voxels (Fisher’s z-transformed), (ii) variance of connectivity of all voxel-wise correlations (Fisher’s z-transformed), (iii) proportion of connected voxels, and (iv) shifts in connectivity from inside to outside the respec-tive regions.
Effect sizes and t tests comparing individuals with ASD and TD were then computed for each of the above indices. To test whether these in-dices reflect the initial DC changes, we computed correlations between both in the EU-AIMS LEAP dataset. Indices showing strongest
corre-lation with initial DC increase and decrease findings and a similar or higher effect size were selected for further evaluations. These two indices providing a more refined view on functional connectivity alterations were extracted for the three replication cohorts and used for further analyses. Both indices are further referred to as hyper- and hypoconnec-tivity indices.
We further examined how far the initial choice of the correlational threshold used for DC computation affected the effect sizes observed with both indices. For this, we systematically varied in the EU-AIMS LEAP dataset the correlational threshold from−0.25 to 0.7, computing the effect sizes for differentiation between ASD and TD.
Last, as previous studies reported potential differences in between-network connectivity alterations in cortical, subcortical, and cerebellar regions, we have additionally computed the effect sizes and t tests comparing ASD and TD for the above two indices by recomputing them using, for outside regions, either cortical, subcortical, or cerebel-lar masks as described below (30, 31).
Evaluation of cortical, subcortical, and cerebellar hyper- and hypoconnectivity indices
To recompute the identified hyper- and hypoconnectivity indices splitting the outside regions into cortical, subcortical, and cerebellar subregions, we masked the outside regions (outside the respective DC increase and decrease masks) using the automated anatomical labeling (AAL) atlas. Thereby, an inclusive mask was computed between the outside DC masks and a cortical mask pooling all cortical AAL regions. Similarly, an inclusive mask was computed between the DC outside masks and subcortical regions pooling caudate, putamen, and thalamic AAL regions. For cerebellum mask, all AAL cerebellum and vermis re-gions were used. The hyper- and hypoconnectivity indices as defined in equationp5in fig. S2 were recomputed for the obtained cortical,
sub-cortical, and cerebellar masks.
Understanding the link between imaging findings and clinical and demographic factors
Having identified the hyper- and hypoconnectivity indices as replicable ASD biomarkers, we next investigated their relationship to clinical symptoms, medication status, age, and sex. To test for differential effects of age, we split the cohorts into three age categories: children (below 12), adolescents (age between 12 and 18), and adults (age above 18). Hyper-and hypoconnectivity indices between ASD patient Hyper-and respective TD populations were compared by computing effect sizes and t tests (controlling for overall age effects, sex, site, and IQ). As based on the outcomes of the overall cohort we had clear directionality hypotheses, a one-sided P < 0.05 was applied. In addition, we formally tested for age-by-diagnosis interactions (three age categories) using ANOVAs controlling for sex, site, and IQ. Similarly, to test for the effects of sex, we computed ANOVAs testing for sex-by-diagnosis interactions controlling for age, site, and IQ. We further evaluated for each cohort whether psychotropic medication interferes with the observed func-tional connectivity alterations. Because detailed medication infor-mation on specific drugs, dose, or duration was not available, we restricted the analyses to t tests comparing DC and hyper- and hy-poconnectivity indices between patients on and off psychotropic medication. In addition, we aimed to evaluate whether psychiatric comorbidity and concomitant medication status might also contrib-ute to the observed functional connectivity alterations. For a sub-cohort of ABIDE II, the psychiatric comorbidity status was also available (n = 189, 72 with comorbidities). For this subcohort, we computed t tests comparing the obtained DC and respective hyper-and hypoconnectivity indices (adjusted for age, sex, site, hyper-and IQ) hyper-and
by guest on May 19, 2020
http://stm.sciencemag.org/
explored the relationship between medication and comorbidity sta-tus using Kendall’s tau.
To test for potential relationships between hyper- and hypoconnec-tivity indices and clinical scales, we followed a similar exploration and replication strategy as for the group comparisons. Because of few over-laps regarding clinical scales and a much smaller number of patients than in the exploration sample, InFoR was not used for these analyses. Separate GLMs (as implemented in SPSS) were computed using the hyper- and hypoconnectivity indices to predict clinical severity in the EU-AIMS LEAP individuals with ASD (table S6). Significant (P < 0.05, two-sided) relationships identified in the EU-AIMS cohort were selected for replication in ABIDE I and II using identical GLMs. In ad-dition, we explored the interrelationship of the ADI and VABS sub-scales, showing a significant association with the hyper- and hypoconnectivity indices in the EU-AIMS LEAP dataset by computing Pearson correlations among the respective measures.
Understanding relationship to underlying structure
Last, we aimed to evaluate whether the observed functional connectivity alterations are related to potential underlying gray matter structural changes, because between-group structural differences may confound the effects seen on functional connectivity (58). To address this question, two types of analyses were performed using eigenvariates of gray matter volumes extracted using both DC masks and adjusted for age, sex, site, IQ, and total intracranial volume: (i) group comparisons of ASD and TD using two-sample t tests and (ii) Pearson’s correlations between gray matter volumes and respective DC and hyper- and hypoconnectivity in-dices. In addition, because previous studies have reported reduced white matter and specifically corpus callosum volumes in ASD, we repeated both types of analyses using white matter volumes extracted from the respective regions using the Jülich white matter atlas (whole white mat-ter, corpus callosum, genum, body, and splenium) (28, 59).
SUPPLEMENTARY MATERIALS
www.sciencetranslationalmedicine.org/cgi/content/full/11/481/eaat9223/DC1 Materials and Methods
Fig. S1. Significant DC differences between ASD and TD observed in the EU-AIMS LEAP dataset with and without control for motion in the group comparisons.
Fig. S2. Connectivity indices computed based on the identified DC alterations.
Fig. S3. Correlations between the initial DC findings and derived connectivity indices showing the largest effect sizes for differentiation between ASD and TD.
Fig. S4. Plots of comorbidity status versus DC and hyper- and hypoconnectivity indices from ABIDE II cohort.
Table S1. Mean motion in ASD and TD.
Table S2. Results of analyses of variance testing for age category–by–diagnosis and sex-by-diagnosis interactions on the hyper- and hypoconnectivity indices. Table S3. Effects of medication on functional connectivity measures.
Table S4. Contingency table of psychiatric comorbidity versus current medication status in ASD from ABIDE II.
Table S5. Outcomes of EU-AIMS LEAP GLM analysis using ASD indices to predict clinical scores. Table S6. Age characteristics of the ADI and VABS subpopulations used for correlation with clinical scales.
Table S7. Volumetric comparisons between ASD and TD in the EU-AIMS LEAP cohort. Table S8. Associations between structural and functional connectivity measures in the EU-AIMS LEAP cohort.
Table S9. Additional clinical characteristics of the EU-AIMS LEAP population. Table S10. Additional clinical characteristics of the ABIDE I population. Table S11. Additional clinical characteristics of the ABIDE II population.
Table S12. Summary of scanning parameters for each participating site in the EU-AIMS LEAP consortium.
Table S13. Summary of scanning parameters for each participating site in the ABIDE I cohort. Table S14. Summary of scanning parameters for each participating site in the ABIDE II cohort. Table S15. Summary of scanning parameters used in the InFoR cohort.
References (60, 61)
REFERENCES AND NOTES
1. American Psychiatric Association, Diagnostic and Statistical Manual of Mental Disorders (DSM-5) (American Psychiatric Association, 2013).
2. G. Baird, E. Simonoff, A. Pickles, S. Chandler, T. Loucas, D. Meldrum, T. Charman, Prevalence of disorders of the autism spectrum in a population cohort of children in South Thames: The special needs and autism project (SNAP). Lancet 368, 210–215 (2006).
3. C. J. Newschaffer, L. A. Croen, J. Daniels, E. Giarelli, J. K. Grether, S. E. Levy, D. S. Mandell, L. A. Miller, J. Pinto-Martin, J. Reaven, A. M. Reynolds, C. E. Rice, D. Schendel, G. C. Windham, The epidemiology of autism spectrum disorders. Annu. Rev. Public Health 28, 235–258 (2007).
4. S. H. Baum, R. A. Stevenson, M. T. Wallace, Behavioral, perceptual, and neural alterations in sensory and multisensory function in autism spectrum disorder. Prog. Neurobiol. 134, 140–160 (2015).
5. M. Sahin, M. Sur, Genes, circuits, and precision therapies for autism and related neurodevelopmental disorders. Science 350, aab3897 (2015).
6. M. K. Belmonte, G. Allen, A. Beckel-Mitchener, L. M. Boulanger, R. A. Carper, S. J. Webb, Autism and abnormal development of brain connectivity. J. Neurosci. Off. J. Soc. Neurosci. 24, 9228–9231 (2004).
7. M. P. van den Heuvel, H. E. Hulshoff Pol, Exploring the brain network: A review on resting-state fMRI functional connectivity. Eur. Neuropsychopharmacol. 20, 519–534 (2010). 8. M. D. Fox, M. E. Raichle, Spontaneous fluctuations in brain activity observed with
functional magnetic resonance imaging. Nat. Rev. Neurosci. 8, 700–711 (2007). 9. S.-J. Weng, J. L. Wiggins, S. J. Peltier, M. Carrasco, S. Risi, C. Lord, C. S. Monk, Alterations of
resting state functional connectivity in the default network in adolescents with autism spectrum disorders. Brain Res. 1313, 202–214 (2010).
10. A. Di Martino, C.-G. Yan, Q. Li, E. Denio, F. X. Castellanos, K. Alaerts, J. S. Anderson, M. Assaf, S. Y. Bookheimer, M. Dapretto, B. Deen, S. Delmonte, I. Dinstein, B. Ertl-Wagner, D. A. Fair, L. Gallagher, D. P. Kennedy, C. L. Keown, C. Keysers, J. E. Lainhart, C. Lord, B. Luna, V. Menon, N. J. Minshew, C. S. Monk, S. Mueller, R.-A. Müller, M. B. Nebel, J. T. Nigg, K. O’Hearn, K. A. Pelphrey, S. J. Peltier, J. D. Rudie, S. Sunaert, M. Thioux, J. M. Tyszka, L. Q. Uddin, J. S. Verhoeven, N. Wenderoth, J. L. Wiggins, S. H. Mostofsky, M. P. Milham, The autism brain imaging data exchange: Towards a large-scale evaluation of the intrinsic brain architecture in autism. Mol. Psychiatry 19, 659–667 (2014).
11. M. Assaf, K. Jagannathan, V. D. Calhoun, L. Miller, M. C. Stevens, R. Sahl, J. G. O’Boyle, R. T. Schultz, G. D. Pearlson, Abnormal functional connectivity of default mode sub-networks in autism spectrum disorder patients. Neuroimage 53, 247–256 (2010). 12. C. L. Keown, P. Shih, A. Nair, N. Peterson, M. E. Mulvey, R.-A. Müller, Local functional
overconnectivity in posterior brain regions is associated with symptom severity in autism spectrum disorders. Cell Rep. 5, 567–572 (2013).
13. E. A. H. von dem Hagen, R. S. Stoyanova, S. Baron-Cohen, A. J. Calder, Reduced functional connectivity within and between‘social’ resting state networks in autism spectrum conditions. Soc. Cogn. Affect. Neurosci. 8, 694–701 (2013).
14. C. S. Monk, S. J. Peltier, J. L. Wiggins, S.-J. Weng, M. Carrasco, S. Risi, C. Lord, Abnormalities of intrinsic functional connectivity in autism spectrum disorders. Neuroimage 47, 764–772 (2009).
15. J.-J. Paakki, J. Rahko, X. Long, I. Moilanen, O. Tervonen, J. Nikkinen, T. Starck, J. Remes, T. Hurtig, H. Haapsamo, K. Jussila, S. Kuusikko-Gauffin, M.-L. Mattila, Y. Zang, V. Kiviniemi, Alterations in regional homogeneity of resting-state brain activity in autism spectrum disorders. Brain Res. 1321, 169–179 (2010).
16. A. Di Martino, Z. Shehzad, C. Kelly, A. K. Roy, D. G. Gee, L. Q. Uddin, K. Gotimer, D. F. Klein, F. X. Castellanos, M. P. Milham, Relationship between cingulo-insular functional connectivity and autistic traits in neurotypical adults. Am. J. Psychiatry 166, 891–899 (2009).
17. I. Dinstein, K. Pierce, L. Eyler, S. Solso, R. Malach, M. Behrmann, E. Courchesne, Disrupted neural synchronization in toddlers with autism. Neuron 70, 1218–1225 (2011). 18. J. S. Anderson, T. J. Druzgal, A. Froehlich, M. B. DuBray, N. Lange, A. L. Alexander,
T. Abildskov, J. A. Nielsen, A. N. Cariello, J. R. Cooperrider, E. D. Bigler, J. E. Lainhart, Decreased interhemispheric functional connectivity in autism. Cereb. Cortex 21, 1134–1146 (2011).
19. R.-A. Müller, P. Shih, B. Keehn, J. R. Deyoe, K. M. Leyden, D. K. Shukla, Underconnected, but how? A survey of functional connectivity MRI studies in autism spectrum disorders. Cereb. Cortex 21, 2233–2243 (2011).
20. K. Supekar, L. Q. Uddin, A. Khouzam, J. Phillips, W. D. Gaillard, L. E. Kenworthy, B. E. Yerys, C. J. Vaidya, V. Menon, Brain hyperconnectivity in children with autism and its links to social deficits. Cell Rep. 5, 738–747 (2013).
21. A. Hahamy, M. Behrmann, R. Malach, The idiosyncratic brain: Distortion of spontaneous connectivity patterns in autism spectrum disorder. Nat. Neurosci. 18, 302–309 (2015). 22. D. R. Dajani, L. Q. Uddin, Local brain connectivity across development in autism spectrum
disorder: A cross-sectional investigation. Autism Res. 9, 43–54 (2016).
23. L. Q. Uddin, K. Supekar, V. Menon, Reconceptualizing functional brain connectivity in autism from a developmental perspective. Front. Hum. Neurosci. 7, 458 (2013).
by guest on May 19, 2020
http://stm.sciencemag.org/
24. A. C. Linke, L. Olson, Y. Gao, I. Fishman, R.-A. Müller, Psychotropic medication use in autism spectrum disorders may affect functional brain connectivity. Biol. Psychiatry Cogn. Neurosci. Neuroimaging 2, 518–527 (2017).
25. A. Rausch, W. Zhang, C. F. Beckmann, J. K. Buitelaar, W. B. Groen, K. V. Haak, Connectivity-based parcellation of the amygdala predicts social skills in adolescents with autism spectrum disorder. J. Autism Dev. Disord. 48, 572–582 (2018). 26. R. L. Buckner, J. Sepulcre, T. Talukdar, F. M. Krienen, H. Liu, T. Hedden,
J. R. Andrews-Hanna, R. A. Sperling, K. A. Johnson, Cortical hubs revealed by intrinsic functional connectivity: Mapping, assessment of stability, and relation to Alzheimer’s disease. J. Neurosci. 29, 1860–1873 (2009).
27. S. S. Sparrow, in Encyclopedia of Clinical Neuropsychology (Springer, 2011), pp. 2618–2621. 28. A. Lefebvre, A. Beggiato, T. Bourgeron, R. Toro, Neuroanatomical diversity of corpus
callosum and brain volume in autism: Meta-analysis, analysis of the autism brain imaging data exchange project, and simulation. Biol. Psychiatry 78, 126–134 (2015).
29. E. W. Dickie, S. H. Ameis, S. Shahab, N. Calarco, D. E. Smith, D. Miranda, J. D. Viviano, A. N. Voineskos, Personalized intrinsic network topography mapping and functional connectivity deficits in autism Spectrum disorder. Biol. Psychiatry 84, 278–286 (2018).
30. L. Cerliani, M. Mennes, R. M. Thomas, A. D. Martino, M. Thioux, C. Keysers, Increased functional connectivity between subcortical and cortical resting-state networks in autism spectrum disorder. JAMA Psychiatry 72, 767–777 (2015).
31. A. J. Khan, A. Nair, C. L. Keown, M. C. Datko, A. J. Lincoln, R.-A. Müller, Cerebro-cerebellar resting-state functional connectivity in children and adolescents with autism spectrum disorder. Biol. Psychiatry 78, 625–634 (2015).
32. M. D. Greicius, B. Krasnow, A. L. Reiss, V. Menon, Functional connectivity in the resting brain: A network analysis of the default mode hypothesis. Proc. Natl. Acad. Sci. U.S.A. 100, 253–258 (2003).
33. V. Menon, Large-scale brain networks and psychopathology: A unifying triple network model. Trends Cogn. Sci. 15, 483–506 (2011).
34. W. W. Seeley, V. Menon, A. F. Schatzberg, J. Keller, G. H. Glover, H. Kenna, A. L. Reiss, M. D. Greicius, Dissociable intrinsic connectivity networks for salience processing and executive control. J. Neurosci. 27, 2349–2356 (2007).
35. E. Courchesne, J. Townsend, N. A. Akshoomoff, O. Saitoh, R. Yeung-Courchesne, A. J. Lincoln, H. E. James, R. H. Haas, L. Schreibman, L. Lau, Impairment in shifting attention in autistic and cerebellar patients. Behav. Neurosci. 108, 848–865 (1994). 36. B. A. Corbett, L. J. Constantine, R. Hendren, D. Rocke, S. Ozonoff, Examining executive
functioning in children with autism spectrum disorder, attention deficit hyperactivity disorder and typical development. Psychiatry Res. 166, 210–222 (2009).
37. E. M. Barendse, M. P. H. Hendriks, J. F. A. Jansen, W. H. Backes, P. A. M. Hofman, G. Thoonen, R. P. C. Kessels, A. P. Aldenkamp, Working memory deficits in high-functioning adolescents with autism spectrum disorders: Neuropsychological and neuroimaging correlates. J. Neurodev. Disord. 5, 14 (2013).
38. M. Oldehinkel, M. Mennes, A. Marquand, T. Charman, J. Tillmann, C. Ecker, F. Dell’Acqua, D. Brandeis, T. Banaschewski, S. Baumeister, C. Moessnang, S. Baron-Cohen, R. Holt, S. Bölte, S. Durston, P. Kundu, M. V. Lombardo, W. Spooren, E. Loth, D. G. M. Murphy, C. F. Beckmann, J. K. Buitelaar; EU-AIMS LEAP group, Altered connectivity between cerebellum, visual, and sensory-motor networks in autism spectrum disorder: Results from the EU-AIMS Longitudinal European Autism Project. Biol. Psychiatry Cogn. Neurosci. Neuroimaging in press.
39. C. J. Stoodley, A. M. D’Mello, J. Ellegood, V. Jakkamsetti, P. Liu, M. B. Nebel, J. M. Gibson, E. Kelly, F. Meng, C. A. Cano, J. M. Pascual, S. H. Mostofsky, J. P. Lerch, P. T. Tsai, Altered cerebellar connectivity in autism and cerebellar-mediated rescue of autism-related behaviors in mice. Nat. Neurosci. 20, 1744–1751 (2017).
40. F. Happé, R. Booth, R. Charlton, C. Hughes, Executive function deficits in autism spectrum disorders and attention-deficit/hyperactivity disorder: Examining profiles across domains and ages. Brain Cogn. 61, 25–39 (2006).
41. S. Solso, R. Xu, J. Proudfoot, D. J. Hagler Jr., K. Campbell, V. Venkatraman, C. C. Barnes, C. Ahrens-Barbeau, K. Pierce, A. Dale, L. Eyler, E. Courchesne, Diffusion tensor imaging provides evidence of possible axonal overconnectivity in frontal lobes in autism spectrum disorder toddlers. Biol. Psychiatry 79, 676–684 (2016).
42. B. Zikopoulos, H. Barbas, Changes in prefrontal axons may disrupt the network in autism. J. Neurosci. 30, 14595–14609 (2010).
43. D. H. Geschwind, P. Levitt, Autism spectrum disorders: Developmental disconnection syndromes. Curr. Opin. Neurobiol. 17, 103–111 (2007).
44. E. B. Torres, K. Denisova, Motor noise is rich signal in autism research and pharmacological treatments. Sci. Rep. 6, 37422 (2016).
45. J. D. Power, K. A. Barnes, A. Z. Snyder, B. L. Schlaggar, S. E. Petersen, Spurious but systematic correlations in functional connectivity MRI networks arise from subject motion. Neuroimage 59, 2142–2154 (2012).
46. A. M. Maillard, A. Ruef, F. Pizzagalli, E. Migliavacca, L. Hippolyte, S. Adaszewski, J. Dukart, C. Ferrari, P. Conus, K. Männik, M. Zazhytska, V. Siffredi, P. Maeder, Z. Kutalik, F. Kherif, N. Hadjikhani; 16p11.2 European Consortium, J. S. Beckmann, A. Reymond, B. Draganski,
S. Jacquemont, The 16p11.2 locus modulates brain structures common to autism, schizophrenia and obesity. Mol. Psychiatry 20, 140–147 (2015).
47. R. A. S. Mukherjee, P. A. Cook, S. H. Norgate, A. D. Price, Neurodevelopmental outcomes in individuals with fetal alcohol spectrum disorder (FASD) with and without exposure to neglect: Clinical cohort data from a national FASD diagnostic clinic. Alcohol 76, 23–28 (2018).
48. A. Kolevzon, R. Gross, A. Reichenberg, Prenatal and perinatal risk factors for autism: A review and integration of findings. Arch. Pediatr. Adolesc. Med. 161, 326–333 (2007). 49. A. Hogart, D. Wu, J. M. LaSalle, N. C. Schanen, The comorbidity of autism with
the genomic disorders of chromosome 15q11.2-q13. Neurobiol. Dis. 38, 181–191 (2010).
50. E. Loth, W. Spooren, L. M. Ham, M. B. Isaac, C. Auriche-Benichou, T. Banaschewski, S. Baron-Cohen, K. Broich, S. Bölte, T. Bourgeron, T. Charman, D. Collier, F. de Andres-Trelles, S. Durston, C. Ecker, A. Elferink, M. Haberkamp, R. Hemmings, M. H. Johnson, E. J. H. Jones, O. S. Khwaja, S. Lenton, L. Mason, V. Mantua, A. Meyer-Lindenberg, M. V. Lombardo, L. O’Dwyer, K. Okamoto, G. J. Pandina, L. Pani, A. M. Persico, E. Simonoff, S. Tauscher-Wisniewski, J. Llinares-Garcia, S. Vamvakas, S. Williams, J. K. Buitelaar, D. G. M. Murphy, Identification and validation of biomarkers for autism spectrum disorders. Nat. Rev. Drug Discov. 15, 70–73 (2016).
51. E. Loth, T. Charman, L. Mason, J. Tillmann, E. J. H. Jones, C. Wooldridge, J. Ahmad, B. Auyeung, C. Brogna, S. Ambrosino, T. Banaschewski, S. Baron-Cohen, S. Baumeister, C. Beckmann, M. Brammer, D. Brandeis, S. Bölte, T. Bourgeron, C. Bours, Y. de Bruijn, B. Chakrabarti, D. Crawley, I. Cornelissen, F. Dell’ Acqua, G. Dumas, S. Durston, C. Ecker, J. Faulkner, V. Frouin, P. Garces, D. Goyard, H. Hayward, L. M. Ham, J. Hipp, R. J. Holt, M. H. Johnson, J. Isaksson, P. Kundu, M.-C. Lai, X. L. D’ardhuy, M. V. Lombardo, D. J. Lythgoe, R. Mandl, A. Meyer-Lindenberg, C. Moessnang, N. Mueller, L. O’Dwyer, M. Oldehinkel, B. Oranje, G. Pandina, A. M. Persico, A. N. V. Ruigrok, B. Ruggeri, J. Sabet, R. Sacco, A. S. J. Cáceres, E. Simonoff, R. Toro, H. Tost, J. Waldman, S. C. R. Williams, M. P. Zwiers, W. Spooren, D. G. M. Murphy, J. K. Buitelaar, The EU-AIMS longitudinal european autism project (LEAP): Design and methodologies to identify and validate stratification biomarkers for autism spectrum disorders. Mol. Autism 8, 24 (2017). 52. A. Di Martino, D. O’Connor, B. Chen, K. Alaerts, J. S. Anderson, M. Assaf, J. H. Balsters,
L. Baxter, A. Beggiato, S. Bernaerts, L. M. E. Blanken, S. Y. Bookheimer, B. B. Braden, L. Byrge, F. X. Castellanos, M. Dapretto, R. Delorme, D. A. Fair, I. Fishman, J. Fitzgerald, L. Gallagher, R. J. J. Keehn, D. P. Kennedy, J. E. Lainhart, B. Luna, S. H. Mostofsky, R.-A. Müller, M. B. Nebel, J. T. Nigg, K. O’Hearn, M. Solomon, R. Toro, C. J. Vaidya, N. Wenderoth, T. White, R. C. Craddock, C. Lord, B. Leventhal, M. P. Milham, Enhancing studies of the connectome in autism using the autism brain imaging data exchange II. Sci. Data 4, 170010 (2017).
53. J. L. Matson, M. Shoemaker, Intellectual disability and its relationship to autism spectrum disorders. Res. Dev. Disabil. 30, 1107–1114 (2009).
54. X.-W. Song, Z.-Y. Dong, X.-Y. Long, S.-F. Li, X.-N. Zuo, C.-Z. Zhu, Y. He, C.-G. Yan, Y.-F. Zang, REST: A toolkit for resting-state functional magnetic resonance imaging data processing. PLOS ONE 6, e25031 (2011).
55. K. Murphy, R. M. Birn, D. A. Handwerker, T. B. Jones, P. A. Bandettini, The impact of global signal regression on resting state correlations: Are anti-correlated networks introduced? Neuroimage 44, 893–905 (2009).
56. J. Dukart, F. Sambataro, A. Bertolino, Distinct role of striatal functional connectivity and dopaminergic loss in Parkinson’s symptoms. Front. Aging Neurosci. 9, 151 (2017). 57. A. D. Cox, J. Virues-Ortega, F. Julio, T. L. Martin, Establishing motion control in children
with autism and intellectual disability: Applications for anatomical and functional MRI. J. Appl. Behav. Anal. 50, 8–26 (2017).
58. J. Dukart, A. Bertolino, When structure affects function—The need for partial volume effect correction in functional and resting state magnetic resonance imaging studies. PLOS ONE 9, e114227 (2014).
59. T. P. DeRamus, R. K. Kana, Anatomical likelihood estimation meta-analysis of grey and white matter anomalies in autism spectrum disorders. NeuroImage Clin. 7, 525–536 (2015).
60. K. J. Friston, S. Williams, R. Howard, R. S. J. Frackowiak, R. Turner, Movement-related effects in fMRI time-series. Magn. Reson. Med. 35, 346–355 (1996).
61. J. Ashburner, A fast diffeomorphic image registration algorithm. Neuroimage 38, 95–113 (2007).
Acknowledgments: We thank the anonymous reviewers and the editor for providing valuable comments on our manuscript. Funding: This study was funded by EU AIMS LEAP and AIMS-2-TRIALS. EU-AIMS LEAP receives support from the IMI Joint Undertaking (JU) under grant agreement no.115300, resources of which are composed of financial contribution from the European Union’s Seventh Framework Programme (FP7/2007-2013), from the European Federation of Pharmaceutical Industries and Associations (EFPIA) companies’ in kind contribution, and from Autism Speaks. AIMS-2-TRIALS received funding from the IMI 2 JU under grant agreement no. 777394. ABIDE I is supported by NIMH (K23MH087770), NIMH (R03MH096321), Leon Levy Foundation, Joseph P. Healy, and the Stavros Niarchos Foundation.
by guest on May 19, 2020
http://stm.sciencemag.org/
ABIDE II is supported by NIMH (5R21MH107045), NIMH (5R21MH107045), Nathan S. Kline Institute of Psychiatric Research, Joseph P. Healey, Phyllis Green, and Randolph Cowen. InFoR is part of clinical trial C07-33 sponsored by Inserm. It was granted approval by local Ethics Committee or“Comité de Protection des Personnes” on 14 November 2008, authorized by the French authorities (ANSM B80738-70 on 11 August 2008), and registered in a public trials registry (NCT02628808). All study participants gave their informed written consent to participation, in line with French ethical guidelines. The work has been coordinated by Fondation FondaMental and achieved thanks to the following organisms and establishments: AP-HP, CHU Bordeaux, Hôpital Charles Perrens, and Robert Debré et Henri Mondor’s CIC. It was financially supported in part by the Institut Roche and in part by the Investissements d’Avenir program managed by the ANR under reference no. ANR-11-IDEX-0004-02. Author contributions: J.D. designed the overall study, processed the data, and performed all analyses related to derived hyper- and hypoconnectivity indices and all analyses testing for associations with structural, clinical, and demographic measures. S.H. performed the initial DC analyses. J.D. and S.H. wrote the manuscript. A. Bertolino, J.F.H., G.D.H., F.B., J.S., and C.H.C. contributed to interpretation of the EU-AIMS LEAP data. T.C., J.T., C.F.B., E.L., D.M., M.O., C. Bours, A.R., J.K.B., W.S., and P.G. contributed to design, collection, and interpretation of the EU-AIMS LEAP data. C.C., C. Bouquet, X.L.D., and A. Bertolino contributed to design and interpretation of the InFoR data. M.-A.d., M.L., I.S., A.G., R.D., C.L., J.H., M.L.-L.M., S.G., J.D., S.H., M.C., A.A., M.B., and A. Beggiato contributed to design and collection of the InFoR data. All authors reviewed and commented on the manuscript. Competing interests: S.H., J.F.H., C.H.C., P.G., W.S., X.L.D., C. Bouquet, A. Bertolino, C.C., F.B., G.D.H., J.S., and J.D. are current or former employees of F. Hoffmann–La Roche Ltd. and received support in form of salaries. J.K.B. has been, in the past
3 years, a consultant to, member of advisory board of, and/or speaker for Janssen Cilag BV, Eli Lilly, Lundbeck, Shire, Roche, Novartis, and Servier. He is not an employee of any of these companies and not a stock shareholder of any of these companies. He has no other financial or material support, including expert testimony, patents, and royalties. C. Bours, A.R., M.O., M.B., A.A., M.C., S.G., M.L.-L.M, J.H., C.F.B., E.L., D.M., T.C., J.T., C.L., R.D., A. Beggiato, A.G., I.S., M.L., and M.-A.d. have no conflict of interests. Data and materials availability: All the data used for this study are present in the main text or in the Supplementary Materials and Methods file.
Submitted 18 April 2018 Resubmitted 22 November 2018 Accepted 5 February 2019 Published 27 February 2019 10.1126/scitranslmed.aat9223
Citation:Š. Holiga, J. F. Hipp, C. H. Chatham, P. Garces, W. Spooren, X. L. D’Ardhuy, A. Bertolino, C. Bouquet, J. K. Buitelaar, C. Bours, A. Rausch, M. Oldehinkel, M. Bouvard, A. Amestoy, M. Caralp, S. Gueguen, M. Ly-Le Moal, J. Houenou, C. F. Beckmann, E. Loth, D. Murphy, T. Charman, J. Tillmann, C. Laidi, R. Delorme, A. Beggiato, A. Gaman, I. Scheid, M. Leboyer, M.-A. d’Albis, J. Sevigny, C. Czech, F. Bolognani, G. D. Honey, J. Dukart, Patients with autism spectrum disorders display reproducible functional connectivity alterations. Sci. Transl. Med. 11, eaat9223 (2019).
by guest on May 19, 2020
http://stm.sciencemag.org/