Sustainability 2021, 13, 1334. https://doi.org/10.3390/su13031334 www.mdpi.com/journal/sustainability
Article
Multi-Risk Climate Mapping for the Adaptation of the Venice
Metropolitan Area
Denis Maragno *, Carlo Federico dall’Omo, Gianfranco Pozzer and Francesco Musco
EPiC Earth and Polis Research Centre, Department of Architecture and Arts, Iuav University of Venice, 30135 Venezia, Italy; [email protected] (C.F.d.); [email protected] (G.P.);
[email protected] (F.M.)
* Correspondence: [email protected]; Tel.: +39-349-562-9068
Abstract: Climate change risk reduction requires cities to undertake urgent decisions. One of the principal obstacles that hinders effective decision making is insufficient spatial knowledge frame-works. Cities climate adaptation planning must become strategic to rethink and transform urban fabrics holistically. Contemporary urban planning should merge future threats with older and un-solved criticalities, like social inequities, urban conflicts and “drosscapes”. Retrofitting planning processes and redefining urban objectives requires the development of innovative spatial infor-mation frameworks. This paper proposes a combination of approaches to overcome knowledge pro-duction limits and to support climate adaptation planning. The research was undertaken in collab-oration with the Metropolitan City of Venice and the Municipality of Venice, and required the pro-duction of a multi-risk climate atlas to support their future spatial planning efforts. The developed tool is a Spatial Decision Support System (SDSS), which aids adaptation actions and the coordina-tion of strategies. The model recognises and assesses two climate impacts: Urban Heat Island and Flooding, representing the Metropolitan City of Venice (CMVE) as a case study in complexity. The model is composed from multiple assessment methodologies and maps both vulnerability and risk. The atlas links the morphological and functional conditions of urban fabrics and land use that trig-gers climate impacts. The atlas takes the exposure assessment of urban assets into account, using this parameter to describe local economies and social services, and map the uneven distribution of impacts. The resulting tool is therefore a replicable and scalable mapping assessment able to medi-ate between metropolitan and local level planning systems.
Keywords: climate multi-risk assessment; climate adaptation planning; Metropolitan City of Ven-ice; GIScience
1. Introduction
Continuous international studies and warnings highlight the current state of the Cli-mate Crisis and the increasing severity of forecasts for the future [1–3]. The effects of cli-mate change are extensive and will affect different elements within the biosphere simul-taneously [4].
From an urban planning and land management point of view, climate change affects the relationship between climate hazard and territorial adaptive capacity. In general, higher adaptive capacities correspond to lower climate impact effects [5]. The effects of climatic variations are linked to geographical peculiarities; the morphological, functional and environmental characteristics of a given context [6,7] Geographical characteristics and settlement patterns trigger different impacts that affect human life in the urban envi-ronment (i.e., UHI, urban flooding) or the natural envienvi-ronment (i.e., loss of ecosystem services, loss of biodiversity). The adaptive capacity of urban and natural contexts vary considerably [8]. An effective adaptation process requires territorial contexts to be (re)read and (re)interpreted to better consider vulnerability variables and to (re)classify
Citation: Maragno, D.; dall’Omo,
C.F.; Pozzer, G.; Musco, F. Multi-Risk Climate Mapping for the Adaptation of the Venice Metropolitan Area.
Sustainability 2021, 13, 1334.
https://doi.org/10.3390/su13031334 Academic Editor: Baojie He Received: 30 December 2020 Accepted: 22 January 2021 Published: 27 January 2021
Publisher’s Note: MDPI stays
neu-tral with regard to jurisdictional claims in published maps and insti-tutional affiliations.
Copyright: © 2021 by the authors.
Licensee MDPI, Basel, Switzerland. This article is an open access article distributed under the terms and conditions of the Creative Commons Attribution (CC BY) license (http://creativecommons.org/licenses /by/4.0/).
territories according to their vulnerability to climate impacts [9]. Thus, the territorial vul-nerability assessment aims to outline vulnerable areas within urban and natural environ-ments. The research presented in this paper focuses on the strategic role of spatial infor-mation within the decision-making processes of planning.
Addressing the urgency of the Climate Crisis will require the use of digital spatial knowledge to press prevailing “business as usual” planning processes to innovate [10,11]. Therefore, the systematic use of new information technologies presents new opportunities and exposes new fields of investigation. Furthermore, these new technologies can be ret-rofitted to existing territorial planning processes to address more holistic concerns for the future. The tool developed by this research is designed to support public administrations in their spatial planning efforts. The combination of several elements—such as statistical and quantitatively assessed future scenarios, predictive models and scenario surveys— make it possible to explore unknown environmental conditions and recalibrate existing knowledge to address these “wicked” problems.
The research develops an innovative territorial knowledge framework through infor-mation communication technologies (ICT) to support the strategic implementation of cli-mate adaptation actions [12]. The proposed model provides a new way to develop spatial knowledge, and results in an atlas of climate risks. The atlas is designed as a Spatial Deci-sion Support System (SDSS)—made of a Geodatabase—to support both the Metropolitan Area of Venice (CMVE) and the local Municipality of Venice (CV) administrations: - at the metropolitan level, the atlas supports the development of coordinated
adapta-tion strategies;
- at the local scale, the atlas identifies less resilient areas; this can be used to inform future intervention priorities.
The most effective tool to support administrations in developing objective-oriented adaptation strategies is risk analysis. As vulnerability is the relationship between adaptive capacity and sensitivity, the risk expresses the relationship between vulnerability and ex-posure [7]. Exposed assets that are those affected by a climate impacts; these might in-clude: people (lives), livelihoods, species, ecosystem functions, services, resources, infra-structure, and cultural, economic or social assets [13]. The risk assessment can therefore be seen as a strategic field of investigation into future-orientated urban planning. Meas-uring the factors which are exposed, requires urban governance tools and knowledge frameworks to be capable of representing fast-changing, complex dynamics, in addition to those of a physical and organisational nature [14]. In summary, the investigation of exposure and risk explores the relationship between socio-economic dynamics climate-related risks.
The approach presented in this paper provides a critical lens through which to ana-lyse the effects of rapid contemporary changes to the form and distribution of urban ser-vices, economic activities population density and ecosystem in relation to the changing climate [12]. Analysis of the distribution of services, economic activities, and more vulner-able demographics (according to gender, age or income for example), provides insight into spaces of urban inequity and conflict. Climate change often affects the most vulnera-ble communities; exposure and risk analysis offers the potential to undertake informed, proactive urban planning that can address climate adaptation requirements and urban justice and social equity issues simultaneously [15–17]. If viewed from this perspective, the process of urban climate adaptation offer strategic opportunities to rectify past plan-ning errors, regenerate and maintain the urban fabric, and allow marginalised communi-ties access to necessary services, infrastructure and economic opportunicommuni-ties [18]. The fron-tiers of spatial planning are therefore expanding, yet obsolete planning tools and practices remain significant obstacles. Innovative knowledge frameworks are critical to the ability to address sustainability, adaptation, mitigation, and urban regeneration challenges.
Local municipal governments seem to be the natural starting place for the physical implementation of adaptation and transformative strategies. The primary objective of this
research was therefore to develop a tool to cultivate territorial knowledge and initiate the operational implementation of this process [19–22]. The research overcomes the difficulty often found in identifying more vulnerable fabrics and exposed assets to two of the more common climate impacts: Flooding (F) and Urban Heat Island (UHI).
Adaptation is a process rather than a goal [23]. It cannot be expressed through a sin-gle urban planning tool but needs to be systematically integrated within local governance processes as an awareness of future scenarios [24]. Therefore, the inclusion of strategies focused on increasing territorial resilience requires to integrate innovative processes [25]. The research studies vulnerabilities, and assesses risk and resiliency, using an integrated monitoring process for territorial governance activities. Therefore, the issue of adaptation of cities to climate impacts becomes a (necessary) opportunity for urban planning and territorial governance to innovate and experiment. For public administrations, it becomes a chance to recover, enhance, regenerate, safeguard urban and natural heritage. Adapting territories to new climatic externalities also becomes an opportunity to remedy the plan-ning mistakes of the past. The availability of a dynamic technological innovation ecosys-tem supports and is already supported by strategic spatial information tools [7,26].
The research is structured around the following research questions (Table 1): Table 1. Research question.
N. Research Question
RQ 1. Is the metropolitan survey scale the more effective to support local and regional authorities in to develop and implement climate change adaptation strategies?
RQ 2. Which survey techniques and methodologies are suitable construct a knowledge framework to support the integrated territorial management and governance of climate adaptation?
RQ 3. Can local planning incorporate metropolitan-scale adaptation strategies? Can the same knowledge frame-work also support conscious local adaptation measures?
RQ 4. Is it possible to effectively assess exposure and define risk? Which strategic role can this assessment play in the construction of efficient and effective climate change policies?
RQ 5. How can (or should) adaptation process mitigate social inequalities and urban conflicts exacerbated by CC?
The research presented in this paper is the result of a collaboration between academic research and the territorial administrations in Venice. The methodology developed ad-dresses the adaptation needs of the CMVE and the CV following the requirements of the Green New Deal.
At the Italian level, both institutions can be considered leaders for their commitment. They applied to the initiatives promoted to achieve the goals of the Green New Deal (i.e., decarbonization and greenhouse gases reduction by 2050; land use change regulation towards adaptation). For example, CMVE coordinates 44 municipalities towards mitigation and adaptation goals. On the other hand, Venice is drafting the municipal adaptation plan, considering one of the most environmentally fragile territories on the planet. Often, the inclusion of climate action objectives in the local agenda lack of pragmatism. It emerges that CMVE and CV are good practice, as, in addition to the emission mitigation process, they undertook a transformative approach aimed at adapting to the impacts of climate change. Moreover, these activities are in the framework of European and national adaptation strategies.
Three favourable factors allow the organization of this research in an innovative urban planning perspective: the political will for change; sufficient academic and technological knowledge; and financial resources. Furthermore, the research was funded as part of the European project SECAP within the Interreg Italy-Slovenia program. The produced multi-risk atlas has been subsequently adopted by CMVE and CV, and are now supporting the transboundary strategy definition for the North Adriatic region and the city adaptation plan of CV.
2. Research Design
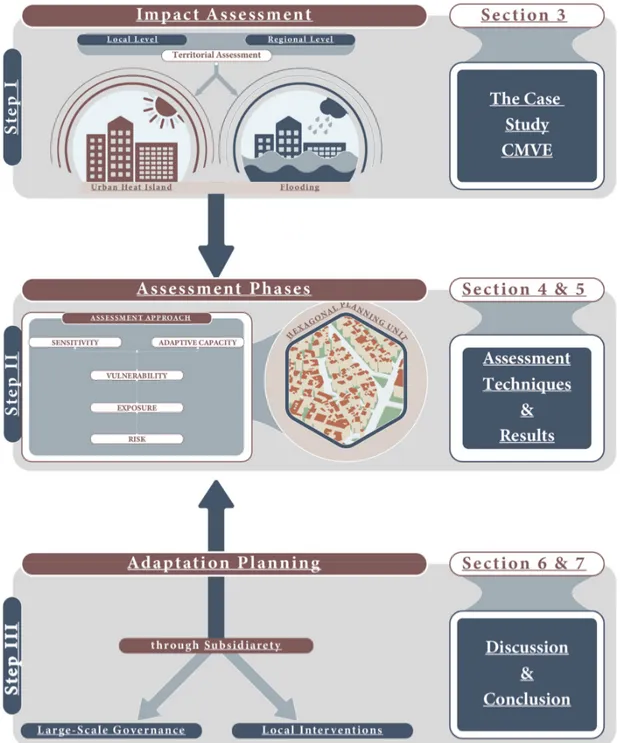
Figure 1 presents the operational steps which organise the logical process of research. Each step is related to Research Questions, presented in the Introduction Section. From the point of view of logical consequentiality, the study bases on three different levels: the first one aims at identifying two of the most relevant impacts of climate change on urban systems; the second one aims at defining impacts assessment techniques linked to urban activities, considered as exposed factors; the third step aims at contextualising the evaluation processes considering the territorial governance system and in particular referring to the subsidiarity principle.
2.1. Step 1—Impact Assessment
Research Step 1 has a theoretical and empirical nature. The Step examines two phenomena which affect the Metropolitan City of Venice territory: UHI and Flooding. The approach employs a geo-database which integrates a set of morphological-environmental indicators. The indicator selection aims at identifying physical and environmental character that can amplify or reduce urban climate impacts. The methodologies presented in this paper focuses on two climate impacts: Flooding and Urban Heat Island. Therefore, the approach assesses the surface runoff coefficients [27,28] linked to Flooding, and Urban Heat Island causes [29,30]. Different working phases organizes Step 1 to achieve the two-impact assessment, namely:
(a) data collection by interoperable sources;
(b) application of algorithms for the processing of morphological information of impacts; (c) mapping of environmental components for chromatic restitution of vulnerability
according to spatial coordinates.
Impact identification is an obligatory operational step in any planning context. Step 1 recognises UHI and F climate impacts and bases on the empirical research developed within the SECAP project (Interreg Italy—Slovenia). From this perspective, the impact recognition includes project partners’ choices, including CMVE. The impacts recognition is fundamental in all models which support local climate adaptation planning—i.e., Global Covenant of Majors for Climate and Energy, C40. Therefore, the developed model can support different climate adaptation approaches, from the local to the regional level.
2.2. Step 2—Assessment Phases
Step 2 defines the impact evaluation techniques and tests it on the case study to answer the RQs. The Step consists of two complementary phases: methodological the first and empirical the second. The first phase aims at defining the model for local risk recognition, integrating a consolidated methodology. The assessment starts from the definition of vulnerability and considers as exposed factors the economic assets and services, which characterize the case study urban context. Step 2 aims at—using a geo-database—localizing the risks driven by the two impacts within the CMVE context. Risk localization is the result of Step 2 and leads to Step 3. The last Step evaluates the proposed process limitations and potentialities linking to RQs. The general objective of Step 2 is to develop a stable and replicable approach to assess climate change risk spatial, supporting the effective implementation of strategies and measures.
2.3. Step 3—Adaptation Planning
Step 3 represents the convergence point of Step 1 and 2 analytical and empirical investigations. In Step 3 vulnerability, exposure and risk assessment results allow the definition of a new knowledge paradigm. This knowledge framework can directly and operationally support public authorities in multi-governance climate adaptation planning. From this perspective, sensitivity and adaptive capacity indicators definition play a central and innovative role. Furthermore, Step 3 presents the relationship between results and responses to RQs. The tool limitations and potentialities base on the atlas implementation within CV and CMVE spatial planning systems. In the first case, the atlas supports the Venice Adaptation Plan implementation, and in the second, the tool supports the metropolitan adaptation strategies definition.
3. The Case Study of Metropolitan City of Venice
Section 3 describes the spatial study system on which the vulnerability, exposure and risk assessments were elaborated and tested. This First Step of the research (Figure 1) contextualises the case study and the regional system describing the link with climate change impacts and aims at responding to RQ 1. The empirical research has as object of investigation the territory of the Metropolitan City of Venice (CMVE) and Mestre, part of
the municipality of Venice (CV) administrative territory. The CMVE is the only special-status sub-regional administration—i.e., with an operational planning function—in the Veneto region and coordinates 44 municipal units territorial governance [31]. Among these, the Municipality of Venice can represent the complexities of the sub-regional system. CV is peculiar for the complex structure of its planning governance and for the relation that its urban morphology has with climate impacts. The authors of this paper selected this territory for the nature and quality of climate resilience-oriented ongoing processes. From the point of view of applied research, this area presents a high concentration of projects financed both by the European Commission—such as Life and Interreg projects—and others directly by local authorities. The Veneto Region, the CMVE and the CV carried out in the last five years an extensive programme to update planning tools—from the cognitive framework to the strategic planning—emerging as good practices at Italian level in the fulfilment of New Covenant of Majors and C40 commitments. It is possible to divide the territory of the Municipality of Venice into two parts: the first is the city of the lagoon islands made up of water and the historical urban fabric; the second is the modern city of the hinterland. From a scientific point of view, both components are highly relevant about the effects of climate change, considering Urban Heat Island and Flooding phenomena. The choice of the modern area of Mestre as a case study is linked to the availability of information on which to base the empirical research. Moreover, the choice is motivated by the fact that the historic city has characteristics that require further investigation to carry out a reliable survey. These characteristics that limit accurate investigations on climate risk are morphologically complex urban fabric and a peculiar relationship with the environmental system.
Two examples of this complexity are:
- the compactness of the urban fabric needs to be considered assessing UHI. This requires precise modelling and high-resolution thermal images. Both elements require a specific investigation process.
- in Flooding, assessment is necessary to investigate the behaviour of urban surfaces morphology and how the system of canals—which define the old town—receives rainwater.
Therefore, the objective is to develop a sound assessment methodology for contemporary urban fabrics, which can be integrated in a second moment to analyse historical centres.
Authors chose to implement empirical research on Mestre because in the area gives the possibility to develop a risk assessment basing on existing data and using open-source tools. Moreover, the result can support the definition of metropolitan scale coordination strategies, responding to the RQs and objectives of the article. Mestre presents historical sprawl problems associated with the economic growth of the industrial pole of Marghera. Furthermore, insufficient city growth supervision led to a diffuse deficiency of green areas, overbuilding and social conflict situations.
The survey considers the information necessary to describe both the sensitivity and adaptive capacity of the area to map vulnerability. The exposure of the main economic activities and services highlights risk distribution in proportion to the quality of the urban fabrics. The assessment is replicable and extendible at the whole CMVE territorial system and can effectively integrate the current governance system. Table 2, quantitatively presents the relationship between the study area and the metropolitan area, strengthening the opportunity of empirically test the method on this context.
Table 2. Distribution of the case study population.
Territory Surface (Km2) Population Population Density (pop/Km2)
Veneto Region 18,345 * 4,907,704 * 267.52 ***
Metropolitan City of Venice 2472.91 * 851,663 * 344.40 ***
Municipality of Venice 156.85 * 259,150 * 1652.22 ***
Mestre (Case Study) 224.98 ** 88,552 ** 393.60 ***
* Source ISTAT 2019. ** Source Municipality of Venice. *** Authors Elaboration.
The effects, induced by territorial artificialization processes and climate variability on the regime of surface water flows, highlight the existence of increasingly severe and recurrent hydraulic criticalities in urban areas [32,33]. The increase in the volume of surface water runoff due to soil sealing and CC (for example, increasing intensity and variation in the frequency of rainfall) subjects urban basins to a disruption of the natural hydrological cycle and an increase in the risk of flooding [34,35]. The increase in extreme weather events in terms of intensity and territorial extension tends to overload the urban drainage system [36], causing an uncontrolled increase in surface runoff [37,38]. This disturbs the territory and the urban ecosystem with increasingly persistent flooding.
In a process of containment of the urban runoff phenomenon, it is necessary to intervene effectively on its modelling and simulation [39–41]. Therefore, it is necessary to adopt innovative analysis technologies that, integrated with sustainable urban development solutions, make it possible to estimate hydraulic vulnerability, offering numerous advantages to the operational management of public space and the performance of the urban drainage system. On the other hand, Urban Heat Island impacts is a physical phenomenon generated by the coexistence of several factors—e.g., urban morphology, soil densification, exposed climatic-geographical zone, human activities— that contribute temperature accumulation in urban areas [29,42,43]. An urban fabric, mainly composed of buildings and paved surfaces, absorbs more heat and solar energy than natural surfaces. Moreover, the heat accumulation causes overheating during the day, and in the night-time, transforming a city in a thermic cell with constant high temperatures. This predisposition and other factors—i.e., air pollution, industrial activities, and lack of water shortages—makes cities risk places for population health. UHI impoverishes the quality of life in cities, reduces the dispersion of air and water pollution, increases energy costs for cooling, lessens urban biodiversity and amplifies health risks for the population [44,45]. The study area is characterized by medium-sized settlements sprawled in a vast rural area fragmented by river courses, where urban heat island widespread within build zones.
4. Assessment Techniques
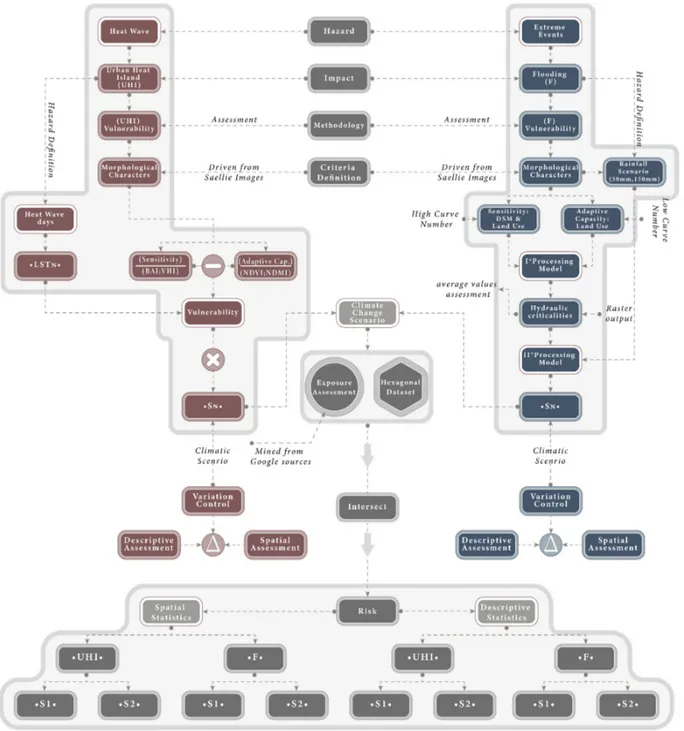
Section 4 develops a methodology for analysing UHI and Flooding impacts, aims to answer RQ 2 and 4 and acts as a link between Step 1 and Step 3 (Figure 1). The workflow (Figure 2) combines different investigation techniques, technologies, and assessments— e.g., vulnerability, exposure, and risk. It bases on different binomials: urban morphology vulnerability, functional assets exposure and urban system multi-risk. The Assessment Techniques Section describes the different methodologies deployed to define these three indicators, including the identified climatic hazards.
Figure 2. Workflow.
4.1. Workflow
The vulnerability assessment bases on morpho-typological indices organised into a geodatabase (GeoDB). The connection between geometry and tabular information is carried out in a GIS environment using a hexagonal grid with 150-m side cells.
The cell size definition follows two principles: (a) simulating a typical urban neighbourhood area with high density and heterogeneous physical-functional organisation; (b) setting a minimum unit to overlap information and data with different resolutions. The hexagonal grid allows the convergence and integration of data from heterogeneous information sources and indices. Standardised geometrical units support spatial statistical analysis methodologies and the design of complex computational calculations.
From a methodological point of view, the preparation of the GeoDB separates into two distinct operational flows (Figure 2). The two flows aim at combining two different assessment methodologies—UHI and F—within a single multi-risk assessment approach. The GeoDB is the core of the SDSS and allows the risk atlas development. The workflow spatially associates assessments for both impacts by integrating exposure factors. These values are the socio-economic and commercial activities mined from Google’s databases (Figure 2). The multi-risk analysis at F and UHI is the result of this process and considers progressive impact scenarios, according to Equation (3).
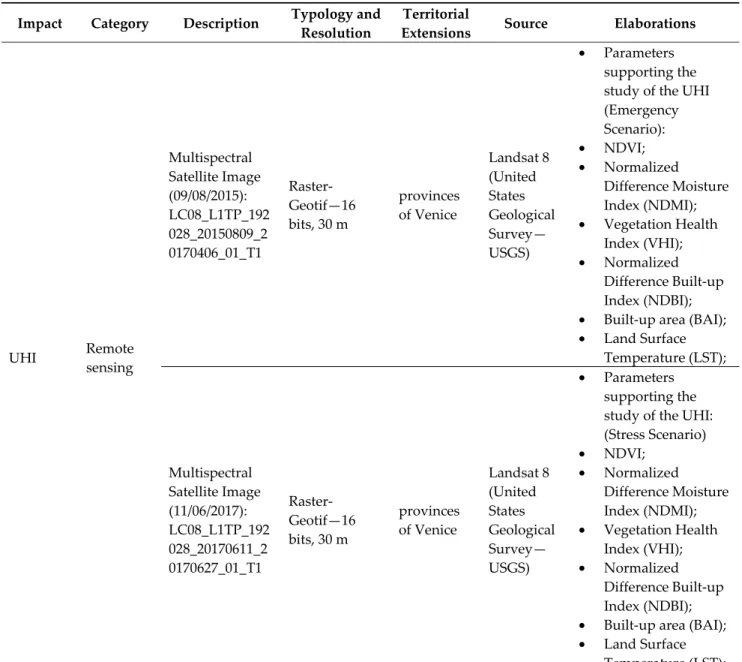
4.2. Data Source
The research uses several sources (Table 3). Some data refer to spatial and alphanumeric information held by the municipalities (i.e., basic cartographic themes and general thematic cartography), others come from remote sensing elaborations.
Table 3. Data source. Impact Category Description Typology and
Resolution
Territorial
Extensions Source Elaborations
UHI Remote sensing Multispectral Satellite Image (09/08/2015): LC08_L1TP_192 028_20150809_2 0170406_01_T1 Raster-Geotif—16 bits, 30 m provinces of Venice Landsat 8 (United States Geological Survey— USGS) • Parameters supporting the study of the UHI (Emergency Scenario): • NDVI; • Normalized Difference Moisture Index (NDMI); • Vegetation Health Index (VHI); • Normalized Difference Built-up Index (NDBI); • Built-up area (BAI); • Land Surface Temperature (LST); Multispectral Satellite Image (11/06/2017): LC08_L1TP_192 028_20170611_2 0170627_01_T1 Raster-Geotif—16 bits, 30 m provinces of Venice Landsat 8 (United States Geological Survey— USGS) • Parameters supporting the study of the UHI: (Stress Scenario) • NDVI; • Normalized Difference Moisture Index (NDMI); • Vegetation Health Index (VHI); • Normalized Difference Built-up Index (NDBI); • Built-up area (BAI); • Land Surface
Flooding Basic Map DSM from 3D model Raster-Tif-1 m provinces of Venice Metropolita n City of Venice (MCV)
Supporting data for the simulation of stormwater surface runoffs Primary watercourses Vector provinces of Venice Metropolita n City of Venice (MCV)
Supporting data for the simulation of stormwater surface runoffs Thematic Map Land Use 2012—CCS 2012 plus Vector provinces of Venice Land cover database of Veneto region to 2012
Supporting data for the construction of the Atlas of Surfaces Remote sensing * Multispectral Satellite Image: L1C_T32TQR_A 012060_2019062 8T101033 Raster-GeoTiff-10 m provinces of Venice Sentinel 2 (United States Geological Survey— USGS) Normalized Difference Vegetation Index (NDVI): Supporting data for the
construction of the Atlas of Surfaces Multispectral Satellite Image: L1C_T33TUL_A 020611_2019060 3T101642 Raster-GeoTiff-10 m provinces of Venice Sentinel 2 (United States Geological Survey— USGS) Normalized Difference Vegetation Index (NDVI): Supporting data for the
construction of the Atlas of Surfaces Flow index SCS Curve Number (CN): hydrology parameter for predicting direct runoff or infiltration from rainfall excess. Curve Number depends on soil type, land use, land cover, and antecedent moisture conditions Soil Conservati on Service (SCS 1972) Supporting parameter for the simulation of surface runoff of rainwater and to compare different Hazard scenarios: Emergency Scenario (150 mm/hour); Emergency Scenario (50 mm/hour)
* The Sentinel data use—in the Flooding assessment—allows the intersection between non-permeable and vegetated surfaces with the regional land use database. Furthermore, this process increases the possibility of improving the geometric information on public and private green areas. The processing enriches the definition of soil infiltration capacity based on spatial and descriptive characteristics of vegetation cover. The process combines two satellite images (Path/Raw based on the Worldwide Reference System—WRS) to cover the spatial extent of the CMVE and develops on the frame fusion result the described elaborations.
4.3. Vulnerability Assessment
The evaluation model bases on the research experience synthesis developed by the Authors and capitalises on both theoretical and empirical approaches:
(1) UHI assessment methodologies—linked to climate adaptation planning—base on the relevant experiences developed in the Northern Adriatic, Veneto Region contexts [6,23,46]. Furthermore, these approaches applied in support of the local authorities of the Municipality of Venice, Mantua and Milan.
(2) Flooding assessment bases on the study of meteoric waters surface runoff variations. Seeking this objective, the methodology bases and upgrades the statistical simulation models developed at the northern Italy hydrogeological basin scale [6,39].
Vulnerability assessment is essential to identify areas that are less resilient to an impact, such as UHI and Flooding. The study of the UHI phenomenon uses satellite images, considering the incidence of vegetation and thermal parameters to describe the morphological quality of a territory and its different degrees of vulnerability [6]. On the other hand, the study of hydrological intense events effects on environments bases on spatial correlation analysis between land use patterns, orography, and land morphologies [47,48]. Specifically, it considers slopes, depressions, and land elevations. The vulnerability computation (V) for both impacts combines two environmental determinants, sensitivity (S) and adaptive capacity (AC) [5,7,49]. Equation (1) describes this correlation:
Vulnerability = sensitivity − adaptive capacity (1) Vulnerability: territorial predisposition to accumulate the effects generated by an impact, sensitivity: the propensity of a system to suffer an impact,
adaptive capacity: the intrinsic propensity of a system to be resilient to an impact. The research updates the IPCC definition of the binomials hazard-sensitivity and sensitivity-adaptive capacity. The aim is to recognise the physical-environmental correlations between impacts and land morphology. The approach integrates hazards and its quantitative value into the vulnerability function. Therefore, it operatively considers for the assessment UHI and Flooding in their climatic dimension, not only at the level of reference scenarios. The result of Equation (2) allows an integrated assessment, relating vulnerability and exposure levels to hazard variations.
Vx = (Sensitivity − Adaptive Capacity) × Hy (2)
Vx: Vulnerability to Impact,
Hy: Hazard Scenario.
Equation (2) enables the calculation and mapping of an urban fabric’s propensity to react—negatively or positively—to climatic stress with different magnitudes. The relationship between hazard variations and urban morphologies acquires three-dimensionality through the exposure variable use. The exposure assessment is developed on the Municipality of Venice urban activities, described in Section 4.4. This principle makes it possible to investigate the assets of a system, producing an operational analysis for decision-making. The main problem that exposure analysis presents links with data availability and result interpretation. To overcome this problem, the authors integrated the existing—public—knowledge frameworks with updated information. Thus, through a mining process, data from google maps and google places provided the knowledge base to articulate the assessment. The selection of the exposed assets is part of the planning decision-making process. Therefore, the sample of assets—described in the following sections—aims at representing the database and the assessment model potentialities. The third step of the elaboration allows to map and summarise the urban risk basing on the spatial combination of vulnerability and exposure factors (Equation (3)).
4.3.1. Urban Heat Island Impact Assessment
The left flow of Figure 2 presents the UHI vulnerability development phases. The UHI assessment uses four descriptors to map the impact, and through which analyses satellite data (Table 3). The selection of satellite images—described in Section 4.2—bases on climatic data provided by ARPA Veneto. The data analysis identifies two temporal moments that represent two of the conditions in which the urban system is vulnerable from a thermal point of view:
- The summer day of 9 August 2015 presents a heat wave condition. This day represent an emergency moment due to the duration of the phenomenon and temperature values 4° above the seasonal average.
- The summer day of 11 June 2017 has high temperatures in line with the seasonal trend. This condition is the threshold of thermal stress.
The UHI assessment process uses an empirical method based on remote sensing techniques, where Sensitivity (S), and Adaptive Capacity (AC) acquires specific values (Table 4). The first bases on the spatialization of urban areas through the estimation of the Build-up Area Index (BAI) and Vegetation Health Index (VHI), while the second bases on the representation of the state of vegetation using the values of the Normalized Difference Vegetation Index (NDVI) and Normalized Difference Moisture Index (NDMI).
Table 4. Indicators and components of vulnerability assessment according to Equation (2).
Statistical Unit LST BAI VHI NDVI NDMI
Hexagonal cell
(side 150 m) Hazard scenario Sensitivity Sensitivity
Adaptive capacity
Adaptive capacity The variables deployed to develop the UHI vulnerability analysis have 0 to 1 values. Each UHI assessment indicator requires a specific elaboration. The LST process bases: on an algorithm for the surface temperature extraction, and local thermal data [5]. BAI derives from the difference between NDBI and NDVI. The NDBI index morphologically describes urban areas and allows built-up areas mapping, with a 93% accuracy rate [50]. The index is the result of a ratio between the difference and the sum of the short-wave and near-infrared bands [51,52].
The NDVI parameter is calculated by measuring the spectral pattern of vegetation, water, and bare soil by analysing the visible, near-infrared and red spectra [6]. NDMI— an indicator of the crop’s water stress level—is the result of comparing reflected radiation in the near-infrared and the SWIR (Short Wave Infrared) [6]. The cross-reading between NDVI and LST shows that the presence of vegetation inversely determines a variation in temperature according to a linear trend. On the other hand, NDMI mapping allows evaluating the effects of the impact on vegetation in terms of water stress. Furthermore, land cover and land use can enrich this result.
Analysing the infrared field also allows determining the intensity of drought and its spatial extent [53–55], whose reference index is VHI. VHI estimation is indirect, as it bases on the response of vegetation—i.e., forest and agricultural—referred to thermal stresses or changes in soil moisture. In this research, the VHI is considered as a sensitivity variable, aiming to contextualise the presence of ecosystem imbalances triggered by urbanisation phenomena.
The VHI is obtained through the ratio of two satellite-derived indices: Temperature Condition Index (TCI), Equation (5), and Vegetation Condition Index (VCI), Equation (4). TCI calculation bases on LST, while VCI calculation bases on NDVI. VCI indicates standardised vegetation values reflecting—in %—soil moisture conditions [56].
VCI = ቈ ൫NDVIJ- NDVImin൯ ሺNDVImax- NDVIminሻ
TCI presents in percentage values (%) the vegetative stress related to thermal stress [56].
TCI = ቈ ൫LSTmax- LSTj൯ ሺLSTmax- LSTminሻ
× 100 (5)
The VHI index is a proxy for the vegetation health status estimated according to the relationship between moisture values and stressful thermal conditions [56].
VHI = a×VCI-b × TCI (6)
In Equation (6), a and b are coefficients that quantify VCI and TCI, i.e., vegetation response (with values ranging from 0 to 1). Low values of VHI identify areas that are more affected by stress conditions—e.g., drought phenomena, heavy rainfall—which may alter the vegetative well-being of the green infrastructure.
UHI is calculated according to Equation (7), based on implementation of Equation (2): VUHI = (Sensitivity − Adaptive Capacity) × HUHI (7)
VUHI: Urban Heat Island Vulnerability,
HUHI: Land Surface Temperature Scenario.
Equation (8) illustrates the relationship between sensitivity and adaptive capacity components: VUHI= ቊቈ ሺBAI+VHIሻ 2 - ቈ ሺNDVI +NDMIሻ 2 ቋ ×LST (8)
The result (Equation (8)) is related to the different Hazard (HUHI) scenarios resulting
from different Land Surface Temperature (LST) conditions. This parameter, identified through satellite image analysis (Landsat 8), allows to build different Hazard scenarios (S1; S2; ...; Sn) and thus to represent land vulnerability conditions. Vulnerability is measured in terms of the potential effects generated by thermal alterations (LST) on the morphological response levels of urban and territorial systems to the heat wave according to its intensity and duration. The vulnerability value, result of the equation, is always included between −1 and 1, where −1 is the worst possible condition and 1 the least vulnerable condition.
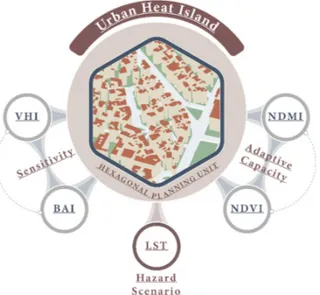
Below is a graphic schematisation of the specific morphological-environmental factors that can favour and influence the UHI phenomenon in the planning unit (Figure 3).
Figure 3. Composition of certain morphological-environmental factors linked to the UHI phenomenon in the planning unit.
Furthermore, the topological overlap between land uses (CCS_2012_plus), and the result of the vulnerability analysis allows the classification of land uses enriching the knowledge framework. This correlation allows mapping land-use patterns and morphological features which favour UHI.
4.3.2. Flooding Vulnerability Assessment
The second flow (right axis of Figure 2) assesses the vulnerability from Flooding (F). The test shows the correlation between Curve Number (CN) coefficient and soil sealing. F vulnerability bases on Equation (2) and is developed in GIS environment through Hydrology function. This step allows the territorial hydraulic system representation, assessing qualitatively and quantitatively its performance. Using an ad hoc statistical model, it is possible to correlate the CN coefficients to geomorphological features by a variety of land use patterns. The model shows which are the land-use changes most influential on the overall efficiency of the hydraulic system and his regression to less efficient performance. Thanks to the implementation of surface runoff scenarios (S; S2; ...; Sn), linked at the CN and rainwater forecasts, it is possible to estimate different critical conditions.
The test supports two scenarios (according to Rainfall data provided by ARPA Veneto—Regional Agency for Environmental Protection):
• 150 mm/hour critical rainfall, with a Return Time (TR) of 200 years. This scenario links with a rainfall volume of 150/200 mm per sqm and corresponds to 24-h precipitations.
• 50 mm/hour rainfall, with an RT of 5 years. This scenario links with a rainfall volume of 50 mm per sqm and corresponds to 12-to-24-h precipitations.
The daily rainfall volume concentrated in a single hour highlights the reactivity of land-use patterns according to the Soil Conservation Service model [57]. The SCS-CN method supports the implementation of Equation (2) integrating with rainfall scenarios the vulnerability analysis (Equation (9)).
VF = (Sensitivity − Adaptive Capacity) × HF (9)
VF = Flooding Vulnerability,
HF = Rain Scenarios × CN.
The recognition of spatial responses to different degrees of hydraulic criticality is developed through three phases of work operationally connected, but technically distinct in procedures.
Step 1: Integrated use of satellite imagery and spatial land cover data (CCS_2012_plus) for the construction of a geographical database of surfaces. CCS 2012 enables an algorithmic update of the Sentinel satellite data. Besides, it allows an improved interpretation of surface runoff dynamic behaviour and hydraulic impacts quantification. Furthermore, land use supports to effectively associate a specific CN to each land use pattern, mapping the different territorial hydraulic performances.
Step 2: simulation of soil hydrodynamic response based on the study of the spatial correlation between artificial (sensitivity, [7]) and natural (adaptive capacity, [7]) morphological factors.
Step 3: restitution of surface runoff scenarios measured linking to the use of rain (hazard) reactivity, weighted on soil specific saturation volume estimation.
The first phase of the work foresees the construction of an Atlas of Surfaces through the integration between Sentinel 2 satellite information sources and the cartographic knowledge on the use and land cover themes of the Veneto Regional Database (CCS_2012_Plus). The work demonstrates the potential of radiometric information in the definition of a mapping of urban green areas, equipping the information content with an interesting statistical accuracy and an adequate spatial correspondence with the polygonal database. The thematic analysis based on Sentinel data increases the spatial
detail of waterproof, permeable and mixed urban cover morphologies considering the fabric of cities. The coverage variations that can be obtained from the weaving of the satellite image make it possible to define a land-use configuration independent of matrix patterns (those required by law), with improved urban and peri-urban ecological detail (public and private greenery).
The second phase of work uses the new spatial input (Atlas of Surfaces) to test a new process of correlation between outflows and morpho-typological relations. The use of
remote sensing facilitates the assessment of hydraulic vulnerability in the phase of
recognition of soil classes, depending on the type of surface and its permeability rate (see Table 5). The permeability levels are defined using the Curve Number (CN) method: a tabulated parameter on the infiltration capacity of the soil, defined based on descriptive characteristics of the vegetation cover and the hydrology of the soil. The estimate adopted can be traced back to the hydrological soil categories developed in the United States by the Soil Conservation Service.
Table 5 shows the values of the CN parameter under the different conditions of land use and crop:
Table 5. CN parameters linking to Atlas of Surfaces.
Type of Surface CN * Hydrological Soil Class **
Buildings 98 A Waterproofed surfaces 81 A Grass/tree 30 A Agricultural land 62 A Wooded land 25 A Water/wet areas 100 A Shaft cover 45 A
* CN values can vary from 0 (when the water is completely retained from the ground) to 100 (when the water drains completely from the draining surface. ** Low outflow potential. Includes soils consisting of sand, gravel, silty sands, and sandy silt; these soils have a transmissivity greater than 0.76 cm/h.
The third phase of outflow modelling exploits a statistical model based on a logic of spatial association between land uses and land morphologies (DSM). The use of a specific statistical model—developed in GIS environment—allows clustering surface runoff dynamics in the different land use categories (see Table 5) using surface water direction and accumulation functions calculated at the hydrogeological basin scale. Through the use of hydrological functions, the relationship (10) is defined [6,27], which allows estimating hydraulic impacts for land use variations by assigning to the CN value the accumulation of flow (Flooding vulnerability—Vf). This correlation is expressed as % of
the rain that transforms into surface runoff (range from 0.25 to 0.98, see Table 5).
As for the UHI vulnerability assessment (see Equation (7)), the Vf modelling also use sensitivity and adaptive capacity components (see Equations (9) and (10), and Table 6).
Vf= ቊ ሾሺCN ×FASሻ + CN° ×ሺFDSM- FASሻሿ FDSM ቋ i (10) CN = curve number associated with waterproof areas,
CN° = curve number associated with permeable areas, FDSM = flow accumulation calculated on DSM,
FAS = flow accumulation related to the surface atlas,
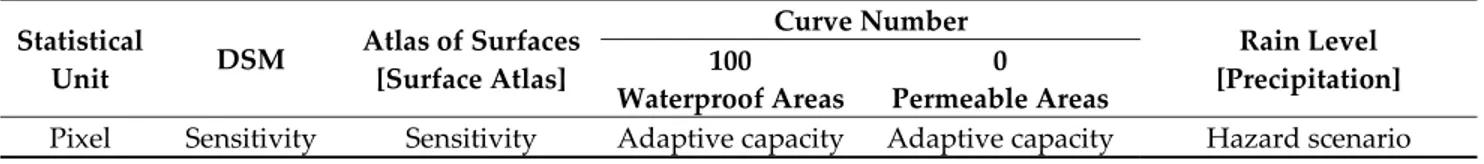
Table 6. Indicators and components of vulnerability according to the use of the Equation (2). Statistical Unit DSM Atlas of Surfaces [Surface Atlas] Curve Number Rain Level [Precipitation] 100 Waterproof Areas 0 Permeable Areas
Pixel Sensitivity Sensitivity Adaptive capacity Adaptive capacity Hazard scenario Below is a graphic schematisation of the specific morphological-environmental factors that can favour and influence the Flooding phenomenon in the planning unit (Figure 4).
Figure 4. Composition of certain morphological-environmental factors linked to the Flooding phenomenon in the planning unit.
The modelling of surface runoff assesses the intensity of rainfall as a hazard component (see Table 6). The use of rain scenarios makes it possible to return a surface runoff condition, hypothetically synthesized as an indicator of reactivity to rainfall.
Reactivity can be estimated through the use of the Equation (11) derived from the SCS method [57] for the identification of the height of the drained rain (Pn) in the network, that is:
Pn=(ha - 0.2VS)
2
ha + 0.8VS (11)
ha = cumulative net precipitation scenario in mm at time t (area of rain), VS = specific saturation volume (maximum retention of the pelvis),
0.2 and 0.8 = coefficients of proportionality referred to the CN, determinable according to the type and land use of the basin.
The maximum retention volume VS [57] is related to the characteristics of the basin and is normally attributed through the use of an intermediate parameter, the Curve Number (CN), according to the relationship (12):
VS = S0× ൬
100
CN-1൰ (12)
S0 = scale factor of 254 mm,
As with the UHI vulnerability assessment, it is also possible to recognise the spatiality of rainfall scenarios by drawing geometric contours from the rasterised base. This information can thus be related to the information layers contained in the GeoDB for the assessment of the UHI effect.
4.4. Exposure Assessment
The following analysis process represents an opportunity to update the assessment of territorial vulnerability to orient the assessment of territorial vulnerability towards a perspective of exposure elaboration based on the prefiguration of ‘multi-risk’, starting from the spatialization of possible different scenarios.
This study allows representing the qualitative and quantitative estimate of the probability of exposure of a given urban situation considered in its socio-economic complexity compared to the vulnerability assessments of the two impacts considered. The methodology of the analysis foresees two work phases: 1. Collection by Python script of information levels (entities); 2. Migration of information related to UHI and Flooding territorial vulnerabilities on the exhibition fabric.
The variables that contribute to the definition of the exposure refer to a survey domain that exploits information directly linked to the geolocation of PoI (Point of Interest) [58,59], using the Application Programming Interface (API) of Google Maps [60] and Google Places [61]. Geolocation maps urban fabrics and sites with a high concentration of environmental, cultural, and economic-social activities. Besides the urban ecosystem phenomenon mapping, the survey assesses territorial socio-economic and cultural trends. The algorithm uses Google’s APIs to mine from Google Maps and Google Places databases to transform the information obtained in table format into geo-referenced point elements [62,63]. This set of vector elements can be reworked in the GIS environment and related to the vulnerability analyses carried out and translated into the hexagonal grid.
The construction of the exhibition database is carried out through a semi-automatic survey carried out between August 2020 and September 2020. At the end of the survey, a single GeoDB of about 20,000 surveys (or PoI) was produced, organised into 15 macro-classes: ”Agencies and finance”; ”Receptive”; ”Art and culture”; ”Worship”; ”Free professionals and craft activities”; ”Commerce”; ”Entertainment, health and beauty”; ”Park”; ”Equipped sports area”; ”Institution”; ”Health and social assistance”; ”Hospital”; ”Community services”; ”Fire brigade”; ”Public transport”.
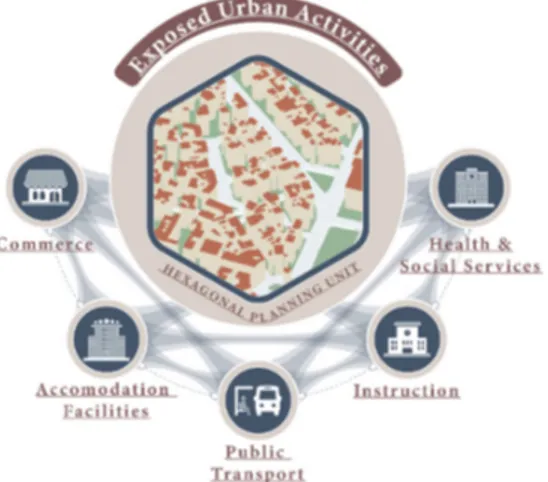
The study aims to carry out an in-depth study by developing the relationship between some macro-classes according to the spatialization of the impacts considered and therefore implicitly assessing also the physical-morphological characteristics of the urban fabrics under examination. This binomial is developed with the aim of characterising and spatialising exposure and risks linking to certain urban functions (Figure 5).
4.5. Risk Assessment
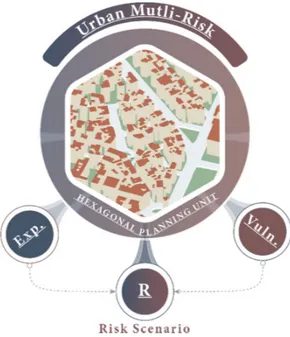
The risk characterisation (Figure 6) derives from the product of three weighted variables: vulnerability, hazard, and exposure (IPCC 2014). The main steps which lead to the risk assessment, and therefore to the risk atlas, namely are:
1. Knowledge: classification and management of urban activities exposure sensitive to UHI and Flooding territorial vulnerability domains.
2. Overlay: extraction of the risk vector through a procedure of spatial intersection between vulnerability values and exposure classes.
3. Spatial analysis: generation of new layers starting from the basic information layer ‘urban activities exposure’ through spatial analysis operations. The procedure returns a classification of activities exposed to UHI and Flooding impacts in a range of maximum values identified in the shp files of spatial vulnerability maps from UHI and Flooding. (see Hexagonal GeoDB).
4. Mapping: defined risk mapping related to the potential adverse consequences on the elements exposed to the classes of the maximum territorial vulnerability domain levels. Therefore, the risk study consists in integrating the process of choice of spatial elements generated by non-additive procedures (exposure from Google Maps) with the calculation of spatial additivity of the morphological-environmental components supporting the phase of territorial vulnerability estimation (see Equation (3) and Table 7).
Figure 6. Multi-Urban Risk Definition.
Table 7. Exposure components and risk processing methodology. Territory of
Investigation Exposure GeoDB Risk Unit Statistics
CMV Urban activities exposure
Territorial vulnerability
assessment
Intersect between
5. Results
Section 5 describes the empirical application of the methodologies developed in Section 4 and constitutes the second part of Step 2 (Figure 1). Survey tools application aims to highlight the methodology potentialities and limits in answering RQ2 and RQ4. The Results Section divides the assessment tools empirical application into two territorial levels: the first one refers to the whole study area of the CMVE (Section 5.1) and the second one refers to the study area of Mestre, part of the CV (Section 5.2). Therefore, Results presents the different output of the assessment of the impacts at a different scale. The objective is to demonstrate the tool potentialities supporting the definition of metropolitan coordination strategies and local measures implementation. In these terms, the UHI and F assessment results allow reading at the metropolitan scale the distribution of vulnerability linking to land use classes and to the 44 municipal units that compose CMVE. These assessments define effective governance processes—at the metropolitan scale—orienting strategies in municipalities and areas characterized by vulnerable land uses.
At the municipality scale, the same assessments zoom in on the Mestre area, part of the CMVE, allowing to read the risk per 150 m planning unit, as presented in Section 4.1. The combination of the two representations aims at presenting the atlas potentialities and its SDSS function both at the CMVE and CV governance level.
5.1. Metropolitan Area Results
The results obtained at metropolitan scale operations bases on descriptive and spatial statistical data. The survey controls the increase and the reduction of vulnerability that occur spatially in a certain period of time by calculating different possible scenarios and defining their variation within the time interval considered (Δ). Scenarios are defined through remote sensing and spatial modelling techniques and are elaborated by the logical-operational workflow of Figure 2. The comparison of data coming from the elaboration of different scenario variables (hazard), extreme or more contained (in terms of intensity and duration), shows how significant variations in LST and heavy rainfall levels can negatively (or positively) influence the vulnerability and exposure gradients of the territory (delta control analysis on CCS_2012_Plus uses). The different land use classes and their functions are characterised by urban morpho-typologies that directly affect the vulnerability performance of the whole urban system. As defined in Section 4.3, the research employs an asset of quantitative indicators to make these different characteristics representable and calculable according to the assessment of vulnerability to excessive heat accumulation or performance in terms of absorption of heavy rainfall. Through the definition of the Δ between different scenarios and the risk assessment, it is possible to spatialize territorial behaviour linking to the stresses triggered by the climate change phenomenon. This knowledge of the different characteristics of the territory, both from the point of view of vulnerability and exposure (of environmental, social, economic, and cultural elements) is the main tool to be able to develop a wide area strategic frame, to be able to coordinate punctually the implementation of more effective measures and to make more efficient the subsidiarity of governance processes.
5.1.1. UHI Vulnerability Results
The UHI vulnerability assessment investigates the relationship between the thermal behaviour of the Earth’s surface (as a response to intense thermal stress lasting 5 days, recorded by the Landsat 8 satellite in the first decade of August 2015, with a higher maximum apparent temperature of 36.4 °C) and land uses. The evaluation considers this relationship in its spatial dimension and therefore relates the location of the phenomenon to urban functions. With this objective, the assessment bases on land use values belonging to class 1 of Veneto Region Soil Coverage Database (Artificially modelled territories— database CCS_212_Plus). To effectively map the assessment results, the evaluation uses a
values graduation based on Natural Breaks (Jenks) statistical algorithm identifying 3 grouping classes (territorial vulnerability between −0.62 to +0.80).
Figure 7 shows with a spatial dimension the UHI stress levels to which the CMVE’s anthropized territories are subjected. Heat island effect is prominent in urban, industrial, commercial, and infrastructural areas, where the levels tend to reach an average (weighted) value of vulnerability ranging between +0.11 and +0.125 (Table 8). In these areas, the phenomenon is particularly virulent due to the morpho-typological conformation of urban fabrics and the historical implementation of planning approaches that have favoured the increase of artificial surfaces at the expense of natural ones. This condition affects the effectiveness of territorial systems in the management of phenomena linked to heat accumulation and makes the ecosystem services present in each type of fabric insufficient to cope with CC impacts.
Figure 7. CMVE—UHI Vulnerability in Emergency Scenario (values ≥ 0.465). Table 8. UHI Vulnerability: vulnerability distribution by land use (CCS_12_Plus) and vulnerability level.
Land Uses Emergency Scenario
(9 August 2015) **
Stress Scenario
(11 June 2017) ** Δ (%) Industrial, commercial, and infrastructural areas 0.110 * 0.099 * −10.45%
Green areas 0.014 * 0.010* −27.75%
Urban fabric 0.125 * 0.110 * −12.23%
Mining areas, landfills, areas under construction 0.006 * 0.004 * −30.31% * Weighted on average values. ** In terms of intensity and duration.
Referring to the comparative methodology application it emerged that areas with a lower weighted average vulnerability can be contextualised in green areas and mining areas, where the values vary between +0.014 and +0.006 (Table 8). The propensity demonstration bases on the comparison between two scenarios characterized by different LST conditions (Table 3).
The relationship between the two reference scenarios shows how the vulnerability and exposure gradients are particularly reactive to variations in LST, understood as an environmental determinant morphologically non-linear but representative of the UHI phenomenon.
The second step of analysis takes up the third grouping class (from +0.465 to +0.754) to spatially quantify the land use surfaces exposed to extreme temperatures (Table 9). What emerges from the first analysis is an analytical-spatial framework that confirms a dimension of high vulnerability mostly concentrated in the urban fabric and industrial, commercial, and infrastructural areas. As far as the urban matrix is concerned, about 34% of urbanized surfaces are exposed to extreme vulnerability, while for areas covered by industrial, commercial, and infrastructural areas the figure reaches values close to 61%. In these areas, settlement expansions tend to maximise the pressure of UHI impact, due to the degree of land exploitation (Figure 8).
Table 9. UHI Vulnerability: vulnerability distribution by land use (CCS_12_Plus) and worse vulnerability condition (values ≥ 0.465).
Land Uses Total Surface
(km2)
Extremely Vulnerable Surfaces (km2) *
Vulnerable Surface (%)
Industrial, commercial, and
infrastructural areas 116.4566 70.5714 +60.60%
Green areas 29.62231 7.1463 +24.12%
Urban fabric 197.1 66.5307 +33.75%
Mining areas, landfills, areas under
construction 7.477049 3.8966 +52.11%
Figure 8. CMVE—UHI Vulnerability in Emergency Scenario (values ≥ 0.465) and Land Uses (CCS 2012).
The reading of the global profile confirms, finally, a percentage weight in first analysis more contained in the urban greenery system and the spaces destined to mining and construction areas.
5.1.2. Flooding Vulnerability Results
The Flooding study returns a spatial index of hydraulic vulnerability. Vulnerability thresholds are calculated and weighted on soil morphology and hydraulic response of land uses in terms of stormwater absorption capacity. This modelling makes it possible to estimate the surface runoff coefficients of waters at basin scale using the CN method, but also to understand which surfaces contribute to modifying the hydraulic performance of the land with effects on exposure and vulnerability assessment.
The identification of surface runoff for two different scenarios (with hazard 50 mm of rain [h] and 150 mm of rain [h]) shows how the ratio between the water volumes generated by the hydrological modelling of the DSM undergo a significant increase in the runoff coefficient in industrial, commercial, and infrastructural areas, as well as in areas with intensive and complex urbanisation (Table 10). The variation between the values (Δ), which can also be identified spatially, is significant, increasing exponentially in correspondence with the reduction in the degree of permeability of the soil.
It is appropriate to consider these areas only as geographical-urban partitions exposed to a certain danger of flooding, based on the estimate of the specific volume of saturation with 50 and 150 mm of rain. This varies with the intensity of the rainfall event and the spatial distribution of land use patterns. The spatial analysis compares the reactivity of the different surface types in the two rainfall scenarios. In residential and industrial settlements there is a high sensitivity to rain with a rainfall of 150 mm/hour. As regards the urban-residential context, about 58% of the waterproofed surfaces are exposed to high surface runoff (grouping class values from 106.98 to 132.21, Figure 9), while for industrial, commercial and infrastructural areas the figure reaches values close to 52% (Table 11).
Figure 9. CMVE—Flooding Worse Vulnerability Condition (values ≥ 106.98) and Land Uses (CCS 2012).
Table 10. Flooding Vulnerability: vulnerability distribution by land use (CCS_12_Plus) and worse vulnerability condition (values ≥ 106.98). Land Uses 50 mm/h Scenario ** 150 mm/h Scenario ** Δ (%) Rainfall Accumulation (mm/sqm) Rainfall Accumulation (mm/sqm) Industrial, commercial, and
infrastructural areas 15.16 * 81.64 * +438.54%
Green areas 4.25 * 43.76 * +930.32%
Agricultural territories 6.27 * 70.38 * +1022.17%
Wooded territories and semi-natural
areas 1.99 * 22.90 * +1053.35%
Urban fabric 14.91 * 78.01 * +423.33%
Mining areas, landfills areas under
* Weighted average values. ** In terms of intensity and duration.
Table 11. Flooding Vulnerability: vulnerability distribution by land use (CCS_12_Plus) and worse vulnerability condition (values ≥ 106.98).
Land Uses Total Surface
(km2)
Extremely Vulnerable Surfaces (km2) *
Vulnerable Surface (%)
Industrial, commercial, and
infrastructural areas 124.47 52.02 +41.80%
Green areas 35.71 1.08 +3.02%
Agricultural territories 1477.42 2.65 +0.18%
Wooded territories and semi-natural
areas 31.12 0.01 +0.02%
Urban fabric 219.28 57.84 +26.38%
Mining areas, landfills areas under
construction 12.81 0.75 +5.86%
* Emergency Scenario values ≥ 106.98.
5.2. Local Area Results
The risk analysis at the municipal scale bases on different degrees of vulnerability mapping linking to the assessment of the exposure of the following urban assets: (i) commerce; (ii) accommodation activities; (iii) public transport; (iv) education; (v) health and social care.
The study, conducted on the urban area of Mestre, is spatially related to UHI and Flooding gradients (Urban Flooding on a municipal scale), considering the qualitative and quantitative distribution of urban activities exposure from Google in the highest urban vulnerability class (third grouping class obtained through Jenk’s Natural breaks algorithm), in terms of extreme summer temperatures and heavy rainfall.
This type of analysis allows to contextualise and converge the concepts of vulnerability and exposure (urban activities) towards the definition of a local risk mapping. The elaborations, of a statistical-spatial nature, can capture and describe the different aspects and different forms of the investigated phenomenon linking to the distribution and spatial suitability of the needs expressed by the economic and social life of the city and its peripheral and central areas. The analysis considers two macro-assets of local risk exposure.
The first macro-asset considers the potential physical and economic damage (direct or indirect) between maximum vulnerability from UHI and urban activities (i.e., commerce, accommodation facilities and public transport).
The second macro-asset, on the other hand, orients the mapping of places potentially predisposed to suffer economic and social damage due to a lack of usability (and/or usability) of the public-private service, specifically considering: services linked to local commerce, education, health, and public assistance.
The spatial association between urban activities and vulnerability values (Urban Risk) also makes it possible to evaluate the activities most affected by a significant convergence of effects deriving from the morphologies of the UHI and F (in a multi-risk analysis and evaluation perspective), giving back a critical behaviour of some physical-functional domains of the city in the face of particularly adverse climatic-environmental conditions. 5.2.1. Urban Heat Island Risk Assessment Results
The UHI definition of local risk analyses three different types of urban activities spatially placed in the economic-social relationship between cities and heat waves: commerce, accommodation activities, public transport (Figure 10).
Figure 10. UHI risk for urban activities—Emergency Scenario: values ≥ 0.465.
The first type of activity refers to the quantitative analysis of the urban fabric of commercial matrix with a UHI (extreme temperature scenario) vulnerability belonging to the third grouping class with a value ranging between +0.48 and +0.75. The survey considers a commercial sample of 2011 activities (or surveys), giving a percentage of exposure subject to maximum vulnerability (and therefore high risk) of about 50%. Observing the spatial distribution of the surveys, a commercial system particularly subject to high risk from UHI in its central locations is detected.
The second type of activity is anchored to the statistical-quantitative interpretation of the local accommodation fabric (hotels, restaurants, leisure, etc.). The survey is conducted on a sample of 2497 surveys, of which more than 51% of the total sample is particularly vulnerable to intense and prolonged heat waves (data referring to the values of the third grouping class: +0.47–+0.75). Most of the highly vulnerable accommodation facilities are concentrated in the city centre. This condition can negatively affect the localisation and usability processes of one of the main drivers of social and economic development in the city.
The third type considers urban activities related to local public transport. The activities are equally distributed throughout almost the entire urbanized fabric. The survey returns a spatial sample of 747 surveys, of which 38% of the total sample is highly at risk UHI (data referring to the values of the third grouping class: +0.42–+0.69. Most of this can be placed in the urban spaces of the city centre, significantly conditioning the usability of LPT in conditions of thermal stress.
5.2.2. Flooding Risk Assessment Results
The local risk assessment of Flooding considers the potential effect on the following urban activities: Commerce; Education; Health and social assistance (Figure 11). The three exposures are spatially associated with the formulation of the relationship between climate stress and economic-social morphologies, conditioned by a high vulnerability from Urban Flooding with an extreme hazard of 150 mm of rain/hour.
The first type of urban activity takes up the quantitative analysis of commercial activities, isolating the highest vulnerability values. For this exposure class, flooding fluctuates between 108 and 132 mm of rain/h. The statistical survey is conducted on the entire commercial sample of 2011 surveys, returning a percentage of exposure subject to maximum vulnerability (and therefore high risk) of about 51%. Most of the commercial structures are highly vulnerable, and at risk of flooding, in the urban areas of the city centre. Here, flooding phenomena can significantly affect commercial functions and usability. Flooding can assume different spatial distributions and intensities (measured also in terms of time). In turn, this dynamic can greatly influence the response and adaptation rhythms of the commercial fabric. The association between exposure and urban morphological conditions can help urban planning in the reading and interpretation models of risk, in turn supporting new forms of adaptation provided by local planning tools.
The second type of urban activity considers the urban fabric related to places of education. The statistical survey is conducted on a sample of 339 surveys, of which 115 (i.e., 33% of the total sample) are particularly vulnerable to intense, concentrated, and prolonged rainfall. The places of education are condensed in the city centre. This condition is in common with a risk situation related to the commercial activities of the case study.
The third type of urban activity concerns social and health care functions. The statistical-spatial analysis analyses a sample of 1050 surveys. The activities are distributed by clusters of urban belonging (in terms of building and housing density), with a greater tendency towards aggregation in the city centre. 45% of the surveys (474 out of 1050) are predisposed to the risk of flooding. This percentage is more contextualized in the complex urban spaces in which numerous values and appurtenances destined to the performance of commercial, tertiary-directional and production of goods and services activities are intertwined. This mixture of morphological-functional interactions amplifies the dynamics of risk with cumulative effects that, over time, change linking to the type of exposure and intensity of impacts.
5.2.3. Results Comparison
UHI and F multi-risk assessment—developed considering five exposure classes (Section 4.4)—allows mapping the more vulnerable physical-functional urban assets.
The approach integrates 5.2.1. and 5.2.2. Sections contents and presents urban complexity through worse vulnerability conditions. UHI and F thresholds are:
1. UHI with venerability level higher or equal to 0.4650 (using Jenks Natural Breaks). 2. Flooding with vulnerability level higher or equal to 106.98 (using Jenks Natural
Breaks).
Table 12 returns the number of activities exposed to single and multiple impacts. Total values suggest that the more multi-impact exposed urban functions are the 49% of the Commercial asset, the 47.34% of the Accommodation Facilities asset, and the 42.29% of the Health & Social Assistance asset. Assessing multi-impact exposed assets highlights that the percentages of those elements that present both risks—UHI > 0465 and F < 106.98—are 88.65%.
In multi-risk exposed areas, the mix of urban fabric patterns contributes to vulnerability levels, worsening the multi-dimensional conditions that trigger climate impacts.