Article
Life-Cycle Assessment of an Innovative
Ground-Source Heat Pump System with Upstream
Thermal Storage
Emanuele Bonamente1,2,* ID and Andrea Aquino2 ID
1 Department of Engineering, University of Perugia, 06125 Perugia, Italy
2 Interuniversity Research Center on Pollution and Environment, University of Perugia, 06125 Perugia, Italy; [email protected]
* Correspondence: [email protected]; Tel.: +39-075-585-3914
Received: 30 September 2017; Accepted: 10 November 2017; Published: 13 November 2017
Abstract:An innovative space-conditioning system is proposed and a life-cycle assessment (LCA) is presented. The layout is obtained starting from a ground-source heat pump system (GSHP) and includes upstream thermal storage (TS). A prototype of the system, implemented following this new approach, is currently in use for space heating and cooling of an industrial building. As a result of the TS designed to decouple the geothermal side from the heat-pump side, the system is able to provide the required thermal energy to the building with a reduced-size geothermal installation (i.e., shorter/fewer boreholes (BHs)). The performance was monitored for over 2 years, both in cooling and heating modes. A LCA study of this system is performed on the basis of specific data for implementation and operation phases. The results are given in terms of the comprehensive ReCiPe midpoint and endpoint indicator suite and are compared with literature studies of other conventional technologies for space conditioning.
Keywords:ground-source heat pump; thermal storage; life-cycle assessment (LCA); geothermal energy
1. Introduction
In recent years, the European Commission has set new targets for the emission of greenhouse gases (GHGs) by the building sector, with the goal of reducing the emissions of equivalent CO2(CO2eq) by 90% by the year 2050 [1]. As reported in the 2014/2015 European Work Program, more than 17% of the primary energy saving potential of the European Union (EU) for 2050 [2] is related to building retrofit. This would correspond to retrofitting 80% of the 25 billion square meters of the current floor space in EU-27, Switzerland and Norway [3]. As a building is characterized by a continuous use of energy and raw materials during its entire life cycle, a major energy use in situ is necessary for the operation phase (i.e., use of the building), while minor energy consumption is due to construction, operation, retrofit and demolition stages, and, indirectly, for the production of building materials and technical installations [4]. Considering that, on average, up to 60% of the energy consumption is due to space conditioning, building energy efficiency (both in the case of new construction and retrofitting) represents a key strategy, particularly where, as in the Italian case, the majority of residential and commercial buildings were built before strict regulations on energy efficiency were enforced [5]. As reported in recent national studies [6], total annual energy saving potentials of approximately 50 and 17.3 GWh/year are achievable (from 2014 to 2020) from the retrofitting of existent residential and non-residential buildings, respectively.
Integrated renewable-energy systems represent the most effective solution in mitigating the environmental impacts of buildings [7]. Among the available renewable energy systems for air-conditioning [8], ground-source heat pump systems (GSHPs) are based on the indirect use of
low-temperature geothermal sources; they exchange heat with the ground via geothermal boreholes (BHs) [9] and are easily suitable for buildings. Compared to power generation systems and direct heating systems, the feasibility of indirect heating systems is not influenced by the presence of the geothermal resource at the site; the thermal energy exploitation of a GSHP, as a result of the low operative temperatures involved, is limited to the first surface layer of the ground [10].
According to the European Directive 28/2009, the output energy produced by a heat pump (HP) system can be considered as renewable energy only if it significantly exceeds the total amount of input energy [11]. In other words, a HP system is defined as renewable energy system according to the measured coefficient of performance (COP). Nevertheless, the exploitation of geothermal energy is affected by many sustainability implications [12]. In particular, the design of a GSHP should take into account several environmental negative impacts, such as the risks of contamination of shallow aquifers and other water bodies, the soil compaction, and habitat loss or disturbance. All these environmental issues are strictly related to drilling activities, which also sensibly affect the initial costs by up to 50% of the total [13]. One of the most effective technological enhancements of current heating, ventilation, and air-conditioning (HVAC) systems is the recourse to heat storage devices (i.e., thermal energy storage—TES), which allows for the optimization of the operational performance, making it possible to accumulate thermal energy (both heat and/or cold) when renewable sources are available and to use this upon demand. The innovation proposed in this work is the inclusion of heat storage in the standard layout of a GSHP to simultaneously reduce the negative impact on the environment and the initial costs of these systems [14]. A further improvement of the prototype has already been proposed, replacing the sensible-heat thermal storage (TS) with a latent-heat TS made of phase-change materials (PCM) [15].
Life-cycle assessment (LCA) is a strategic asset to measure the potential environmental impact of a product and/or service throughout its life (i.e., cradle to grave) from raw material acquisition to processing, manufacturing, use, and finally its disposal [16,17]. Furthermore, LCA can be used to guide the design phase towards the most energy-efficient and environmentally efficient option [17–19], comparing the performance of different products or technologies that provide the same service. As a first step of a LCA analysis, the product is described, and all the specifications necessary to build the life-cycle inventory (LCI) are defined (e.g., the functional unit, the system’s spatial and time boundaries, quality criteria, etc.). The LCI is the resume of all the measurements and information on matter and energy flows collected for each stage of the product’s life cycle. The environmental impact is assessed from the LCI results, and it is described by the relevant environmental indicators (carbon footprint, renewable energy use, soil consumption, etc.). The LCA also includes the identification of significant issues and the evaluation of results.
The aim of the present work is to use the LCA to measure the environmental impact of an innovative GSHP for a commercial building, located in central Italy, and compare it with different system configurations and operative modes. The energy performance of the existent prototype was continuously monitored with a custom data acquisition system. In particular, this analysis focuses on the energy consumption of the system in heating and cooling mode, which was monitored over 1 year from October 2013 to September 2014.
2. Materials and Methods
2.1. Case-Study Description
The analyzed air-conditioning system was realized within the SCER project [20] (the Italian acronym for Development of Renewable-Energy Air-Conditioning Systems), an Italian research project aimed at increasing the production of renewable energy for the air-conditioning of commercial buildings, with high efficiency heating and cooling systems based on a mix of renewable energy sources. The SCER project produced two air-conditioning pilot systems: a woodchip boiler coupled with an absorption chiller [21] and a GSHP coupled with an underground TS device (i.e., in the case of
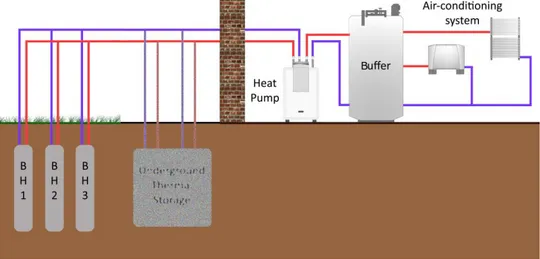
the study); both the systems are connected to a photovoltaic field. The present work investigates the environmental sustainability of the GSHP prototype. In the investigated buildings there are different conditioned spaces: two locker rooms (28 and 27 m2) and five offices (28, 14, 20, 27, and 14 m2) for a total air-conditioned surface of approximately 158 m2. Before the energy retrofit, air-to-air HPs were used for the air-conditioning of the offices and electric heaters were used for the locker rooms. The layout of the GSHP prototype includes three 120 m deep BHs, underground TS (i.e., a quasi-cubic concrete tank filled with 12.5 m3of water), a reversible HP (17 kW), and a distribution system with fan-coil units.
The prototype is designed to work both in conventional mode (Figure1) and in alternative mode (Figure2). The conventional mode represents the usual way of implementing and operating a GSHP. The size of the HP (i.e., kWth) is chosen in order to cover the peaks of heating and cooling energy demand during the year, and the geothermal field is sized to match such peaks. Given the specific thermal yield of the implementation site (i.e., kW/m), the number and length of the BHs are computed. In our study, a total exchange length of 360 m (three 120 m BHs) is required, considering a thermal yield slightly lower than 50 W/m. In this case, the plat sizing is performed using a power-peak approach.
Energies 2017, 10, 1854 3 of 11
there are different conditioned spaces: two locker rooms (28 and 27 m2) and five offices (28, 14, 20, 27, and 14 m2) for a total air-conditioned surface of approximately 158 m2. Before the energy retrofit, air-to-air HPs were used for the air-conditioning of the offices and electric heaters were used for the locker rooms. The layout of the GSHP prototype includes three 120 m deep BHs, underground TS (i.e., a quasi-cubic concrete tank filled with 12.5 m3 of water), a reversible HP (17 kW), and a distribution system with fan-coil units.
The prototype is designed to work both in conventional mode (Figure 1) and in alternative mode (Figure 2). The conventional mode represents the usual way of implementing and operating a GSHP. The size of the HP (i.e., kWth) is chosen in order to cover the peaks of heating and cooling energy demand during the year, and the geothermal field is sized to match such peaks. Given the specific thermal yield of the implementation site (i.e., kW/m), the number and length of the BHs are computed. In our study, a total exchange length of 360 m (three 120 m BHs) is required, considering a thermal yield slightly lower than 50 W/m. In this case, the plat sizing is performed using a power-peak approach.
Figure 1. The prototype layout: conventional mode.
Figure 2. The prototype layout: alternative mode.
The alternative mode represents an evolution of the conventional approach, in which the system sizing is performed considering the daily energy demand rather than the peak power. Once the maximum daily energy is estimated (i.e. kWhth required during the coldest/hottest days of the year), the geothermal field sizing (i.e., total exchange length) is found considering the average power required to exchange it with the ground during a 24 h period. Reduced-size geothermal BHs charge
Figure 1.The prototype layout: conventional mode.
Energies 2017, 10, 1854 3 of 11
there are different conditioned spaces: two locker rooms (28 and 27 m2) and five offices (28, 14, 20, 27, and 14 m2) for a total air-conditioned surface of approximately 158 m2. Before the energy retrofit, air-to-air HPs were used for the air-conditioning of the offices and electric heaters were used for the locker rooms. The layout of the GSHP prototype includes three 120 m deep BHs, underground TS (i.e., a quasi-cubic concrete tank filled with 12.5 m3 of water), a reversible HP (17 kW), and a distribution system with fan-coil units.
The prototype is designed to work both in conventional mode (Figure 1) and in alternative mode (Figure 2). The conventional mode represents the usual way of implementing and operating a GSHP. The size of the HP (i.e., kWth) is chosen in order to cover the peaks of heating and cooling energy demand during the year, and the geothermal field is sized to match such peaks. Given the specific thermal yield of the implementation site (i.e., kW/m), the number and length of the BHs are computed. In our study, a total exchange length of 360 m (three 120 m BHs) is required, considering a thermal yield slightly lower than 50 W/m. In this case, the plat sizing is performed using a power-peak approach.
Figure 1. The prototype layout: conventional mode.
Figure 2. The prototype layout: alternative mode.
The alternative mode represents an evolution of the conventional approach, in which the system sizing is performed considering the daily energy demand rather than the peak power. Once the maximum daily energy is estimated (i.e. kWhth required during the coldest/hottest days of the year), the geothermal field sizing (i.e., total exchange length) is found considering the average power required to exchange it with the ground during a 24 h period. Reduced-size geothermal BHs charge
Figure 2.The prototype layout: alternative mode.
The alternative mode represents an evolution of the conventional approach, in which the system sizing is performed considering the daily energy demand rather than the peak power. Once the maximum daily energy is estimated (i.e., kWhthrequired during the coldest/hottest days of the year),
the geothermal field sizing (i.e., total exchange length) is found considering the average power required to exchange it with the ground during a 24 h period. Reduced-size geothermal BHs charge the TS working with a duty cycle up to 100%; the HP takes energy only upon request. In this operation mode, the building energy demand is covered using the underground TS and only one 120 m BH.
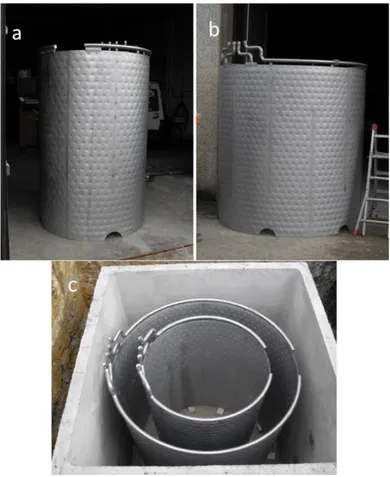
For both modes, a custom data acquisition system allows for testing the prototype performance under real working conditions. For safety and reversibility reasons, two cylindrical heat exchangers (Figure3a,b) are placed within the underground tank (Figure3c) to avoid the mixing of the storage fluid (i.e., water) and the heat transfer fluid (i.e., water and propylene glycol). The TS can be bypassed to switch the system to the conventional mode. The heat exchangers are grouped in two units connected to the HP and BH loops. Each unit is formed by an energy exchange surface of approximately 20 m2.
Energies 2017, 10, 1854 4 of 11
the TS working with a duty cycle up to 100%; the HP takes energy only upon request. In this operation mode, the building energy demand is covered using the underground TS and only one 120 m BH.
For both modes, a custom data acquisition system allows for testing the prototype performance under real working conditions. For safety and reversibility reasons, two cylindrical heat exchangers (Figure 3a,b) are placed within the underground tank (Figure 3c) to avoid the mixing of the storage fluid (i.e., water) and the heat transfer fluid (i.e., water and propylene glycol). The TS can be bypassed to switch the system to the conventional mode. The heat exchangers are grouped in two units connected to the HP and BH loops. Each unit is formed by an energy exchange surface of approximately 20 m2.
Figure 3. The cylindrical heat exchangers: (a) inside exchangers; (b) outside exchangers; (c) view of
the heat exchanger assembly within the thermal storage.
2.2. Goal of the Analysis
The present LCA, following the methodology regulated by the ISO 14044 [15] and 14040 [17] international standards, is dedicated to the evaluation of the environmental sustainability of the TES GSHP prototype considering impacts from the infrastructure construction and assembly and from energy consumption during the use phase on an annual basis. The system lifetime is conservatively estimated to be 20 years, and impacts from infrastructures and machineries are allocated using this time period. The environmental impact of the GSHP prototype is evaluated for three cases: a baseline scenario was set up considering the conventional layout (three BHs and no TS); a storage scenario included the underground TES coupled with a single BH; an improved scenario was set up considering a potential system upgrade where heat exchangers are removed [15]. A fourth scenario, derived from the same previous work [15], was also used for a comparison of the final results and
Figure 3.The cylindrical heat exchangers: (a) inside exchangers; (b) outside exchangers; (c) view of the heat exchanger assembly within the thermal storage.
2.2. Goal of the Analysis
The present LCA, following the methodology regulated by the ISO 14044 [15] and 14040 [17] international standards, is dedicated to the evaluation of the environmental sustainability of the TES GSHP prototype considering impacts from the infrastructure construction and assembly and from energy consumption during the use phase on an annual basis. The system lifetime is conservatively estimated to be 20 years, and impacts from infrastructures and machineries are allocated using this time period. The environmental impact of the GSHP prototype is evaluated for three cases: a baseline scenario was set up considering the conventional layout (three BHs and no TS); a storage scenario included the underground TES coupled with a single BH; an improved scenario was set up considering a potential system upgrade where heat exchangers are removed [15]. A fourth scenario, derived from the same previous work [15], was also used for a comparison of the final results and showing the
potential of the system. In this case (i.e., the optimal scenario), more efficient circulating pumps and energy from photovoltaic panels were used.
It is important to consider that the performance of both the baseline and storage scenarios were measured using the working prototype presented in Section2.1, while the improved scenario is a proposed upgrade of the system, the performance of which was obtained using validated computational fluyd dynamics (CFD) simulations. A schematic view of the prototype layout and the system boundaries is given in Table1. As shown in the following sections, each scenario is characterized by a specific COP for heating and cooling modes and a different incidence of materials for infrastructures. The COP of the baseline and the storage scenario has been directly computed from measured data; the COP of the improved scenario has been computed using the simulated temperature of the water to the HP (i.e., Tinlet) and by considering the characteristic COP versus Tinletcurve of the HP itself.
The LCA, performed with SimaPro v8.2.3 software (Pré Consultants B.V., Amersfoort, The Netherlands), refers to a period of 1 year, considering both heating and cooling modes. The life-cycle model for the baseline scenario includes four phases (BHs, HP, heating consumption, and cooling consumption); the storage and improved scenarios include five phases (BHs, TS, HP, heating consumption, and cooling consumption). The indoor distribution system is not considered. The system boundaries include the production of raw materials, the prototype construction, and the use stage.
The functional unit has been set as 1 kWh of thermal energy provided to (or subtracted from) the building.
2.3. Life-Cycle Inventory
The primary data necessary to build the LCI were directly measured from on-site monitoring of the prototype, including materials and the annual energy consumption in the heating and cooling modes. Where necessary, the on-site measurements were integrated with technical datasheets, scientific references, and simulated data from previous works. The Ecoinvent database 3.2 was used to obtain the data related to the raw material supply and equipment transport and manufacturing [22]. No cut-off rule was used. The raw materials were classified within three groups: BHs (materials used to build the geothermal heat exchangers and piping), TS (materials used to realize the underground TES system, including, in the storage scenario, the cylindrical heat exchangers), and HPs (the HP and all the hydraulic connections within the technical room). The materials incidence and the construction processes are detailed in Table1.
Table 1.The materials incidence of the analyzed scenarios.
Baseline Storage Improved
Energies 2017, 10, 1854 5 of 11
showing the potential of the system. In this case (i.e., the optimal scenario), more efficient circulating pumps and energy from photovoltaic panels were used.
It is important to consider that the performance of both the baseline and storage scenarios were measured using the working prototype presented in Section 2.1, while the improved scenario is a proposed upgrade of the system, the performance of which was obtained using validated computational fluyd dynamics (CFD) simulations. A schematic view of the prototype layout and the system boundaries is given in Table 1. As shown in the following sections, each scenario is characterized by a specific COP for heating and cooling modes and a different incidence of materials for infrastructures. The COP of the baseline and the storage scenario has been directly computed from measured data; the COP of the improved scenario has been computed using the simulated temperature of the water to the HP (i.e., Tinlet) and by considering the characteristic COP versus Tinlet curve of the HP itself.
The LCA, performed with SimaPro v8.2.3 software (Pré Consultants B.V., Amersfoort, The Netherlands), refers to a period of 1 year, considering both heating and cooling modes. The life-cycle model for the baseline scenario includes four phases (BHs, HP, heating consumption, and cooling consumption); the storage and improved scenarios include five phases (BHs, TS, HP, heating consumption, and cooling consumption). The indoor distribution system is not considered. The system boundaries include the production of raw materials, the prototype construction, and the use stage.
The functional unit has been set as 1 kWh of thermal energy provided to (or subtracted from) the building.
2.3. Life-Cycle Inventory
The primary data necessary to build the LCI were directly measured from on-site monitoring of the prototype, including materials and the annual energy consumption in the heating and cooling modes. Where necessary, the on-site measurements were integrated with technical datasheets, scientific references, and simulated data from previous works. The Ecoinvent database 3.2 was used to obtain the data related to the raw material supply and equipment transport and manufacturing [22]. No cut-off rule was used. The raw materials were classified within three groups: BHs (materials used to build the geothermal heat exchangers and piping), TS (materials used to realize the underground TES system, including, in the storage scenario, the cylindrical heat exchangers), and HPs (the HP and all the hydraulic connections within the technical room). The materials incidence and the construction processes are detailed in Table 1.
Table 1. The materials incidence of the analyzed scenarios.
Baseline Storage Improved
Material Boreholes Heat Pump Boreholes Thermal
Storage Heat Pump Boreholes Thermal Storage Heat Pump High-density polyethilene (kg) 428.14 - 140.02 9.57 - 140.02 7.57 - Sand (kg) 40,526 - 10,120 10,189 - 10,120 10,189 - Gravel (kg) 53,606 - 13,398 13,440 - 13,398 13,440 - Excavation (m3) 55.93 - 13.98 76.37 - 13,98 76.37 - Water (kg) 583.29 - 190.76 3510 - 190.76 3510 - Propilene glycol (kg) 257.98 - 84.37 4.56 - 84.37 4.56 - Concrete (m3) 3.63 - 1.21 1.58 - 1.21 1.58 - Reinforcement steel (kg) 104.45 - 43 64 - 43 43 - Brass (kg) - 6 - 8 - - - - Power (kW) - 17 - - 17 - - 17 Steel (kg) - 81 - 361.64 81 - - 81 Energies 2017, 10, 1854 5 of 11
showing the potential of the system. In this case (i.e., the optimal scenario), more efficient circulating pumps and energy from photovoltaic panels were used.
It is important to consider that the performance of both the baseline and storage scenarios were measured using the working prototype presented in Section 2.1, while the improved scenario is a proposed upgrade of the system, the performance of which was obtained using validated computational fluyd dynamics (CFD) simulations. A schematic view of the prototype layout and the system boundaries is given in Table 1. As shown in the following sections, each scenario is characterized by a specific COP for heating and cooling modes and a different incidence of materials for infrastructures. The COP of the baseline and the storage scenario has been directly computed from measured data; the COP of the improved scenario has been computed using the simulated temperature of the water to the HP (i.e., Tinlet) and by considering the characteristic COP versus Tinlet curve of the HP itself.
The LCA, performed with SimaPro v8.2.3 software (Pré Consultants B.V., Amersfoort, The Netherlands), refers to a period of 1 year, considering both heating and cooling modes. The life-cycle model for the baseline scenario includes four phases (BHs, HP, heating consumption, and cooling consumption); the storage and improved scenarios include five phases (BHs, TS, HP, heating consumption, and cooling consumption). The indoor distribution system is not considered. The system boundaries include the production of raw materials, the prototype construction, and the use stage.
The functional unit has been set as 1 kWh of thermal energy provided to (or subtracted from) the building.
2.3. Life-Cycle Inventory
The primary data necessary to build the LCI were directly measured from on-site monitoring of the prototype, including materials and the annual energy consumption in the heating and cooling modes. Where necessary, the on-site measurements were integrated with technical datasheets, scientific references, and simulated data from previous works. The Ecoinvent database 3.2 was used to obtain the data related to the raw material supply and equipment transport and manufacturing [22]. No cut-off rule was used. The raw materials were classified within three groups: BHs (materials used to build the geothermal heat exchangers and piping), TS (materials used to realize the underground TES system, including, in the storage scenario, the cylindrical heat exchangers), and HPs (the HP and all the hydraulic connections within the technical room). The materials incidence and the construction processes are detailed in Table 1.
Table 1. The materials incidence of the analyzed scenarios.
Baseline Storage Improved
Material Boreholes Heat Pump Boreholes Thermal
Storage Heat Pump Boreholes Thermal Storage Heat Pump High-density polyethilene (kg) 428.14 - 140.02 9.57 - 140.02 7.57 - Sand (kg) 40,526 - 10,120 10,189 - 10,120 10,189 - Gravel (kg) 53,606 - 13,398 13,440 - 13,398 13,440 - Excavation (m3) 55.93 - 13.98 76.37 - 13,98 76.37 - Water (kg) 583.29 - 190.76 3510 - 190.76 3510 - Propilene glycol (kg) 257.98 - 84.37 4.56 - 84.37 4.56 - Concrete (m3) 3.63 - 1.21 1.58 - 1.21 1.58 - Reinforcement steel (kg) 104.45 - 43 64 - 43 43 - Brass (kg) - 6 - 8 - - - - Power (kW) - 17 - - 17 - - 17 Steel (kg) - 81 - 361.64 81 - - 81
Material Boreholes Heat Pump Boreholes Thermal Storage Heat Pump Boreholes Thermal Storage Heat Pump High-density polyethilene (kg) 428.14 - 140.02 9.57 - 140.02 7.57 -Sand (kg) 40,526 - 10,120 10,189 - 10,120 10,189 -Gravel (kg) 53,606 - 13,398 13,440 - 13,398 13,440 -Excavation (m3) 55.93 - 13.98 76.37 - 13,98 76.37 -Water (kg) 583.29 - 190.76 3510 - 190.76 3510 -Propilene glycol (kg) 257.98 - 84.37 4.56 - 84.37 4.56 -Concrete (m3) 3.63 - 1.21 1.58 - 1.21 1.58 -Reinforcement steel (kg) 104.45 - 43 64 - 43 43 -Brass (kg) - 6 - 8 - - - -Power (kW) - 17 - - 17 - - 17 Steel (kg) - 81 - 361.64 81 - - 81 Tube insulation (kg) - 21.76 - - 27.76 - - 27.76 Aluminum tape (m2) - 10 - - 10 - - 10
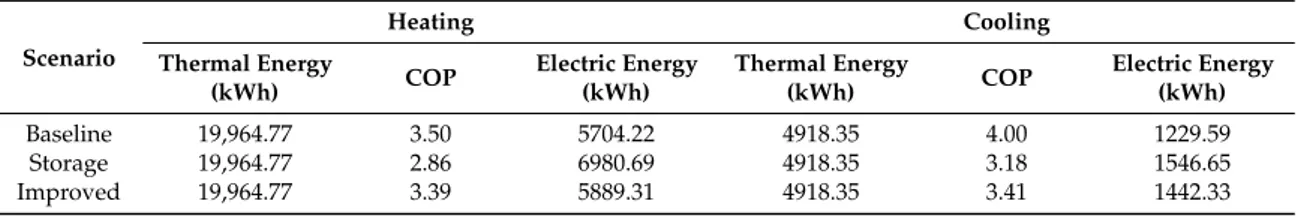
Measured data for electric energy consumption and thermal energy production are reported in Error! Not a valid bookmark self-reference. During the working period, the prototype switched between the conventional and the alternative mode, allowing for the calculation of the COP related to the storage and baseline scenarios. The COP for the improved scenario was calculated using CFD simulations validated against the measured date [15]. The annual thermal energy required by the building for each scenario was set at the value measured in Table2. The electric energy consumption was computed for each scenario using the appropriate COP, as proposed in Table3. Such values were used as inputs for the LCA model.
Table 2.Data from system monitoring.
Time Intervals
Operation Mode Electric Energy (kWh) Thermal Energy (kWh)
Start Stop 11/10/2013 27/11/2013 Alternative 1203.26 3441.33 28/11/2013 06/12/2013 Conventional 346.00 1211.00 07/12/2013 16/12/2013 Alternative 575.00 1644.50 17/12/2013 15/01/2014 Alternative 1595.00 4561.70 16/01/2014 26/03/2014 Alternative 3184.00 9106.24 – – – Heating Total 19,964.77 13/06/2014 26/06/2014 Conventional 71.11 284.42 27/06/2014 31/07/2014 Conventional 554.00 2216.00 01/08/2014 29/08/2014 Alternative 563.00 1790.34 30/08/2014 17/09/2014 Alternative 197.35 627.59 – – – Cooling Total 4918.3
Table 3.Thermal and electric energy consumptions used for the life-cycle assessment (LCA).
Scenario Heating Cooling Thermal Energy (kWh) COP Electric Energy (kWh) Thermal Energy (kWh) COP Electric Energy (kWh) Baseline 19,964.77 3.50 5704.22 4918.35 4.00 1229.59 Storage 19,964.77 2.86 6980.69 4918.35 3.18 1546.65 Improved 19,964.77 3.39 5889.31 4918.35 3.41 1442.33
2.4. Impact Assessment Methodology
Each scenario was analyzed by the ReCiPe 2008 method [22], which uses 18 impact categories addressed at the midpoint level and further converts and aggregates into three endpoint categories.
Midpoint level indicators are direct measurements of the impacts arising from the considered phenomena. A total of 18 physical quantities were computed from the LCI results, providing a quantitative description of the single drivers of the environmental impact associated with the study. These include soil acidification (measured in kg SO2eq), the emission of GHGs (measured in kg CO2eq), water depletion (measured in m3H2O), and so forth.
Impact categories at the endpoint level represent the areas in which the damages of the midpoint phenomena were observed. They are used to make clearer and more easily readable the results of the life-cycle impact assessment (LCIA), aggregating the midpoint indicators into three higher categories: resources, ecosystems, and human health. Endpoint categories are measured in points (i.e., they are not physical quantities) and should be used primarily for comparative studies. These three categories form the basis for decisions in policy and sustainable development. The default hierarchist version was used in this study.
3. Results and Discussion
According the measured environmental indicators, energy consumption was by large the most impacting process, with the only exceptions being ozone depletion and metal depletion, which were mainly due to the HP and HP plus storage, respectively. Energy consumption being determined by the system’s COP, the latter was the parameter to which the results were the most sensitive.
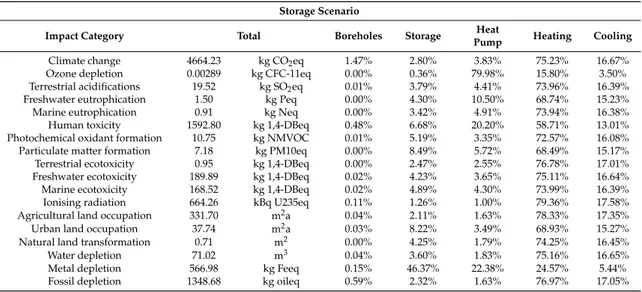
The baseline scenario is characterized by a lower environmental impact than the storage scenario (Tables4and5). This is due to the different energy consumption produced by the different COP of the two systems. Even if the storage scenario shows smaller impacts associated to one BH and the storage (i.e., 199.2 kg CO2eq) than the baseline scenario (255.6 kg CO2eq for three BHs), the COP of the storage scenario is worse than that of the baseline scenario. In fact, when the system works in alternative mode, the cylindrical heat exchangers produce a thermal shift that reduces the system COP; while the system is still able to provide the required thermal energy to the building, the temperature of the brine entering the HP is lower, and the driving energy consumption increases, making this layout uncompetitive with respect to the conventional mode.
Table 4.Midpoint impact indicators of the baseline scenario.
Baseline Scenario
Impact Category Total Boreholes Heat Pump Heating Cooling
Climate change 3889.14 kg CO2eq 5.8% 4.6% 73.7% 15.9%
Ozone depletion 0.00280 kg CFC-11eq 1.3% 82.5% 13.3% 2.9%
Terrestrial acidifications 16.23 kg SO2eq 6.3% 5.3% 72.7% 15.7%
Freshwater eutrophication 1.25 kg Peq 5.9% 12.5% 67.1% 14.5%
Marine eutrophication 0.76 kg Neq 6.0% 5.9% 72.5% 15.6%
Human toxicity 1356.61 kg 1,4-DBeq 7.8% 23.7% 56.3% 12.1%
Photochemical oxidant formation 9.15 kg NMVOC 11.3% 3.9% 69.7% 15.0%
Particulate matter formation 5.82 kg PM10eq 9.1% 7.1% 69.0% 14.9%
Terrestrial ecotoxicity 0.78 kg 1,4-DBeq 5.1% 3.1% 75.6% 16.3%
Freshwater ecotoxicity 151.45 kg 1,4-DBeq 1.9% 4.6% 76.9% 16.6%
Marine ecotoxicity 134.03 kg 1,4-DBeq 2.2% 5.4% 76.0% 16.4%
Ionising radiation 548.22 kBq U235eq 3.3% 1.2% 78.6% 16.9%
Agricultural land occupation 270.10 m2a 2.4% 2.0% 78.6% 16.9%
Urban land occupation 32.88 m2a 17.4% 4.0% 64.7% 13.9%
Natural land transformation 0.62 m2 14.0% 2.0% 69.0% 14.9%
Water depletion 61.24 m3 11.3% 2.1% 71.2% 15.4%
Metal depletion 291.93 kg Feeq 9.1% 43.5% 39.0% 8.4%
Fossil depletion 1142.02 kg oileq 7.8% 1.9% 74.3% 16.0%
Table 5.Midpoint impact indicators for storage scenario.
Storage Scenario
Impact Category Total Boreholes Storage Heat
Pump Heating Cooling
Climate change 4664.23 kg CO2eq 1.47% 2.80% 3.83% 75.23% 16.67%
Ozone depletion 0.00289 kg CFC-11eq 0.00% 0.36% 79.98% 15.80% 3.50%
Terrestrial acidifications 19.52 kg SO2eq 0.01% 3.79% 4.41% 73.96% 16.39%
Freshwater eutrophication 1.50 kg Peq 0.00% 4.30% 10.50% 68.74% 15.23%
Marine eutrophication 0.91 kg Neq 0.00% 3.42% 4.91% 73.94% 16.38%
Human toxicity 1592.80 kg 1,4-DBeq 0.48% 6.68% 20.20% 58.71% 13.01%
Photochemical oxidant formation 10.75 kg NMVOC 0.01% 5.19% 3.35% 72.57% 16.08% Particulate matter formation 7.18 kg PM10eq 0.00% 8.49% 5.72% 68.49% 15.17% Terrestrial ecotoxicity 0.95 kg 1,4-DBeq 0.00% 2.47% 2.55% 76.78% 17.01% Freshwater ecotoxicity 189.89 kg 1,4-DBeq 0.02% 4.23% 3.65% 75.11% 16.64% Marine ecotoxicity 168.52 kg 1,4-DBeq 0.02% 4.89% 4.30% 73.99% 16.39%
Ionising radiation 664.26 kBq U235eq 0.11% 1.26% 1.00% 79.36% 17.58%
Agricultural land occupation 331.70 m2a 0.04% 2.11% 1.63% 78.33% 17.35%
Urban land occupation 37.74 m2a 0.03% 8.22% 3.49% 68.93% 15.27%
Natural land transformation 0.71 m2 0.00% 4.25% 1.79% 74.25% 16.45%
Water depletion 71.02 m3 0.04% 3.60% 1.83% 75.16% 16.65%
Metal depletion 566.98 kg Feeq 0.15% 46.37% 22.38% 24.57% 5.44%
When the cylindrical heat exchangers are removed, a sensible increase of the COP is expected (Table3), according to the technical specifications of the HP, which show an increasing COP as the HP inlet temperature increases. The environmental impact of the improved scenario improves, and it becomes consistent with that of the baseline scenario (Table6). To highlight the relation between the energy performance and environmental impact, the midpoint indicators are also shown per unit of produced thermal energy in Table7. The improved scenario of the present work uses the same electric auxiliary devices of the storage scenario, which is oversized when the cylindrical exchangers are removed and only one BH is used. As reported in a previous analysis [15], an optimal scenario could be foreseen, providing a complete upgrade of the existing prototype by removing the cylindrical exchangers and using a smaller circulating pump. This produces a sensible increase of the system COP: 4.28 for the heating mode and 6.00 for the cooling mode. Furthermore, a market application of this system could easily be coupled with a photovoltaic plant to cover the electric energy demand. The environmental impact of the optimal scenario showed an average decrease of approximately 60% with respect to the baseline scenario. The endpoint indicators of all the analyzed scenarios are reported in Figure4, where conventional HP systems are considered for comparison.
Table 6.Midpoint impact indicators for the improved scenario.
Improved Scenario
Impact Category Total Boreholes Storage Heat
Pump Heating Cooling
Climate change 3978.88 kg CO2eq 1.72% 1.16% 4.50% 74.40% 18.22%
Ozone depletion 0.00281 kg CFC-11eq 0.37% 0.16% 82.38% 13.73% 3.36%
Terrestrial acidifications 16.51 kg SO2eq 1.73% 1.25% 5.21% 73.75% 18.06%
Freshwater eutrophication 1.26 kg Peq 1.44% 0.95% 12.40% 68.44% 16.76%
Marine eutrophication 0.77 kg Neq 1.59% 1.23% 5.78% 73.42% 17.98%
Human toxicity 1340.72 kg 1,4-DBeq 1.67% 1.08% 23.99% 58.84% 14.41%
Photochemical oxidant formation 9.09 kg NMVOC 3.32% 2.51% 3.97% 72.46% 17.74% Particulate matter formation 5.84 kg PM10eq 2.61% 2.04% 7.03% 70.95% 17.38% Terrestrial ecotoxicity 0.80 kg 1,4-DBeq 1.38% 0.81% 3.00% 76.16% 18.65% Freshwater ecotoxicity 157.92 kg 1,4-DBeq 0.45% 0.31% 4.39% 76.19% 18.66%
Marine ecotoxicity 139.41 kg 1,4-DBeq 0.52% 0.36% 5.19% 75.45% 18.48%
Ionising radiation 568.81 kBq U235eq 0.93% 0.57% 1.17% 78.19% 19.15%
Agricultural land occupation 281.27 m2a 0.68% 0.38% 1.92% 77.93% 19.09%
Urban land occupation 31.66 m2a 4.88% 4.68% 4.16% 69.31% 16.98%
Natural land transformation 0.61 m2 3.78% 3.74% 2.08% 72.61% 17.78%
Water depletion 60.99 m3 3.21% 2.74% 2.13% 73.84% 18.08%
Metal depletion 288.46 kg Feeq 2.45% 2.85% 43.98% 40.74% 9.98%
Fossil depletion 1151.10 kg oileq 2.38% 1.00% 1.91% 76.08% 18.63%
Table 7.Midpoint impact indicators per unit of thermal energy for the three scenarios.
Impact Category Unit Baseline Storage Improved
Climate change kg CO2eq/kWhth 0.156 0.187 0.160
Ozone depletion kg CFC-11eq/kWhth 1.13×10⁻⁷ 1.16×10⁻⁷ 1.13×10⁻⁷
Terrestrial acidifications kg SO2eq/kWhth 6.52×10⁻⁴ 7.84×10⁻⁴ 6.63×10⁻⁴
Freshwater eutrophication kg Peq/kWhth 5.02×10⁻⁵ 5.99×10⁻⁵ 5.08×10⁻⁵
Marine eutrophication kg Neq/kWhth 3.07×10⁻⁵ 3.68×10⁻⁵ 3.13×10⁻⁵
Human toxicity kg 1,4-DBeq/kWhth 5.20×10⁻² 6.40×10⁻² 5.38×10⁻²
Photochemical oxidant formation kg NMVOC/kWhth 3.67×10⁻⁴ 4.32×10⁻⁴ 3.65×10⁻⁴
Particulate matter formation kg PM10eq/kWhth 2.34×10⁻⁴ 2.88×10⁻⁴ 2.35×10⁻⁴
Terrestrial ecotoxicity kg 1,4-DBeq/kWhth 3.17×10⁻⁵ 3.81×10⁻⁵ 3.24×10⁻⁵
Freshwater ecotoxicity kg 1,4-DBeq/kWhth 6.10×10⁻³ 7.63×10⁻³ 6.34×10⁻³
Marine ecotoxicity kg 1,4-DBeq/kWhth 5.40×10⁻³ 6.77×10⁻³ 5.60×10⁻³
Ionising radiation kBq U235eq/kWhth 2.20×10⁻² 2.66×10⁻² 2.28×10⁻²
Agricultural land occupation m2a/kWh
th 1.08×10⁻² 1.33×10⁻² 1.13×10⁻²
Urban land occupation m2a/kWhth 1.32×10⁻³ 1.51×10⁻³ 1.27×10⁻³
Natural land transformation m2/kWh
th 2.50×10⁻⁵ 2.84×10⁻⁵ 2.45×10⁻⁵
Water depletion m3/kWh
th 2.46×10⁻³ 2.85×10⁻³ 2.45×10⁻³
Metal depletion kg Feeq/kWhth 1.17×10⁻² 2.27×10⁻² 1.16×10⁻²
Energies 2017, 10, 1854 9 of 10 Metal depletion kg Feeq/kWhth 1.17 × 10⁻² 2.27 × 10⁻² 1.16 × 10⁻²
Fossil depletion kg oileq/kWhth 4.58 × 10⁻² 5.42 × 10⁻² 4.62 × 10⁻²
Figure 4. Endpoint indicators of all the analyzed scenarios.
4. Conclusions
The LCA of an innovative GSHP system with upstream TS is presented. The aim of the study is to measure the environmental impact of the system at the midpoint and endpoint level. The existing prototype was designed to switch between two different working modes: conventional and alternative. For this reason, the LCA was divided into different scenarios: a baseline scenario (system working in conventional mode), a storage scenario (system working in alternative mode), and an improved scenario (a proposed upgrade of the storage scenario). The primary data used for the analysis, collected from on-site monitoring activities, were related to the materials incidence and the energy consumptions of the different system configurations. The LCI showed differences among the three scenarios in terms of energy efficiency (i.e., the COP), materials and construction. With respect to the baseline scenario, the storage scenario was characterized by a worse environmental performance because of the low COPs of the system. The best results were obtained with the improved scenario, for which the removal of the cylindrical heat exchangers increased the system’s COP, and the measured environmental indicators were consistent with those of the baseline scenario. As an example, the climate change indicator of the three scenarios was 0.156 kg CO2eq/kWhth
(baseline), 0.187 kg CO2eq/kWhth (storage), and 0.160 kg CO2eq/kWhth (improved). A complete
optimization of the system is also presented as the optimal scenario: the cylindrical heat exchangers are removed, a more efficient circulating pump is used for the BH, and the electric consumptions of GSHPs are entirely covered by the photovoltaic plant. The results show an average decrease of the measured midpoint indicators of 60% with respect to the baseline scenario. Future developments of the present study will focus on further optimization of the system, on the basis of completely re-designed TS using PCMs, which allow for a strong reduction of the storage volume.
Acknowledgments: This work was supported by the Italian Ministry for the Environment.
Author Contributions: Emanuele Bonamente performed the LCA and supervised the analysis of the results. Andrea Aquino performed the data acquisition and supported the analysis of the results.
Figure 4.Endpoint indicators of all the analyzed scenarios.
4. Conclusions
The LCA of an innovative GSHP system with upstream TS is presented. The aim of the study is to measure the environmental impact of the system at the midpoint and endpoint level. The existing prototype was designed to switch between two different working modes: conventional and alternative. For this reason, the LCA was divided into different scenarios: a baseline scenario (system working in conventional mode), a storage scenario (system working in alternative mode), and an improved scenario (a proposed upgrade of the storage scenario). The primary data used for the analysis, collected from on-site monitoring activities, were related to the materials incidence and the energy consumptions of the different system configurations. The LCI showed differences among the three scenarios in terms of energy efficiency (i.e., the COP), materials and construction. With respect to the baseline scenario, the storage scenario was characterized by a worse environmental performance because of the low COPs of the system. The best results were obtained with the improved scenario, for which the removal of the cylindrical heat exchangers increased the system’s COP, and the measured environmental indicators were consistent with those of the baseline scenario. As an example, the climate change indicator of the three scenarios was 0.156 kg CO2eq/kWhth(baseline), 0.187 kg CO2eq/kWhth(storage), and 0.160 kg CO2eq/kWhth(improved). A complete optimization of the system is also presented as the optimal scenario: the cylindrical heat exchangers are removed, a more efficient circulating pump is used for the BH, and the electric consumptions of GSHPs are entirely covered by the photovoltaic plant. The results show an average decrease of the measured midpoint indicators of 60% with respect to the baseline scenario. Future developments of the present study will focus on further optimization of the system, on the basis of completely re-designed TS using PCMs, which allow for a strong reduction of the storage volume.
Acknowledgments:This work was supported by the Italian Ministry for the Environment.
Author Contributions: Emanuele Bonamente performed the LCA and supervised the analysis of the results.
Andrea Aquino performed the data acquisition and supported the analysis of the results.
Conflicts of Interest:The authors declare no conflict of interest.
References
1. European Commission. COM (2011) 112 Final. Commission Communication. Roadmap to a Competitive Low Carbon Economy in 2050; European Commission: Brussels, Belgium, 2011.
2. European Commission. Draft Horizon 2020 Work Programme 2014–2015 in the Area of Secure, Clean and Efficient Energy; European Commission: Brussels, Belgium, 2015.
3. Nolte, I.; Strong, D. Europe’s Buildings under the Microscope; Buildings Performance Institute Europe: Bruxelles, Belgium, 2011.
4. Sartori, I.; Hestnes, A.G. Energy use in the life cycle of conventional and low-energy buildings: A review article. Energy Build. 2007, 39, 249–257. [CrossRef]
5. Cappello, M. Efficienza Energetica Degli Edifici; Grafill: Palermo, Italy, 2008.
6. ENEA—Agenzia nazionale per le nuove tecnologie, l’energia e lo sviluppo economico sostenibile. Strategia per la Riqualificazione Energetica del Parco Immobiliare Nazionale, Allegato 1; ENEA Report; ENEA: Rome, Italy, 2015. 7. Bonamente, E.; Pelliccia, L.; Merico, M.; Rinaldi, S.; Petrozzi, A. The Multifunctional Environmental Energy Tower: Carbon Footprint and Land Use Analysis of an Integrated Renewable Energy Plant. Sustainability
2015, 7, 13564–13584. [CrossRef]
8. Ma, Y.; Saha, S.C.; Miller, W.; Guan, L. Comparison of Different Solar-Assisted Air Conditioning Systems for Australian Office Buildings. Energies 2017, 10. [CrossRef]
9. Ghasemi-Fare, O.; Basu, P. Predictive assessment of heat exchange performance of geothermal energy piles. Renew. Energy 2016, 86, 1178–1196. [CrossRef]
10. Self, S.J.; Reddy, B.V.; Rosen, M.A. Geothermal heat pump systems: Status review and comparison with other heating options. Appl. Energy 2013, 101, 341–348. [CrossRef]
11. European Parliament. Directive 2009/28/EC of the European Parliament and of the Council of 23 April 2009 on the promotion of the use of energy from renewable sources and amending and subsequently repealing Directives 2001/77/EC and 2003/30/EC. In Official Journal of the European Union L 140; European Parliament: Bruxelles, Belgium, 2009; p. 47.
12. Shortall, R.; Davidsdottir, B.; Axelsson, G. Geothermal energy for sustainable development: A review of sustainability impacts and assessment frameworks. Renew. Sustain. Energy Rev. 2015, 44, 391–406. [CrossRef] 13. Bu, X.; Ma, W.; Li, H. Geothermal energy production utilizing abandoned oil and gas wells. Renew. Energy
2012, 41, 80–85. [CrossRef]
14. Bonamente, E.; Moretti, E.; Buratti, C.; Cotana, F. Design and monitoring of an innovative geothermal system including an underground heat-storage tank. Int. J. Green Energy 2016, 13, 822–830. [CrossRef]
15. Bonamente, E.; Aquino, A.; Cotana, F. A PCM Thermal Storage for Ground-source Heat Pumps: Simulating the System Performance via CFD Approach. Energy Procedia 2016, 101, 1079–1086. [CrossRef]
16. Environmental Management—Life Cycle Assessment—Priciples and Framework; ISO 14044; ISO: Geneva, Switzerland, 2016.
17. Environmental Management—Life Cycle Assessment—Requirements and Guidelines; ISO 14040; ISO: Geneva, Switzerland, 2016.
18. Finnveden, G.; Hauschild, M.Z.; Ekvall, T.; Guinée, J.; Heijungs, R.; Hellweg, S.; Koehler, A.; Pennington, D.; Suh, S. Recent developments in life cycle assessment. J. Environ. Manag. 2009, 91, 1–21. [CrossRef] [PubMed] 19. De Lieto Vollaro, R.; Calvesi, M.; Battista, G.; Evangelisti, L.; Botta, F. Calculation model for optimization
design of low impact energy systems for buildings. Energy Procedia 2014, 48, 1459–1467. [CrossRef] 20. Moretti, E.; Bonamente, E.; Buratti, C.; Cotana, F. Development of innovative heating and cooling systems
using renewable energy sources for non-residential buildings. Energies 2013, 6, 5114–5129. [CrossRef] 21. Moretti, E.; Barbanera, M.; Foschini, D.; Buratti, C.; Cotana, F. Energy and Environmental Performance
Analysis of Biomass-fuelled Combined Cooling and Heating System for Commercial Building Retrofit: An Italian Case Study. Energy Procedia 2016, 101, 376–383. [CrossRef]
22. A Life Cycle Impact Assessment Method Which Comprises Harmonised Category Indicators at the Midpoint and the Endpoint Level. Available online:https://www.researchgate.net/publication/302559709_ReCiPE_ 2008_A_life_cycle_impact_assessment_method_which_comprises_harmonised_category_indicators_at_
the_midpoint_and_the_endpoint_level(accessed on 11 November 2017).
© 2017 by the authors. Licensee MDPI, Basel, Switzerland. This article is an open access article distributed under the terms and conditions of the Creative Commons Attribution (CC BY) license (http://creativecommons.org/licenses/by/4.0/).