LIF DIAGNOSTIC ON WOODEN ARTWORKS:
MEASUREMENTS OF PAINTED WOOD CORNERS
OF GRAN PODER CANOPY
FRANCESCO COLAO, LUISA CANEVE, ROBERTA FANTONI ENEA - Unità Tecnica Sviluppo di Applicazioni delle Radiazioni
Centro Ricerche Frascati, Roma
PILAR ORTIZ, ROCÍO ORTIZ, JOSE MARÍA MARTÍN
Dept. de Sistemas Físicos, Químicos y Naturales, Univ. Pablo de Olavide, Carr. de Utrera km 1 41013 Sevilla, Spain
MARÍA AUXILIADORA GÓMEZ-MORÓN, JOSÉ LUIS GÓMEZ VILLA Instituto Andaluz del Patrimonio Histórico, Avenida de los Descubrimientos S/N
41092 Sevilla, Spain MARÍA AUXILIADORA VÁZQUEZ
Dept. de Cristalografía, Mineralogía y Química Agrícola, Univ. de Sevilla, C/Prof. G.González 41012 Sevilla, Spain
AGENZIA NAZIONALE PER LE NUOVE TECNOLOGIE, LʼENERGIA E LO SVILUPPO ECONOMICO SOSTENIBILE
LIF DIAGNOSTIC ON WOODEN ARTWORKS:
MEASUREMENTS OF PAINTED WOOD CORNERS
OF GRAN PODER CANOPY
FRANCESCO COLAO, LUISA CANEVE, ROBERTA FANTONI ENEA - Unità Tecnica Sviluppo di Applicazioni delle RadiazioniCentro Ricerche Frascati, Roma
PILAR ORTIZ, ROCÍO ORTIZ, JOSE MARÍA MARTÍN
Dept. de Sistemas Físicos, Químicos y Naturales, Univ. Pablo de Olavide, Carr. de Utrera km 1 41013 Sevilla, Spain
MARÍA AUXILIADORA GÓMEZ-MORÓN, JOSÉ LUIS GÓMEZ VILLA Instituto Andaluz del Patrimonio Histórico, Avenida de los Descubrimientos S/N
41092 Sevilla, Spain MARÍA AUXILIADORA VÁZQUEZ
Dept. de Cristalografía, Mineralogía y Química Agrícola, Univ. de Sevilla, C/Prof. G.González 41012 Sevilla, Spain
I contenuti tecnico-scientifici dei rapporti tecnici dell'ENEA rispecchiano l'opinione degli autori e non necessariamente quella dell'Agenzia.
The technical and scientific contents of these reports express the opinion of the authors but not necessarily the opinion of ENEA.
I Rapporti tecnici sono scaricabili in formato pdf dal sito web ENEA alla pagina http://www.enea.it/it/produzione-scientifica/rapporti-tecnici
LIF DIAGNOSTIC ON WOODEN ARTWORKS:
MEASUREMENTS OF PAINTED WOOD CORNERS OF GRAN PODER CANOPY
FRANCESCO COLAO, LUISA CANEVE, ROBERTA FANTONI, PILAR ORTIZ, ROCÍO ORTIZ, JOSE MARÍA MARTÍN, MARÍA AUXILIADORA GÓMEZ-MORÓN, JOSÉ LUIS GÓMEZ VILLA, MARÍA AUXILIADORA VÁZQUEZ
Sommario
Il presente lavoro è stato svolto nell’ambito di una collaborazione scientifica fra ENEA UTAPRAD e il Dip. di Scienze Naturali dell’UPO (Siviglia), volta allo sviluppo e alla sperimentazione di strumentazione innovativa per la conservazione di Beni Culturali. In questo rapporto si riportano i risultati ottenuti in una campagna congiunta eseguita a Siviglia nel febbraio del 2012. In particolare si illustra quanto ottenuto nelle scansioni eseguite sul “pascua passo del Gran Poder” di Ruiz Gijón (1688-1692), Siviglia (SP) su superfici lignee dipinte, nel corso del progetto di ricerca sulle tecnologie non distruttive diretto dallo IAPH, che ha incluso i presenti risultati nel suo progetto di conservazione. La tecnica impiegata ha consentito l’identificazione di aree ritoccate, il rinvenimento di segni di precedenti restauri non altrimenti documentate e la rivelazione di sostanze chimiche sulle superfici lignee esaminate.
Parole chiave: LIF, analisi di immagini, superfici linee dipinte, consolidanti.
Abstract
Within the frame of a scientific cooperation between ENEA UTAPRAD (Frascati) and UPO Natural Sciences Dep. (Seville), aimed at developing and testing innovative diagnostic instrumentation for Cultural Heritage preservation, this report deals with results obtained in a joint campaign carried on in Seville during February 2012.
Here we report the results obtained for scans made on wood paintings of Gran Poder Canopy of Ruiz Gijón (1688-1692), in Seville (SP). Gran Poder Canopy has been studied according to the Research Project of “Non Destructive Techniques” managed by IAPH (Consejería de Cultura de la Junta de Andalucía). The results have been also implemented as part of a conservation project carried out by IPAH.
The applied technique allows the determination of retouches, traces of former restorations and detection of chemicals (varnish) on the surface under analysis not otherwise documented.
INDEX
Sommario ... 3
Abstract ... 3
1. Introduction ... 7
2. LIF scanning set-up ... 8
2.1. Wooden samples analyzed by LIF ... 9
2.2. LIF Data acquisition ... 10
3. Results of LIF diagnostic ... 11
3.1. LIF and PCA Studies before and after the restoration on tables C, D and F ... 12
3.2. LIF and PCA studies after restoration ... 14
3.3. Digital Image Analysis ... 17
3.3.1. Digital Image Analysis of Table A ... 17
3.3.2. Digital Image Analysis of Table B ... 19
3.3.3. Digital Image Analysis of Table C ... 20
3.3.4. Digital Image Analysis of Table D ... 21
3.3.5. Digital Image Analysis of Table E ... 21
3.3.6. Digital Image Analysis of Table F ... 22
3.3.7. Digital Image Analysis of Table G ... 23
3.3.8. Digital Image Analysis of Table H ... 24
4. CONCLUSIONS ... 26
1. Introduction
Within the frame of a scientific cooperation between ENEA UTAPRAD (Frascati) and UPO Physical, Chemical and Natural Sciences Department. (Seville), a joint campaign aimed for developing and testing innovative diagnostic instrumentation for Cultural Heritage preservation was carried out in Seville, by means of the ENEA patented LIF scanning prototype. The system is capable to remotely acquire hyperspectral images operating either in the reflectance mode, after a visible lamp excitation, or in fluorescence mode following ultraviolet laser excitation. Under this framework, the Gran Poder Canopy has been studied according to the Research Project of “Non Destructive Techniques” managed by IAPH (Consejería de Cultura de la Junta de Andalucía). The results have been also implemented as part of a conservation and research project carried out by IPAH.
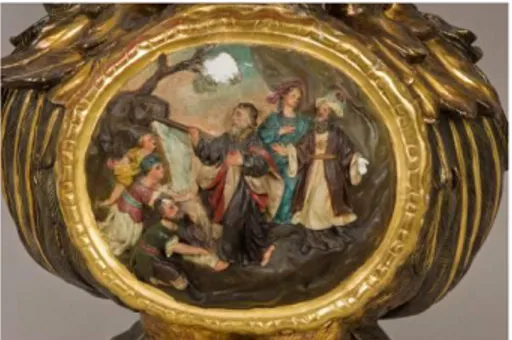
Jesus del Gran Poder´s canopy (paso) was built between 1688 and 1692, as a mobile pedestal in order to translate the Sacred image for the streets of Seville, during the Holy Week annual procession. This work is conceived as a pedestal or mobile altarpiece, made of wood carved and fret, looking as an inverted basket. This wood is worked with inlets and projections, that results in deep lights contrasts and theatrical Baroque effects.
In the surface, the piece is covered by golden bread, with carved and polychrome relieves.
There are twentyfour angels all around the pedestal, and another six, in academic size, on the top. The carved scenes or reliefs, and the biggest angels, are talking about Passion of Jesus Christ and other Christian symbols from the Old and the New Testament. They are reporting an evangelist message about God´s presence in the earth and His sacrifice for the humanity.
It is perfectly documented not only the order also the execution of the piece. The brotherhood of Jesús del Gran Poder, contracted to Francisco Ruiz Gijón, a sculptor from Utrera (Seville), to make the canopy in 1688 and he finished it in 1692. All the physical, morphological and iconographic properties, are perfectly specified in this contract, and it looks today since then. Francisco Ruíz Gijón, is a baroque well-known Spanish sculptor, that mixes in his jobs the classicism from the Seville school and by other way, the classic Italian baroque movement. He is a polychrome wood specialist, and is considered the best builder of baroque canopies.
This study is centred in a concrete area of the piece, exactly in the 8 tables (cartelas) that are carved as polychromated reliefs. They report several Old Testament´s scenes (Moses makes sprout water of Horeb's rock , Samson destroys Dagón's Temple and Noe´s arch) and from the New Testament (Jesus loads with the Cross to the shoulder, Jesus is Crowned with thorns, Jesus is detained, Flagellation, and the Parable of the Prodigal Son). They are all framed looking as ovals, and they result the main iconography items of the piece.
Jesús del Gran Poder´s canopy is the oldest conserved in the Sevillian Holy Week, and is still in use. More than a hundred of canopies have been handmade according this design since the 17th and 21st centuries, and the process continues nowadays.
2.
LIF scanning set-up
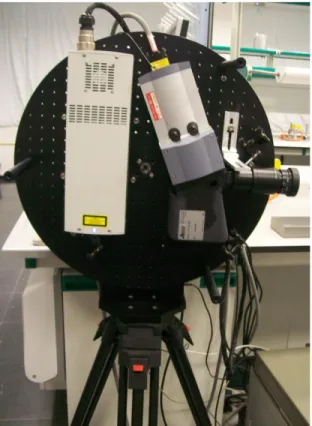
A LIF scanning instrument capable to collect hyperspectral fluorescence images on large areas has been designed and patented at the ENEA UTAPRAD-DIM [Colao F., Fantoni R., Fiorani L., Palucci A. “Dispositivo portatile a fluorescenza per la scansione spaziale di superfici, in particolare nell’ambito dei beni culturali” Patent RM2007A000278 (2007)]. The system was aimed at identifying and detecting the fluorescence signature of samples from a remote station [1-3].
For the purpose of the present measurements, the system was set up to detect the signature of pigment and consolidants on investigated samples; to this end the exciting laser was set up emitting in the UV at 266nm, while receiving detector was acquiring the full spectrum from 200nm to 850nm with a spectral resolution of 2.5nm. The spectroscopic detection system is spectrally calibrated, while radiometric calibration is not performed. Although the latter is necessary to get consistent spectral profiles, we do restrict the data analysis to the examination of a single emission band or at most of a small number of nearby bands, so we can neglect any further calibration.
Former work already pointed out LIF capabilities as non destructive diagnostic tool on painted surfaces [4,5]. The detection of the emitted fluorescence allows to identify the presence of substances capable to
be excited by UV radiation; indeed the adopted experimental technique was proven to detect the occurrence superficial contamination, and to identify extraneous materials onto the surface (biodeterioration, pollutant, waxes, some kinds of biological attack such as microalgae and fungi, presence of superficial contaminants, pigments and consolidants) [6-8].
Figure 1 – Compact LIF line scanning. A line scan is performed by mean of an accurate stepping motor. The emitted fluorescence is focused on the entrance of a receiver objective directly coupled a spectrograph and an ICCD camera for data acquisition.
Wooden samples analyzed by LIF
The samples under study painted wooden corners of an ancient canopy belonging to the
Arciconfraternita del Gran Poder Seville, Spain. The finely painted wooden corner, shown in Figure 1,
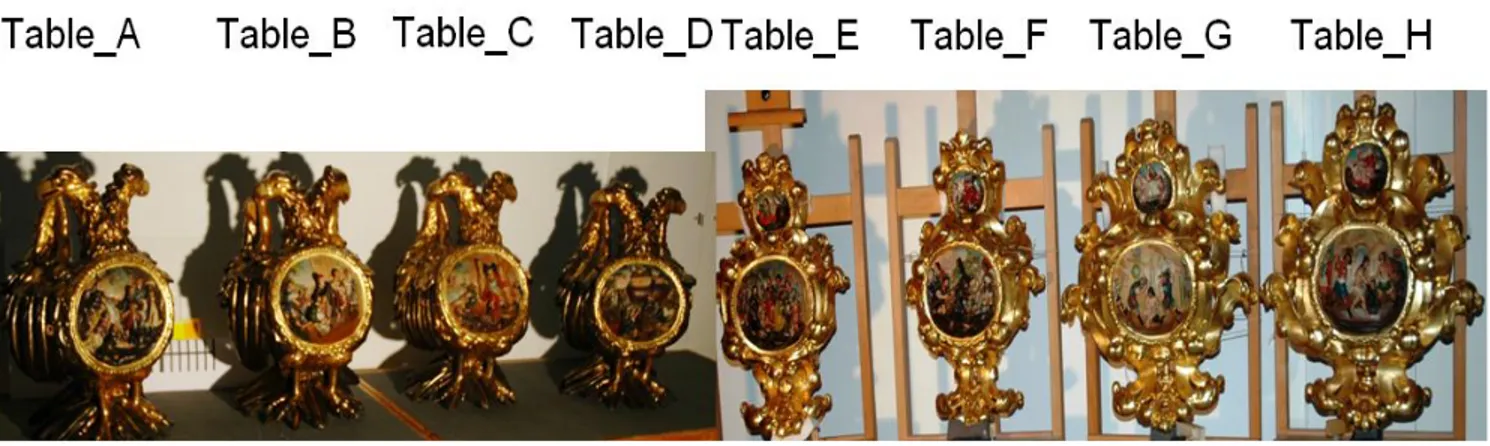
Figure 2 – Painted wooden corners tested with the LIF system; the wooden tables are named Table_A to Table_H.
Each table represents one episode of the New or Old Testament. A. Moses bringing forth water in the rock of Horeb B. Return of the Prodigal Son
C. Samson destroying the Temple of Dagon D. Entry of animals in Noah's Ark
E. Apprehension
F. Jesus helped by Simon of Cyrene in the Street of Bitterness
G. Jesus is crowned with thorns as king of the Jews. (Crown of thorns) H. Flagellation
While the single releives are mainly about the Old Testament and are located in the corners of the canopy, the doubles tables that are located middle of each side of the canopy mainly represent the Passion of Jesus, least the table of the return of the Prodigal Son.
These tables were hand-made by Ruiz Gijón and were repainted in 1853 [9].(IAPH, 2012).
LIF Data acquisition
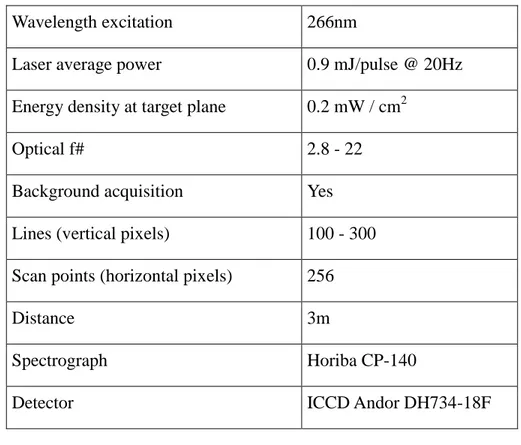
The hyper spectral LIF apparatus has been operated to perform several scans on the wooden samples, using 266nm excitation wavelength. The details of the experimental conditions are reported in Table 1.
Table 1 – Experimental settings for LIF line scan
Wavelength excitation 266nm
Laser average power 0.9 mJ/pulse @ 20Hz Energy density at target plane 0.2 mW / cm2
Optical f# 2.8 - 22
Background acquisition Yes Lines (vertical pixels) 100 - 300 Scan points (horizontal pixels) 256
Distance 3m
Spectrograph Horiba CP-140
Detector ICCD Andor DH734-18F
3.
Results of LIF diagnostic
Successive scans performed on the samples aimed to measure both the reflectance and the laser induced fluorescence. All reflectance images were acquired in low resolution mode, since they were only used to better identify the scanned portion; as a consequence the pigment analysis based on the reflectance spectra only is not possible or at least it is not optimal.
A preliminary measurement was also made to set the optimal operating parameters for the experimental set-up.
The most relevant spectral features of LIF spectra are identified by Principal Component (PC) analysis. Although the PCs do not possess any direct physical meaning, they can conveniently be described in terms of bands; since the LIF spectra result from linear combination of PC with appropriate weights
(scores), the presence of bands in PC may have a close correspondence on actual emission bands. As shown in the analysis here reported, a given PC usually has a well defined peaks and bands, while sometime exhibits complex shapes and frequent is the case of a bands with opposite sign swings. The occurrence of bands in PC is here considered as an indication of the existence of a physical bands which will be searched for in the actual LIF spectra.
LIF and PCA Studies before and after the restoration on
tables C, D and F
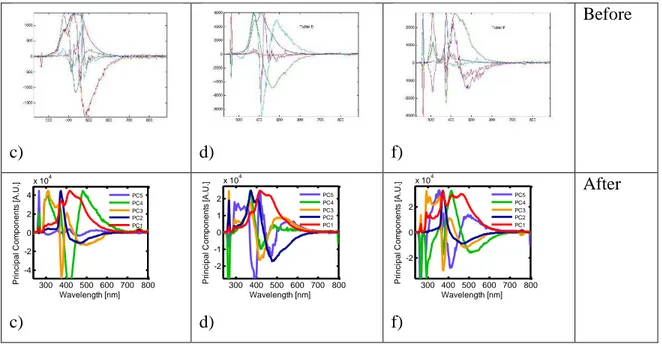
With the purpose of band identification, a PCA is run on the LIF scans of the wooden tables C, D and F before and after the restoration. The spectral loadings are shown in Figure 2. Only five principal components are considered, since they faithfully describe the entire spectral data set (overall explained variance > 85%).
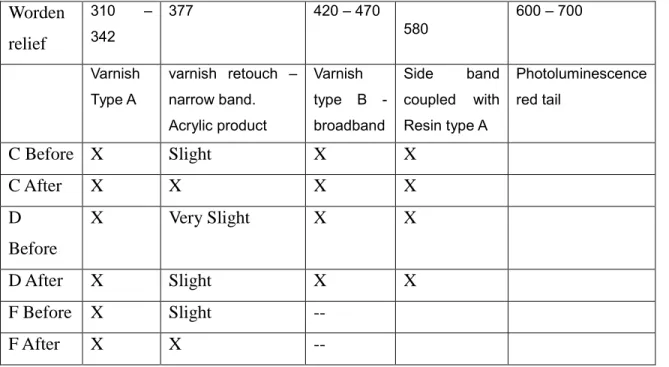
The spectral shape of the PC loadings is used to identify the prominent features; and candidates for physical LIF emission are listed in Table 3. The table 3 shows the spectrum features of the tables C, D and F scanned before and after the restoration.
Figure 2 - PCA of LIF scans of the wooden tables C, D and F before and after the restoration
c) d) f) Before c) d) f) After 300 400 500 600 700 800 -4 -2 0 2 4 x 10⁴ Wavelength [nm] P ri n ci p a l C o m p o n e n ts [A .U .] PC5 PC4 PC3 PC2 PC1 300 400 500 600 700 800 -2 -1 0 1 2 x 10⁴ Wavelength [nm] P ri n ci p a l C o m p o n e n ts [A .U .] PC5 PC4 PC3 PC2 PC1 300 400 500 600 700 800 -2 0 2 x 10⁴ Wavelength [nm] P ri n ci p a l C o m p o n e n ts [A .U .] PC5 PC4 PC3 PC2 PC1
Table 3 - Spectrum features of the tables C, D and F scanned before and after the restoration. Worden relief 310 – 342 377 420 – 470 580 600 – 700 Varnish Type A varnish retouch – narrow band. Acrylic product Varnish type B - broadband Side band coupled with Resin type A Photoluminescence red tail C Before X Slight X X C After X X X X D Before X Very Slight X X D After X Slight X X F Before X Slight -- F After X X --
Table C presents the evidence of the products used in previous restoration with a band at 320 nm (width 5 nm) and the product used in the current restoration with a narrow peak at 377nm due to the use of acrylic product. These results can be extended to other tables, as it has been also detected on table F though they are slight.
On table F, some bands arround 400nm could be due to the presence of nanoparticles of metals according to previous studies [10,11]. These nanoparticles has not been used during the current restoration and they are not been detected by SEM. Further investigations would be necessary in this case.
On the table D, very few retouches have been detected after the restoration according to the intervention project. Before the restoration, the spectral surface study shows diffuse and not well-defined retouches, where some zones do not present the peak of the varnish at 320 nm surely due to the presence of dirtiness. After the cleaning, the spectrum of the surface becomes homogenous and the varnish cover all the surface. This fact is according to a very slight interventions, where the cleaning stopped before the varnish was disappearing. In this sense, LIF could be use as a technique for the control and validation of the restoration work.
LIF and PCA studies after restoration
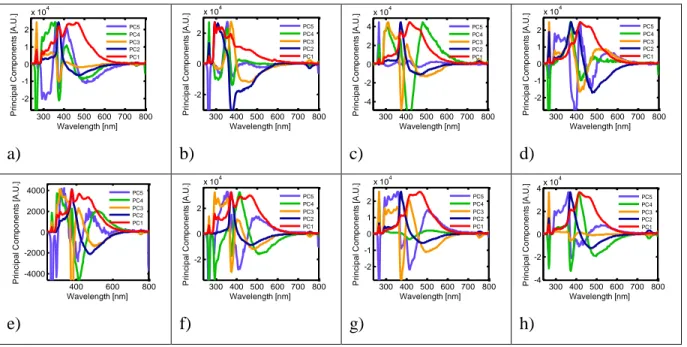
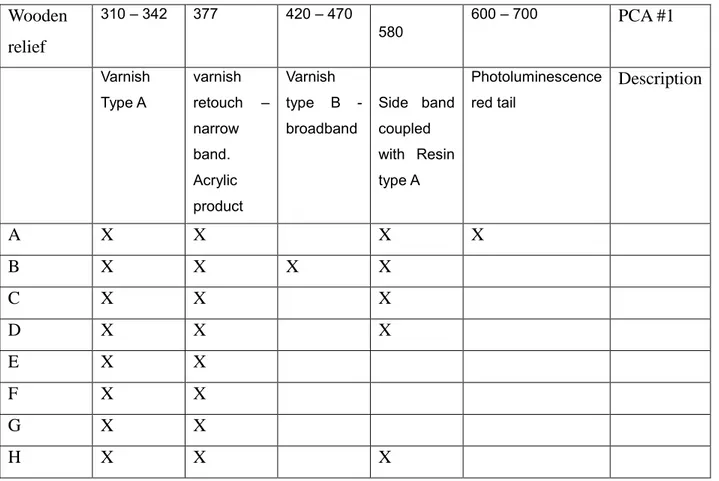
After the restoration, the eight relieves have been studied with the purpose of applying the methodology developed for LIF and PCA to the previous study (section 3.2). The PCA is run on all the LIF scans and the spectral loadings are shown in figure 3 for the wooden tables A to H, meanwhile figure 4 shows the PCA #1. According to the previous analysis, only five principal components are considered, since they faithfully describe the entire spectral data set (overall explained variance > 85%). The spectral shape of the PC loadings is used to identify the prominent features; and candidates for physical LIF emission is listed in Table 4. The table 4 shows the spectrum features found in each tables according to the PCA analysis of LIF images.
Figure 3 - PCA of LIF scans of the eight wooden tables A-H after the restoration
a) b) c) d) e) f) g) h) 300 400 500 600 700 800 -2 -1 0 1 2 x 10⁴ Wavelength [nm] P ri n ci p a l C o m p o n e n ts [A .U .] PC5 PC4 PC3 PC2 PC1 300 400 500 600 700 800 -2 0 2 x 10⁴ Wavelength [nm] P ri n ci p a l C o m p o n e n ts [A .U .] PC5 PC4 PC3 PC2 PC1 300 400 500 600 700 800 -4 -2 0 2 4 x 10⁴ Wavelength [nm] P ri n ci p a l C o m p o n e n ts [A .U .] PC5 PC4 PC3 PC2 PC1 300 400 500 600 700 800 -2 -1 0 1 2 x 10⁴ Wavelength [nm] P ri n ci p a l C o m p o n e n ts [A .U .] PC5 PC4 PC3 PC2 PC1 400 600 800 -4000 -2000 0 2000 4000 Wavelength [nm] P ri n ci p a l C o m p o n e n ts [A .U .] PC5 PC4 PC3 PC2 PC1 300 400 500 600 700 800 -2 0 2 x 10⁴ Wavelength [nm] P ri n ci p a l C o m p o n e n ts [A .U .] PC5 PC4 PC3 PC2 PC1 300 400 500 600 700 800 -2 -1 0 1 2 x 10⁴ Wavelength [nm] P ri n ci p a l C o m p o n e n ts [A .U .] PC5 PC4 PC3 PC2 PC1 300 400 500 600 700 800 -4 -2 0 2 4x 10 4 Wavelength [nm] P ri n ci p a l C o m p o n e n ts [A .U .] PC5 PC4 PC3 PC2 PC1
Table 4 - Spectrum features of the tables C, D and F scanned before and after the restoration. Wooden relief 310 – 342 377 420 – 470 580 600 – 700 PCA #1 Varnish Type A varnish retouch – narrow band. Acrylic product Varnish type B - broadband Side band coupled with Resin type A Photoluminescence red tail Description A X X X X B X X X X C X X X D X X X E X X F X X G X X H X X X
The present non destructive LIF scanning study, supported by statistical analysis of the hyperspectral images collected has shown, that according to the previous study on the samples before and after the restoration, the PCA analysis extended to the eight tables can associated to retouches at 320nm, related to a previous documented restoration and at 377 nm related to the current restoration.
While retouched areas are very well evident, it is not possible to say if the pigment underneath is the same as in other portion of the tables by the fluorescence spectra alone due to the complex absorption/emission phenomena occurring at the multilayered painted surface.
About the eight wooden relieves scanned after the restoration, we have found evidences of use of two different restoration products or varnish: varnish that we calles type B, only used for table B (peaked at 320nm and shoulder at 580nm) and varnish called type A for all other tables (peaked at 480nm).
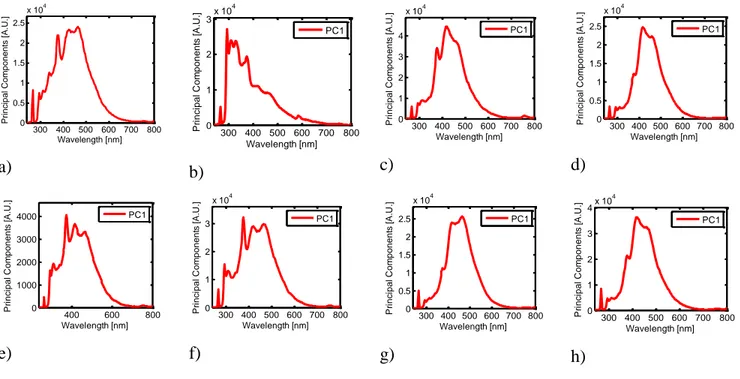
Furthermore, a detailed analysis of PCA # 1 of the 8 reliefs (figure 3), shows clearly that the table B has a spectral features different to the other, and it is possible to distinguish two groups between the samples with varnish A, one for tables A, E and F, and the other for tables C, D, G and H, though they are very similar. In this sense, further studies would be necessary.
Figure 4 - PCA·#1 of LIF scans of the eight wooden tables A-H after the restoration
a) b) c) d)
e) f) g) h)
Every tables have been scanned at the same moment of the restoration, and according to historical and iconographic analysis, every table is original and corresponds to the same date of realization (XVII Century). The only difference that has been found by the historians it is that the table B is not an episode of the passion of Jesus, what does not make clear its lecture, also this table was not mentioned in the description of Serrano y Ortega [12]. Moreover, the stratigraphic studies carried out by IAPH [13] show the presence of a unique layer in of pigment in the white part of the arm of the son that is composed by lead white and calcite. This analysis is not in correspondence with the historical data of the repainted carried out in the XIX Century. The LIF spectrum of table B, and the differences in the stratigraphy and the iconographic values highlight some clear difference on this table, though they are not enough to conclude a different author for this relief.
300 400 500 600 700 800 0 0.5 1 1.5 2 2.5 x 10⁴ Wavelength [nm] Principal Comp onent s [A .U.] 300 400 500 600 700 800 0 1 2 3x 10 4 Wavelength [nm] P ri n ci p a l C o m p o n e n ts [A .U .] PC1 300 400 500 600 700 800 0 1 2 3 4 x 10⁴ Wavelength [nm] P ri n ci p a l C o m p o n e n ts [A .U .] PC1 300 400 500 600 700 800 0 0.5 1 1.5 2 2.5 x 10⁴ Wavelength [nm] P ri n ci p a l C o m p o n e n ts [A .U .] PC1 400 600 800 0 1000 2000 3000 4000 Wavelength [nm] P ri n ci p a l C o m p o n e n ts [A .U .] PC1 300 400 500 600 700 800 0 1 2 3 x 10⁴ Wavelength [nm] P ri n ci p a l C o m p o n e n ts [A .U .] PC1 300 400 500 600 700 800 0 0.5 1 1.5 2 2.5 x 10⁴ Wavelength [nm] P ri n ci p a l C o m p o n e n ts [A .U .] PC1 300 400 500 600 700 800 0 1 2 3 4x 10 4 Wavelength [nm] P ri n ci p a l C o m p o n e n ts [A .U .] PC1
Titanium and Zinc White have been found in retouches of other parts of the canopy, so it could be possible that they were used on the tables in a previous restoration, and they could be the cause of the lower fluorescence intensity with less pronounced peak found in some cases [7].
The golden zones, evidence the presence of gilded borders, this part is restored by bold and mica powder, with golden films and paraloid.
Digital Image Analysis
According to the previous results, digital image analyses have been carried out on the eight reliefs after the restoration, in order to evaluate the surface extension of the compounds use in the restoration. For this objectives, false colour images has been used to separate zones with the same spectral characteristics.
3.2.1.
Digital Image Analysis of Table A
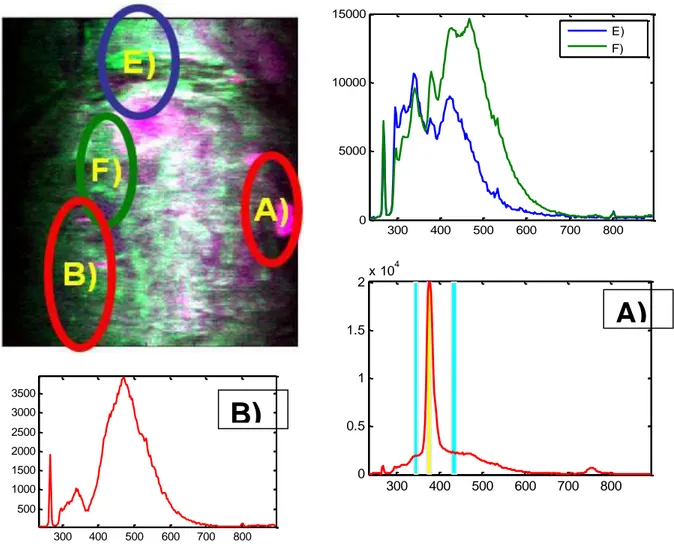
The digital image analysis applied to the relief A generate a RGB false colour LIF image built with spectral channel at 760nm, 313nm, 377nm evidence areas dominated by four different spectral contributions (figure 5). The pink area, distributed on several different points, is spectrally characterized by an emission band centred approximately at 377nm, shown in the right side of Figure 5, that could be do to retouches carried out during the last restoration with acrylic products.
Figure 5 – RGB false colour LIF image of table A (upper left) built with spectral channel at 760nm, 313nm, 377nm and spectrum from selected regions (right and bottom).
Figure 6 shows RGB false colour LIF image built with spectral channel at 760nm, 313nm, 377nm and retouches carried out during the last restoration with acrylic products. It seems clear that some of the signals are due to the last retouches (A),while there are other signals that could be from previous retouches (B). 300 400 500 600 700 800 500 1000 1500 2000 2500 3000 3500 300 400 500 600 700 800 0 5000 10000 15000 E) F) 300 400 500 600 700 800 0 0.5 1 1.5 2x 10 4
A)
B)
Figure 6 - Table A. RGB false colour LIF image (left) built with spectral channel at 760nm, 313nm, 377nm and retouches carried out during the last restoration (right, image from IAPH, Eugenio Fernández).
3.2.2.
Digital Image Analysis of Table B
Similar results are obtained on table B, the figure 7 shows the principal component analysis (PCA) of the LIF image. It seems clear that some of the signals are due to the last retouches (A),while there are other signals that could be from previous retouches (B). The pink area, distributed on several different points, is spectrally characterized by an emission band centred approximately at 377nm, shown in the plot B (blue line) of right side.
Figure 7- RGB false colour of table B LIF image (upper left) built with spectral channel at 760nm, 313nm, 377nm and spectrum from selected regions (right and bottom).
300 400 500 600 700 800 1 2 3 4 5 x 10⁴ A) B) C) A B
3.2.3.
Digital Image Analysis of Table C
A close observation of PCA of figure 1 for table C allows the identification of the candidates for the physical emission bands centred at 320nm, 377nm, 450nm and 580nm reported in table 3. The spectral loading of PC #1 (figure 3) is characterized by an intense band extending from 410 to 540nm and a shoulder at 377nm; the latter one is due to retouched areas that are seen in Figure 8. Te highly contrasted RGB image in Figure 8 is obtained by combining the fluorescent bands at 377, 313 and 760nm; representative spectra in areas dominated by different spectral contributions are clearly evident. The pink area, distributed on several different points, is spectrally characterized by an emission band centred approximately at 377nm, shown in the plot B (blue line) of right side Figure 8.
Figure 8 shows RGB false colour LIF image built with spectral channel at 760nm, 313nm, 377nm and retouches carried out during the last restoration with acrylic products. It seems clear that most of the zones detected are due to the last retouches (figure 8b), that has been carried out with acrylic products.
Figure 8 - RGB false colour of table C LIF image built with spectral channel at 760nm, 313nm, 377nm (left) and retouches carried out during the last restoration (right, image from IAPH, Eugenio Fernández).
3.2.4.
Digital Image Analysis of Table D
The highly contrasted RGB image in figure 9 is obtained by combining the fluorescent bands at 377, 313 and 760nm; representative spectra in areas dominated by different spectral contributions are similar to those reported in Figures 5 and 8. The pink area, evenly distributed in the right part, is spectrally characterized by an emission band centred approximately at 377nm. Figure 9 shows RGB false colour LIF image built with spectral channel at 760nm, 313nm, 377nm and retouches carried out during the last restoration with acrylic products are very low. In this case, it is clear that most of the signals must be caused by other products. Table D shows the least retouches that could be due to better conservation degree.
Figure 9- RGB false colour of table D LIF image built with spectral channel at 760nm, 313nm, 377nm (left) and retouches carried out during the last restoration (right, image from IAPH, Eugenio Fernández).
3.2.5.
Digital Image Analysis of Table E
The highly contrasted RGB image in Figure 10 is obtained by combining the fluorescent bands at 377, 313 and 760nm; representative spectra in areas dominated by different spectral contributions are similar to those reported in Figures 5 and 9. The pink areas, strongly diffused lower part of the table, are spectrally characterized by an emission band centred approximately at 377nm, that are associated to acrylic varnish.
Figure 10 - RGB false colour of table E LIF image built with spectral channel at 760nm, 313nm, 377nm.
3.2.6.
Digital Image Analysis of Table F
The highly contrasted RGB image in Figure 11 is obtained by combining the fluorescent bands at 377, 313 and 760nm; representative spectra in areas dominated by different spectral contributions are similar to those reported in figures 5 and 10. The pink areas, strongly diffused table, are spectrally characterized by an emission band centred at 377nm.
Figure 11- RGB false colour of table F LIF image built with spectral channel at 760nm, 313nm, 377nm. 300 400 500 600 700 800 1 2 3 4 5 x 10⁴ A) B) C)
3.2.7.
Digital Image Analysis of Table G
Figure 12 shows the highly contrasted RGB image, obtained by combining the fluorescent bands at 377, 313 and 760nm; representative spectra in areas dominated by different spectral contributions are similar to those reported in Figures 5 and 11. The pink areas, strongly diffused lower painted Table, are spectrally characterized by an emission band centred at 377nm.
The horizontal line crossing the point B) is due to the fluorescence induced on a small rope used to keep the table in place.
Figure 12 - RGB false colour of table G LIF image built with spectral channel at 760nm, 313nm, 377nm (right) and retouches carried out during the last restoration (right, image from IAPH, Eugenio Fernández).
.
The comparison of the figure 13 built with RGB false colour LIF image built with spectral channel at 760nm, 313nm with one of the pictures taken during the restoration, shows that the retouches carried out during the last restoration with acrylic products correspond to most of the zone C, and the presence of similar spectral zones of previous restoration.
300 400 500 600 700 800 0.5 1 1.5 2 2.5 x 10⁴ A) B) C)
3.2.8.
Digital Image Analysis of Table H
Figure 13 is the highly contrasted RGB image, obtained by combining the fluorescent bands at 377, 313 and 760nm; representative spectra in areas dominated by different spectral contributions are similar to those reported in Figures 5 and 12. The pink areas, strongly diffused, are spectrally characterized by an emission band centred at 377nm.
Figure 13 - RGB false colour of table H LIF image built with spectral channel at 760nm, 313nm, 377nm (right) and retouches carried out during the last restoration (right, image from IAPH, Eugenio Fernández).
In the same figure the RGB false colour LIF image built with spectral channel at 760nm, 313nm, 377nm in compared to a picture taken during the restoration with the retouches carried out during the last restoration with acrylic products. In these case, it is clear that there are a lot of previous restoration with a signature spectral similar to the acrylic spectra product signature.
In summary, figure 14 shows the gray digital image analysis corresponding to the band analysis at 377nm, with bandwith of 10nm for the eight wooden tables. It is clear the zones that have been retouched, some of them during the last restoration as they are well identified according to the restoration project and other that must be from previous restoration. These results imply that LIF associated to PCA and digital image analysis could be used as a checking tool to asses the retouches and restoration of an wooden artwork.
300 400 500 600 700 800 1 2 3 4 5 x 10⁴ A) B) C)
Figure 14 - Grey false colour images of the eight LIF image built with spectral signal at 377 nm and bandwith 10nm that shows the retouches carried out during with acrylic products.
a) b) c) d)
e) f) g) h)
To the purpose of precise localization, we report in Figure 15 the fluorescence intensity of band at 377nm: the latter figure has been obtained as the difference of the signal intensity centred at 377 nm minus the slanted baseline between 325nm and 400nm, showing that the precise retouch localization, before and after restoration. In this comparison we may notice that among double tables only table e) shows significant retouches in the upper oval. Furthermore, as previously discussed, table d) shows traces of significant milder interventions than all the others.
a) b) c)
Figure 15 – A) Conventional photo of the Table_F, B) pixels with signals at 377nm before the restoration C) pixels with signals at 377 nm after the restoration.
4. CONCLUSIONS
The most relevant spectral features of LIF spectra are identified by principal component analysis (PCA). Although the PCs do not possess any direct physical meaning, they can conveniently be described in terms of bands; since the LIF spectra result from linear combination of PC with appropriate weights (scores), the presence of bands in PC may have a close correspondence on actual emission bands.
As shown in the analysis here reported, a given PC usually has a well defined peaks and bands, while sometime exhibits complex shapes and is the case of a bands with opposite sign which swings is frequenty encountered. The occurrence of bands in PC is here considered as an indication of the existence of a physical bands which will be searched for in the actual LIF spectra.
Discussion of the LIF and PCA data allow us to conclude that the use of the band analysis for spectral ratio F460/F377 is interest to document use of different varnishes, the peak centred at of 377nm show the presence of acrylic varnish to cover and or consolidate the retouches.
The combination of LIF, PCA and digital image analysis allow to discriminate among different superficial treatments and if these techniques are employed during the restoration, their application results in a fruitful tool to check the intervention process.
5. References
1. F.Colao, L.Caneve, A.Palucci, R.Fantoni, L.Fiorani, “Scanning hyperspectral lidar fluorosensor for fresco diagnostics in laboratory and field campaigns”, Lasers in the Conservation of Artworks (LACONA VII), Ed.s J.Ruiz, R.Radvan, M.Oujja, M.Castillejo, P.Moreno, CRC Press, 149–155, (2008).
2. L.Caneve, F.Colao, R. Fantoni, L.Fornarini, “Laser induced fluorescence analysis of acrylic resins used in conservation of cultural heritage”, Proceedings of OSAV’2008, The 2nd Int. Topical Meeting on Optical Sensing and Artificial Vision, St. Petersburg, Russia, (2008) pp.57- 63.
3. Caneve L., Colao F., Fantoni R., Fiorani L., Fornarini L. “Compact scanning hyperspectral lidar fluorosensor for the discrimination of varnishes and consolidants” Tiano P., Pardini C. (eds.), In Situ Monitoring of Monumental Surfaces, Edifir, Florence, Italy (2008)
4. Borgia, R. Fantoni, C. Flamini, T.M. Di Palma, A. Giardini Guidoni, A. Mele, “Luminescence from pigments and resins for oil paintings induced by laser excitation”, vol.127-129, pp.95-100 (1998).
5. D. Anglos, M. Solomidou, I. Zergioti, V. Zaffiropulos, T.G. Papazoglou, C. Fotakis, Laser-induced fluorescence in artwork diagnostics: an application in pigment analysis, Appl. Spectrosc. 50, (1996) pp.1331-1334.
6. F. Colao, R. Fantoni, L. Fiorani, A. Palucci, “Application of a scanning hyperspectral lidar fluorosensor to fresco diagnostics during the CULTURE 2000 campaign in Bucovina” Revista Monumentelor Istorice / Review of Historical Monuments n. LXXV/1-2 (Bucharest, 2006) pp. 53-61
7. F. Colao, L. Caneve, L. Fiorani, A. Palucci, R. Fantoni, M. P. Ortiz, M. A. Gómez, M. A. Vázquez, Report on LIF measurements in Seville - Part 1: Virgen del Buen Aire chapel, ENEA RT XX/2011 (in press).
8. F. Colao, L. Caneve, L. Fiorani, A. Palucci, R. Fantoni, M. P. Ortiz, M. A. Gómez, M. A. Vázquez, Report on LIF measurements in Seville - Part 2: Santa Ana church, ENEA RT XX/2011 (in press).
9. IAPH, 2012, Memoria Final de intervención del Paso Procesional de Jesús del Gran Poder de Sevilla.
10. Borgia. I., Bruni. S., Brinetti B., Bianchi C., Pradell T., Vendrell M. Lustre recipe from a Medieval workshop in Paterne. Archeometry, 43 (4), 2001, 455-460.
11. Lazic V., Colao F., Fantoni R., Palucci A., Spizzichino V., Borgia I., Brunetti B.G., Sgamellotti A. Characterisation of lustre and pigment composition in anciente pottery by laser indiced fluorescence and breakdown spectroscopy. Journal of Cultural Heritage 04 (2003), 303s-308s. 12. Serrano Ortega, M. “Noticia Histórico artística de la Sagrada Imagen de Jesús Nazareno que
con el título del Gran Poder se venera en la capilla de San Lorenzo de esta ciudad”. Imp. E. Rasco. Sevilla 1898. Reedición Extramuros facsímiles. Sevilla, 2008. P.129.
Edito dall’
Servizio Comunicazione
Lungotevere Thaon di Revel, 76 - 00196 Roma
www.enea.it
Stampa: Tecnografico ENEA - CR Frascati Pervenuto il 17.10.2013