1
ACT NOW: THE EFFECTS OF THE 2008 SPANISH
DISABILITY REFORM
MATTHEW J. HILL* JOSE I. SILVA** JUDIT VALL***
Abstract
The 2008 reform of the Spanish disability system reduced the benefits for individuals who have a short contributory history relative to their age. It also unintentionally introduced an incentive for individuals to apply for disability in the present. We use a lifecycle model and an empirical analysis to understand the overall impact of the reform. Our baseline estimates suggest that men and women who were affected by the reform were 46 and 22 percent more likely to be on permanent partial disability following the reform, respectively, and 55 and 46 percent more likely to be on total disability, respectively.
Keywords: disability benefits, lifecycle model, policy evaluation. JEL classification: C33, I18, H51.
1
A previous version of this paper was previously circulated under the name of “Evaluating the Impact of a reduction in the generosity of disability benefits: The 2008 Spanish reform”.
*UCLA and RAND. **Universitat de Girona.
***Department of Economics and IEB, Universitat de Barcelona & Centre for Research in Health and Economics, Pompeu Fabra University.
2 1. INTRODUCTION
Growing rates of disability in industrialized nations place a strain on government budgets; thus, countries have become progressively more interested in both curbing disability entry and reintegrating disabled individuals into the workforce (Autor & Duggan, 2003; Chen & Van der Klaauw, 2008). We evaluate one such effort in Spain, which aimed to lower the overall fiscal burden of providing disability benefits. We found that although the reform did lower benefit amounts, it had the unintended consequence of incentivizing individuals to apply for disability earlier in their life cycle. In 2008, the Spanish government introduced a reform in the contributory disability insurance (DI) system that considered the number of years an individual had contributed to the system up to that point. The reform treated all future years up to the retirement age of 65 as contributory years. Individuals with less than 35 contributory years (actual years contributed plus the individual’s remaining years until 65) were subject to the reform and received a reduced benefit amount.
The reform introduced two opposing incentives for disability application. On the one hand, the absolute value of disability benefits decreased for those under the 35 contributory year threshold. On the other hand, in the present, future years are counted as contributory years. Individuals’ current benefits will be at a maximum if they expect low labor force attachment going forward; therefore, they are incentivized to apply for disability now. Our analysis suggests that the second effect dominated the first.
Utilizing a large administrative dataset, we estimated that the reform increased the probability of DI entry by 46 percent for men and 22 percent for women. The effects are stronger for individuals with a higher degree of disability. Consistent with the predictions of a theoretical model, the effect of the reform is greater for individuals who had higher wages or could reasonably expect their contributory years to decrease in the future.
A confounding factor for our analysis is that the reform overlapped with the years of the Great Recession. Through increased unemployment, the recession may have created more conditional applicants (Autor and Duggan 2003; Maestas, Mullen, and Strand 2015), who are individuals with health impairments who would prefer to remain in the labor force but apply for disability upon job loss. We provide several additional robustness checks to show that our observed effects are not the sole result of the Great
3 Recession or by time invariant unobserved heterogeneity between the control (those unaffected by the reform) and treatment (those affected by the reform) groups.
Several recent papers have examined reforms made to disability systems and show that the design of a disability system can have a significant effect on applications.1 In the 1990s, and early 2000s, the Dutch government changed the replacement ratios, experience rating, and vocational rehabilitation plans and enacted stricter examination criteria (for a summary of these reforms, see Koning and Lindeboom, 2015). All of these reforms reduced the inflow rate into DI (Van Sonsbeek et al. 2013, Autor 2011). Most notably, De Jong et al. (2011) showed that stricter screening of disability applicants led to a reduction in long-term sickness absenteeism and a decline in disability insurance applications. Similar results were found in Finland by Korkeamäki et al. (2012), in which changes in the stringency of medical screening have had a direct effect on transitions into disability. Staubli (2011) analyzed a reform that increased the age at which conditions for disability insurance benefits are relaxed and found that enrollment to the disability system declined by 6 to 7.4 percentage points due to the policy change. In the Swedish context, Karlström et al. (2008) showed that abolishing special eligibility rules for workers aged 60 to 64 led to a small reduction in the entrance to disability after the reform. With respect to the private system, Autor et al. (2014) analyzed changes in the plan parameters of a large private long-term disability insurer and found that introducing lower replacement rates and longer waiting times significantly decreased the probability of applying for disability benefits. For Spain specifically, a recent paper by Vall Castello (2017) focused on a reform that abolished financial penalties to work for disabled individuals in one Spanish province. The reform increased the probability of working by 42 percent for disabled men in that province.2 Although the aforementioned reforms were largely successful in their aims, the Spanish reform was not and therefore reveals considerations for future policy-makers. First, reforms must take into account the dynamic nature of disability insurance. In a one-period setting, the Spanish reform lowered the incentive to apply for disability. However, in a multiperiod setting, the reform increased the incentive to apply in the present. Governments must be careful to consider how any change will affect the future
1
Several previous papers also analyzed policies to re-integrate the disabled into the labor market (Campolieti and Riddell 2012: Gruber 2000; Gruber and Kubik 1997; Marie and Vall Castello 2012). 2 Other papers have focused on Spain but address additional topics in disability policies such as the employment promotion of disabled workers (Silva and Vall Castello, 2017 or Marie and Vall Castello, 2012) or the impact of the Great Recession on disability inflows (Jimenez-Martin et al. 2017).
4 benefits stream for their reforms to have the desired effect. Consistent with Kreider (1998), who showed that uncertainty about future earnings increases disability application as individuals seek benefits to avoid labor market risks, we find that a primary driver of disability application is low expected labor force participation.3 In a context of depressed labor market opportunities, the steady income stream of disability is appealing. This result suggests that in times of economic uncertainty, disability rates may increase even if benefit amounts are low.
2. THE 2008 REFORM
The Spanish Social Security administration classifies disability by degree: partial, total, and severe; the degree depends on the working capacity lost. Partial disability includes individuals who are impaired for the fundamental tasks of their job or professional activity but are still capable of a different job or professional activity.4 Total disability occurs when the individual is impaired for all jobs and professional activities; severe disability is reserved for individuals who, as a result of anatomic or functional losses, require the assistance of a third person to aid in the essential activities of daily living. Given the small size (only 3 percent of the disability recipients) and inherent differences that characterize the severely disabled population, we excluded them from the analysis.5 For those eligible to receive a disability benefit, the benefit amount is multiplied by a percentage depending on the type of the disability: 55 percent for partial disability beneficiaries and 100 percent for total disability. 6 It is also important to note that a key distinction of the Spanish system is that many other disability systems require exit from full-time work upon disability receipt. In Spain, however, individuals may still work, as long as the job is not similar to the job held at the time of disability.
3
All the results of the empirical model are for disability entry (not disability applications). However, we believe that our results may be extended to disability application behavior because the acceptance rate does not change after the reform. Individuals will also have uncertainty about the probability of acceptance; however, an individual’s perceived acceptance probability should not differ before or after the reform.
4 It is important to note that even if partially disabled individuals are allowed to work, Silva et al. 2017 show that employment survival rates for newly partially disabled individuals are extremely low (1%) in Spain.
5 The application decision-making process for severe disability is likely different than the process for partial and total disability. We assume throughout the paper that individuals have some control over the timing of their disability application; this is not the case for severe disability because some form of social support is necessary given the seriousness of the condition.
6
To be eligible to receive a disability benefit, individuals must have contributed to the system for 1/4 of the years from the age of 20 until the age of their disability onset, with a minimum of 5 years. The eligibility requirements for those under 30 are slightly different. Because of these differences and because the 2008 reform only applied to individuals over 30, we limited our sample to individuals age 31 and older.
5 2.1 Disability formula after 2008 reform
In 2008, Spain reformed its disability system with the aim of discouraging applications from individuals who did not have long contributory histories.7 They did this by reducing the amount of benefits to individuals deemed to have short contributory histories relative to their age. However, what constituted a long or short contributory history? The government defined a new variable that we refer to as potential plus actual contributory years (hereafter PAC years), which is constructed as follows:
The formula gives individuals credit for the years that they have contributed to the Social Security system, and it assumes they will contribute for every year for the remainder of their working years (65 - current age). This assumption of full contribution for the remainder of the working years was made to avoid penalizing young workers who suffered from a disability early in their labor market career.
Disability benefit amounts for individuals with over 35 PAC years were untouched by the reform, whereas individuals below the 35 PAC year threshold had their benefit amount reduced by a percentage based on their PAC years.
Table 1. Benefit formula before/after the reform.
Benefit
Before the Reform Base*Type Percentage
After the Reform
Base*Type Percentage*PAC Percentage Definitions
Base
Ordinary illness: 0.86*average monthly wage last 8 years. Work unrelated accident: 0.86* average monthly wage in highest 24 earning months of the past 7 years.
Work related accident/illness: average wage of the past
7
The law was published in the BOE (Boletin Oficial del Estado) on December 5, 2007 and came into effect on January 1, 2008. The law was not discussed in any of the major newspapers in Spain. Only a few organizations of people with disabilities explained the content of the new law in their websites. However, this information in specialized websites was published at the end of December, only a few days before the law would come into force. Therefore, we are confident that there were no anticipatory effects.
6 year. Type Percentage Partial Disability: 55%8 Total Disability: 100% Severe Disability: 100%+50%
PAC Percentage Ranges from 50% for those with less than 15 PAC years to 100% for those with 35 or more PAC years
The PAC percentage, the new element introduced by the 2008 reform, takes a minimum value of 50 percent when the individual has 15 (or less) PAC years and gradually increases with the number of PAC years up to a maximum value of 100 for individuals with 35 (or more) PAC years.9
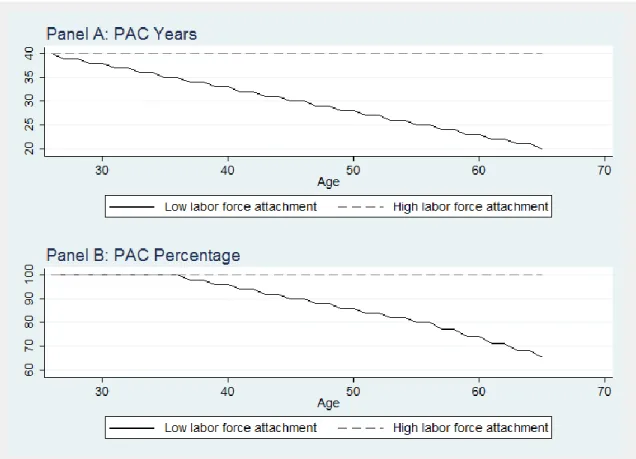
The PAC years calculation has one key feature: PAC years can only decrease as one ages. For each year that passes, an individual loses a potential year, but if they worked, they gain an actual contributory year, and thus, their PAC years are unchanged. However, if they do not work, their PAC years decrease by one year. Figure 1 illustrates the dynamics of PAC years over two hypothetical life courses.
In the figure, we simulate the PAC experience for two individuals, one with a labor market trajectory of full employment and the other with a labor market career in which the individual works only half the time. Both enter the labor market at age 25 with zero years contributed to the social security system, but they have 40 PAC years because of their 40 potential years remaining in the work force. For the individual with high labor force attachment, their PAC years remain at 40 for their life cycle because each lost potential year of age is replaced with an actual contributory year. The individual with low labor force attachment gradually loses PAC years because for every potential year that they lose as they age, they replace it with only 0.5 actual contributory years (Panel B). Both the low and high labor force attachment individuals have a full percentage (100) during their initial years in the labor force. However, the low labor force attachment individual crosses the 35 PAC year threshold at age 37, and thereafter the
8
Individuals older than 55 who experience difficulties finding a job due to lack of education or characteristics of the social and labor market of the region where they live can obtain 75% of the regulatory base.
7 PAC percentage applied to their disability amount decreases for the remainder of their working years.
Figure 1. Simulation of the effects of the reform for two different individuals
2.2 Trends in disability rates, pre and post 2008 reform
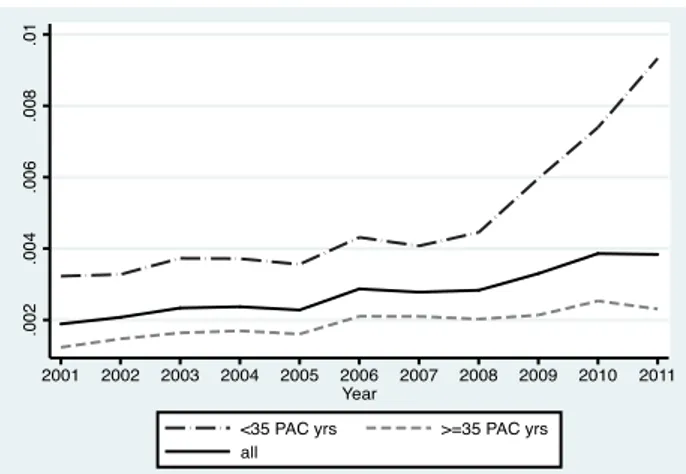
In Figure 2, we calculated the average entry rates into disability over time for two different regimes (partial disability and total disability). Figures 2A and 2B plot the rates for men whereas Figures 2C and 2D show the same for women. The figures show the disability entry rates for three groups: all individuals, those affected by the reform (<35 PAC years), and those unaffected by the reform (≥35 PAC years). Figures 2A, 2B, 2C, and 2D show that those affected and those unaffected by the reform exhibit similar trends in disability entry until 2008. Indeed, a statistical test fails to reject the hypothesis that the trends were parallel.10 After 2008, the trends diverge: disability entry rates increase slightly (and then decrease for total disability) for those unaffected by the reform whereas the rates skyrocket for those affected by the reform. We interpret this as
10 Formally, we tested the parallel trends assumption by interacting year fixed effects with a <35 PAC years indicator. We found no statistically significant effects of this interaction on disability entry prior to the reform.
8 suggestive evidence that the reform significantly increased the present value of disability benefits for those with less than 35 PAC years.
Figure 2A: Partial disability inflow 2001-2011 (men)
Figure 2B: Total disability inflow 2001-2011 (men)
9 Figure 2D: Total disability rates 2001-2011 (women)
Note: Calculated from the Continuous Sample of Working Lives (Muestra Continua de Vidas Laborales). 3. THEORETICAL MODEL BEFORE AND AFTER THE 2008 REFORM
In this section, we introduce a theoretical model to understand how the incentives to apply for disability benefits changed after the introduction of the 2008 reform. The goal of this model is to show a stylized illustration of the tradeoffs facing potential claimants before and after the reform. Burkhauser et al. (2003) show that the individual’s decision to apply for disability can be represented by using either a value option model or a dynamic programming model. As in Burkhauser et al. (2004), we used the second method and applied the Bellman principle of optimality.
3.1 The model before the reform
We consider a working life cycle setting for partially disabled individuals characterized by a deterministic age, t, between 18 and 65 years old (before retirement at age m). Time is discrete and the economy is in steady-state. An individual becomes disabled at each age with probability . Then, a disabled person can either be officially disabled and receiving disability benefits (D) or not (N). The nonofficially disabled individual must decide whether to apply for D-status. We assume that nonofficially disabled workers have a specific productivity level z, which is independent and identically distributed across age, with a cumulative distribution function F(z) and support [0,zmax]. Thus, the income of this type of worker has both an idiosyncratic component, z, and an aggregate component, . Moreover, because of the disability condition, there is a relative cost of being non-officially disabled . This parameter captures the productivity gap with respect to the nondisabled status.
10 The individual discounts future payoffs at a discount rate . All individuals who are officially disabled receive a pension equivalent to a proportion α of their average wage for the years previous to becoming disabled plus the wage . Officially disabled workers retain disability status in perpetuity. In contrast to Burkhauser et al. (2004), which models the US, we did not consider the decision to apply to the disability system within the context of the 2008 Spanish reform. The application process in Spain has less implicit costs than that in the US because workers do not need to lower their labor supply in order to apply (therefore none of the variables in the model are altered by the agent’s decision to apply). A second source of costs surrounding the DI application is uncertainty regarding acceptance of the application. We are interested in how the 2008 reform changes disability, and the reform did not change the rules governing the acceptance process. For these reasons, we placed the decision to apply outside the model.
The individual's value of not officially disabled, and the workers’ values of being officially disabled, , were used in the following two Bellman equations to describe the model:
(1)
(2) At the beginning of each new age, t+1, job productivity, z, is drawn from the general distribution F(z) with [0,zmax]. Individuals decide to become officially disabled if, for a given threshold level, the present-discounted return of being non-officially
disabled, , is lower than the value of being officially disabled, . Formally, the application rule is:
, (3) where is the probability of becoming officially disabled at age t+1.
An increase in will generate the incentive to become officially disabled since it increases the value of .
11 Post reform, the regulatory base, , is now multiplied by a fraction that increases with the PAC years. For simplicity, we assumed that the contributed years, is exogenous. Since decreases with t and increases with , individuals with several or long periods without contributing to the Social Security System will have a decreasing number of PAC years and will, at some point, go below the 35 years necessary to receive 100 percent of the benefits. Thus, it is reasonable to expect that, after the reform, the decision of applying for disability benefits not only depends on but also on the expected future value of along the working lifecycle. In detail, if the non-officially disabled individual expects that will change during the following years, then, for a given value of , he or she can modify his or her decision to become an officially disabled individual. To capture this scenario, we assume that the value of being disabled, , is now adjusted by the expected value of the individual’s working lifecycle, where is the expected number of contributory years for retirement at age m. Moreover, for simplicity, we assume that is given. Thus, means that an expected low labor force attachment will reduce the future value of being disabled and, therefore, the present value of being non-officially disabled.
Now, the two modified Bellman equations are:
(4)
(5) The reform has an ambiguous effect on the incentives to apply for disability benefits. This result can be explained by the presence of two effects that go in the opposite direction of one another. On the one hand, a lower value of due to a reduction in the number of PAC years will reduce the value of being an officially disabled worker, reducing the incentive to apply for this status and consequently the probability of being officially disabled. On the other hand, lower values of (because of lower expected PAC years) reduce the present-discounted return of being non-officially disabled, . As a result, the participation rule (3) tells us that the lower the value of , the higher the probability of applying for disability benefits since for a given , the value of decreases while remains constant. In other words, the lower the expected value of disability benefits along the working lifecycle,
12 the higher the probability of applying to the disability system during the current year. Notice that since cannot be lower than , then for all
t. Thus, the expected value of contributed years will be equal to the actual
value only if the individual will contribute to the Social Security System during the rest of his or her working life. In summary, our theoretical model suggests that those individuals with an expected lower labor force attachment for the remainder of their career will have a higher incentive to apply for disability benefits, increasing the DI inflow as a result of the reform.
Online appendix 1 simulates the model under different combinations of and . The simulated scenarios show that the policy change introduced incentives to apply to the DI system for individuals who expect to spend a number of periods without contributing to the social security system. The online appendix 1 also presents an alternative reform that eliminates the age component from the formula to calculate the actual PAC. This new formula is almost identical to the old-age retirement formula that already exists in Spain. Our alternative policy scenario shows that the probabilities of applying to the disability system are, most of the time, lower than the pre reform probability. This result occurs because eliminating the age component from the formula avoids the incentives to apply to the DI system for individuals with low labor force attachment.
4. DATA
We used the Continuous Sample of Working Lives (“Muestra Continua de Vidas Laborales”, MCVL), a microeconomic dataset based on administrative records provided by the Spanish Social Security Administration. This is a representative sample of individuals who have participated in the labor market. Each wave contains a random sample of 4 percent of all the individuals who interacted with the social security system (by working, receiving unemployment, receiving some type of pension, or being on disability) in the previous year. We combined the data from 6 waves starting with the 2006 wave and ending with the 2011 wave.11
11 It is rare that an individual would live in Spain for a period of six years and not interact with the SSA in some fashion. Other researchers have found that the MCVL is representative of the population. According to Ramos-Muñoz (2007) and Garcia Perez (2008), when comparing the LFS (Spanish Labour Force Survey) and the MCVL, the authors conclude that both datasets provide information of similar individuals and that the distribution of the employed population is extremely similar in both datasets.
13 The MCVL contains retrospective information on the entire employment and pension history of workers, including the exact duration and characteristics of employment, unemployment, disability and retirement spells. There is also information on personal characteristics, such as age, gender, nationality and level of education. Although the first wave was sampled in 2006, given the retrospective nature of the data, we are able to set 2001 as the first year of observation. Individuals were removed from our sample after their first year on disability because including individuals past the first year of disability would confound the effects on disability entrance with effects on disability retention.12 We also excluded individuals who entered the disability system due to a working accident because they are not affected by the policy change.13 We merged our individual data with macroeconomic variables from the Spanish “Instituto Nacional de Estadistica” to capture the economic business cycle.
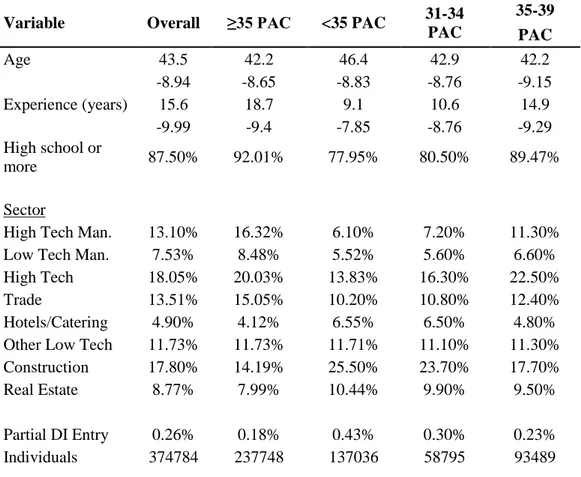
Table 2: Summary Statistics by PAC years
Panel A: Men
Variable Overall ≥35 PAC <35 PAC 31-34
PAC 35-39 PAC Age 43.5 42.2 46.4 42.9 42.2 -8.94 -8.65 -8.83 -8.76 -9.15 Experience (years) 15.6 18.7 9.1 10.6 14.9 -9.99 -9.4 -7.85 -8.76 -9.29 High school or more 87.50% 92.01% 77.95% 80.50% 89.47% Sector
High Tech Man. 13.10% 16.32% 6.10% 7.20% 11.30%
Low Tech Man. 7.53% 8.48% 5.52% 5.60% 6.60%
High Tech 18.05% 20.03% 13.83% 16.30% 22.50%
Trade 13.51% 15.05% 10.20% 10.80% 12.40%
Hotels/Catering 4.90% 4.12% 6.55% 6.50% 4.80% Other Low Tech 11.73% 11.73% 11.71% 11.10% 11.30% Construction 17.80% 14.19% 25.50% 23.70% 17.70% Real Estate 8.77% 7.99% 10.44% 9.90% 9.50% Partial DI Entry 0.26% 0.18% 0.43% 0.30% 0.23% Individuals 374784 237748 137036 58795 93489 12
In practice, disability is an absorbing state with less than 0.25 percent of the sample leaving the disability system after entering it.
13 Additionally, we removed 2979 men and 3763 women from the original sample who did not have any recorded contribution to the Social Security System because this is the variable that we use to create the treatment/control category.
14 Person-years 2982647 2029135 953512 447939 752712
Panel B: Women
Variable Overall ≥35 PAC <35 PAC 31-34
PAC 35-39 PAC Age 42.2 39.6 45.2 40.5 38.8 -8.24 -8.65 -8.06 -7.05 -7.13 Experience (years) 11.6 15.62 6.99 8.16 11.44 -8.84 -8.82 -6.24 -6.98 -7.26 H.S. or more 80.30% 90.37% 68.21% 74.97% 87.21% Sector
High Tech Man. 3.80% 5.36% 2.03% 2.40% 3.86%
Low Tech Man. 6.62% 6.74% 6.48% 6.32% 5.68%
High Tech 32.53% 38.34% 25.61% 28.37% 37.42%
Trade 16.12% 17.94% 13.95% 14.66% 15.70%
Hotels/Catering 9.03% 5.41% 13.33% 12.07% 7.45% Other Low Tech 12.22% 9.03% 16.02% 13.48% 9.89%
Construction 1.92% 2.04% 1.77% 1.90% 2.16%
Real Estate 11.67% 11.91% 11.39% 12.07% 12.93% Partial DI Entry 0.18% 0.11% 0.27% 0.16% 0.11%
Individuals 294684 155704 138980 50021 70554
Person-years 2272090 1234508 1037582 414470 545855
Table 2 shows the summary statistics stratified by less than 35 PAC years and more than 35 PAC years and for individuals within 4 years of the 35 PAC year cut-off.14 Our sample includes individuals aged 31 to 65 years old; we estimated a separate model for men and women. The sample of men included 374,784 individuals (2,982,647 person-year observations in total). The sample of women included 294,684 individuals (2,272,090 person-year observations in total). Individuals with less than 35 PAC years were less educated and were concentrated in low skill sectors. By definition, individuals with less than 35 PAC years will have lower labor force attachment, which is reflected in the experience variable. Given the differences between the two groups, we flexibly controlled for all observables in our empirical specification.
5. EMPIRICAL STRATEGY AND RESULTS 5.1 Estimating the effect of the 2008 reform
15 Our starting point to estimate the effect of the 2008 reform was a simple difference-in-difference specification. We included person-year observations for individuals between the ages of 31 and 65 that were observed in the years 2001 through 2011 from the MCVL. We estimated disability entrance separately for men and women and for partial and total disability, using equations of the form:
(8)
where is a dummy variable equal to 1 if an individual, i, in year t and region j
receives disability. We included both province ( and year fixed effects ( .
Treatment is a dummy variable equal to 1 if an individual has less than 35 PAC years
whereas post is a dummy variable equal to 1 if the observation occurs after the reform, i.e., in the years 2008-2011. The coefficient of interest is then , which will be the effect of the reform on disability entry for individuals whose benefits were reduced as a result of the reform. A crucial assumption in identifying the effect of the reform is that our outcome variable (disability entry) would have followed the same trend in the treatment (those with less than 35 PAC years) and control (those with more than 35 PAC years) groups in the absence of the policy change. Although we have shown in section 2 that both groups exhibited similar trends prior to the reform, Table 2 revealed stark differences between the groups. To begin to account for these differences, we included a rich set of individual and region-level controls ( . At the individual level, we controlled for age decile, a dummy for recent job separation, experience decile, a proxy for wages (average Social Security contributions at the last firm), education, and sector fixed effects. At the regional level, we controlled for the unemployment rate. An additional method of accounting for differences between the treatment and control groups is to limit the sample to a more comparable subset. To this end, we report results for the sample of individuals with between 31 and 39 PAC years. Although this group still exhibits some differences between those above the 35 PAC year cutoff and those below, this subsample will consist of more comparable individuals than the entire sample.15 We also report results from a preprocessing method that reweights the data such that the relevant covariates are balanced between the treatment and control groups,
15
Another possible control group could be those individuals with a PAC of less than 15 years. However, there are very few individuals in this category, and they are extremely different from the individuals who have more than 15 PAC years, so we cannot use them as a reliable control group. Furthermore, we do not have data on non-contributory disability beneficiaries, which could potentially also constitute a relevant control group.
16 thus making the estimated treatment effect independent of the covariates. Preprocessed data also have the advantage of being less model dependent than other techniques. To achieve data reweighting, we used entropy balancing, as described by Hainmueller (2012). Entropy balancing directly incorporates covariate balance into the weight function and allows for a large set of balance constraints. Therefore, entropy balancing delivers covariate distributions of the treatment and control groups in the preprocessed data that match all prespecified covariate moments.16
5.2 Primary Results
Table 3 reports the marginal effects from a logistic regression of equation (8) for the partial disability group, whereas Table 4 reports the results for the total disability group. Panel A displays the results for men whereas Panel B displays the results for women. In column (1), the marginal effect of the interaction between the treatment group and the post treatment dummy is positive and statistically significant at conventional levels for the baseline sample (columns 1-3). Men affected by the reform were 46 percent (22 percent for women) more likely to be on permanent partial disability following the reform and 55 percent (46 percent for women) more likely to be on total disability (these percentages are calculated using the mean of the dependent variable, which is also reported in the table). In columns 4-6, we show the results for the sample that is limited to individuals with between 31 and 39 PAC years, and in columns 7-9, we display the results when the observations are reweighted to be balanced on covariates. These estimates are smaller in magnitude but statistically significant at conventional levels with the exception of the partial disability sample of women. Overall, the results suggest that the reform substantially increased disability entry.
The primary possible confounding factor in our analysis is the financial crisis. Although the reform was implemented 10 months before the onset of the Great Recession, the bulk of the years after the reform overlap with the crisis years. Research has shown that disability rates are countercyclical with the economy (Rege et al. 2009; Black et al. 2002). However, in Spain, aggregate disability rates did not increase after the financial crisis, and in our microdata, we did not observe a large increase in disability entry following the crisis for our control group. Further, we controlled for both year fixed effects and the region-level unemployment rate, which should account for the bulk of
16
Table A5 in online appendix 3 shows the first and second moments of the relevant covariates after entropy balancing.
17 the crisis’ effect on disability entry. However, our treatment group has low labor force attachment, and it is possible that the global financial crisis disproportionately affected them. Our estimated effect of the reform may then be merely the effect of the financial crisis not accounted for by year fixed effects and the local unemployment rate. In an attempt to further control for the financial crisis, we allowed the effect of job loss to vary by year by including an interaction between the job loss variable and the year fixed effects (columns (2), (5), (8)). In columns (3), (6), and (9), we added an additional interaction between the local unemployment rate and job loss. These interactions will capture the effect of losing one’s job in a poor economic environment by both place and space. Even with this added interaction, we still observe a strong effect of the reform on the treated group. We interpret this result as evidence that the reform strongly induced disability application for those who were affected by the reform even after accounting for deteriorating economic conditions. Before the reform, treated individuals might have waited to apply for disability, either hoping to recover from their disability and return to their old profession or choosing to search for a job that would accommodate their limitations. After the reform, wary of lowering their benefit amount, they prioritized applying for disability.
Table 3: Effect of the 2008 reform on partial disability entry
Panel A: Men Whole Sample 31-39 PAC years Matching
(1) (2) (3) (4) (5) (6) (7) (8) (9) Treatment 0.0002* 0.0004*** 0.0004*** 0.0003** 0.0005** 0.0003** -0.000 -0.000 -0.000
(0.0001) (0.0001) (0.0001) (0.0002) (0.0002) (0.0002) (0.0002) (0.0002) (0.0002) Treat*Post 0.0012*** 0.001*** 0.001*** 0.0006*** 0.0003* 0.0004** 0.001*** 0.001*** 0.001***
(0.00012) (0.0001) (0.0001) (0.0002) (0.0002) (0.0002) (0.0003) (0.0003) (0.0003) Job Loss X Year
Interaction X X X X X X
Job Loss X
Unemployment X X X
Mean dep.Var. 0.0026 0.0026 0.0026 0.0025 0.0025 0.0025 0.0026 0.0026 0.0026 Observations 2725971 2725777 2725777 1103679 1103679 1103679 2725971 2725971 2725971 Panel A: Women Whole Sample 31-39 PAC years Matching
(1) (2) (3) (4) (5) (6) (7) (8) (9) Treatment 0.0003** 0.0004** 0.0004*** 0.0002* 0.0002* 0.0002* -0.0003 -0.0003 -0.0003
(0.0001) (0.0001) (0.0001) (0.0001) (0.0001) (0.0001) (0.0002) (0.0002) (0.0002) Treat*Post 0.0004*** 0.0003** 0.0003** 0.0002 0.0001 0.0001 0.0007* 0.0005 0.0005
(0.0001) (0.0001) (0.0001) (0.0002) (0.0002) (0.0001) (0.0004) (0.0003) (0.0003) Job Loss X Year
Interaction X X X X X X
Job Loss X
Unemployment X X X
Mean dep.Var. 0.0018 0.0018 0.0018 0.0013 0.0013 0.0013 0.0018 0.0018 0.0018 Observations 2083595 2083529 2083529 889992 889967 889967 2083595 2083595 2083595
18 ***p<.01, **p<0.05, *p<0.1
Notes: The regressions in columns 1-6 include the following additional covariates: average wage at previous firm, regional unemployment rate, region and year fixed effects, total employment spells, dummy variables for experience decile, age decile, sector, job separation dummy and a high school graduate dummy variable. Columns 7-9 are balanced on the following covariates: average wage at previous firm, regional unemployment rate, region and year fixed effects, total employment spells, dummy variables for age decile, sector, job separation dummy and a high school graduate dummy variable. Columns 8 and 9 are further balanced on the marked interaction terms.
Standard errors in parentheses are clustered at the individual level.
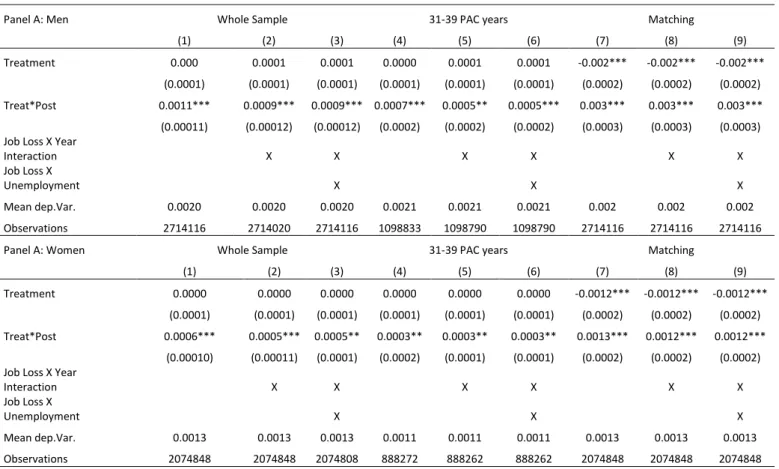
Table 4: The effect of the 2008 reform on total disability entry
Panel A: Men Whole Sample 31-39 PAC years Matching
(1) (2) (3) (4) (5) (6) (7) (8) (9) Treatment 0.000 0.0001 0.0001 0.0000 0.0001 0.0001 -0.002*** -0.002*** -0.002***
(0.0001) (0.0001) (0.0001) (0.0001) (0.0001) (0.0001) (0.0002) (0.0002) (0.0002) Treat*Post 0.0011*** 0.0009*** 0.0009*** 0.0007*** 0.0005** 0.0005*** 0.003*** 0.003*** 0.003***
(0.00011) (0.00012) (0.00012) (0.0002) (0.0002) (0.0002) (0.0003) (0.0003) (0.0003) Job Loss X Year
Interaction X X X X X X
Job Loss X
Unemployment X X X
Mean dep.Var. 0.0020 0.0020 0.0020 0.0021 0.0021 0.0021 0.002 0.002 0.002 Observations 2714116 2714020 2714116 1098833 1098790 1098790 2714116 2714116 2714116 Panel A: Women Whole Sample 31-39 PAC years Matching
(1) (2) (3) (4) (5) (6) (7) (8) (9) Treatment 0.0000 0.0000 0.0000 0.0000 0.0000 0.0000 -0.0012*** -0.0012*** -0.0012***
(0.0001) (0.0001) (0.0001) (0.0001) (0.0001) (0.0001) (0.0002) (0.0002) (0.0002) Treat*Post 0.0006*** 0.0005*** 0.0005** 0.0003** 0.0003** 0.0003** 0.0013*** 0.0012*** 0.0012***
(0.00010) (0.00011) (0.0001) (0.0002) (0.0001) (0.0001) (0.0002) (0.0002) (0.0002) Job Loss X Year
Interaction X X X X X X Job Loss X Unemployment X X X Mean dep.Var. 0.0013 0.0013 0.0013 0.0011 0.0011 0.0011 0.0013 0.0013 0.0013 Observations 2074848 2074848 2074808 888272 888262 888262 2074848 2074848 2074848 ***p<.01, **p<0.05, *p<0.1
Notes: The regressions in columns 1-6 include the following additional covariates: average contributions at previous firm, regional unemployment rate, region and year fixed effects, total employment spells, dummy variables for experience decile, age decile, sector, job separation dummy variable and a high school graduate dummy variable. Columns 7-9 are balanced on the following covariates: average wage at previous firm, regional unemployment rate, region and year fixed effects, total employment spells, dummy variables for age decile, sector, job separation dummy variable and a high school graduate dummy variable. Columns 8 and 9 are further balanced on the marked interaction terms.
Standard errors in parentheses clustered at the individual level.
19 In this section, we examine how the probability of disability entry differs by benefit level. Table 5, columns (1) and (2), includes an interaction between treatment in the post period and the individuals’ social security contributions at their previous firm (our wage proxy).17,18 Ceteris paribus, those who separate from their job at higher wage levels will have a greater incentive to apply for disability because their benefits will be higher than if they wait and either do not find a job or find a job with a lower wage (benefits are based on the previous 8 years of wages). The marginal effect of the interaction is positive and statistically significant for partial disability and total disability for men (Panel A and C, respectively). We found no statistically significant effect for women. The lack of an observed effect could be due to the wage data not reflecting women’s wages as accurately as men19
or, as secondary earners, women may not take the benefit level into account in disability application.
In columns (3) and (4), we explored how the amount of benefits lost affects the disability decision. To measure benefits lost, we constructed a variable (lostPAC) that represents the number of PAC years lost in the year prior. Individuals with higher
lostPAC values correspond to low levels of the labor force attachment in the prior year.
Individuals with larger drops may expect their potential benefits to be further reduced if their labor force participation continues to be tenuous and are therefore incentivized to apply for disability before their benefits fall further. The interaction between this variable and the treatment group in the post period is positive and statistically significant for all the observed samples, suggesting that the more PAC years lost in the year prior, the more likely the individual was to receive disability.
Taken together, the results of Table 5 confirm the predictions of the theoretical model. For individuals affected by the reform, those with a higher benefit amount (through higher wages) and those with the most to lose by waiting to apply for disability (through the potential of a lowered PAC percentage in subsequent years) were the most likely to enter into disability postreform.
17 Interactions are fully interacted, so all two-way interactions are included in the specification as well. 18 Recall that we do not have individual wage data but use a proxy instead (contributions to the SS administration).
19 This is because the labor market behavior of women is different in several dimensions from the labor market behavior of men. For example, women may be more subject to the minimum social security contribution (because they are more likely to work part-time and earn lower wages) so that the wage proxy that we use (social security contributions) may be a less accurate measure for women.
20 Table 5: Effect of reform on partial disability entry (interactions)
Partial Disability Panel A: Men (1) (2) (3) (4) Treat*Post 0.0019*** (0.0003) 0.0011*** (0.0003) 0.0009*** (0.0002) 0.0004* (0.0002) Treat*Post*Wage 0.0000006*** (0.0000002) 0.0000005*** (0.0000002) Treat*Post*lostPAC 0.0038*** (0.001) 0.0044*** (0.001)
Year X Job Loss X X
Mean Dep.Var. 0.0026 0.0026 0.0029 0.0029 Observations 2928561 2928561 2467330 2467330 Panel B: Women (1) (2) (3) (4) Treat*Post 0.0004* (0.0002) 0.0001 (0.0002) -0.0007*** (0.0002) -0.0009*** (0.0002) Treat*Post*Wage 0.0000003 (0.0000002) 0.0000002 (0.0000002) Treat*Post*lostPAC 0.0034*** (0.00060) 0.0036*** (0.00057)
Year X Job Loss X X
Mean Dep.Var. 0.0019 0.0019 0.002 0.002 Observations 2218512 2218512 1896503 1896503 Total Disability Panel C: Men (1) (2) (3) (4) Treat*Post 0.0014*** (0.0003) 0.0010*** (0.0003) 0.0006*** (0.0002) 0.0004* (0.0002) Treat*Post*Wage 0.0000003* (0.0000002) 0.0000003* (0.0000002) Treat*Post*lostPAC 0.0025*** (0.001) 0.0031*** (0.001)
Year X Job Loss X X
Mean Dep.Var. 0.002 0.002 0.0023 0.0023 Observations 2915317 2915317 2456876 2456876 Panel D: Women (1) (2) (3) (4) Treat*Post 0.0005*** (0.0002) 0.0004** (0.0002) -0.0002 (0.0001) -0.0003* (0.0001) Treat*Post*Wage 0.0000000 (0.0000002) -0.0000000 (0.0000002) Treat*Post*lostPAC 0.0012** (0.0005) 0.0014*** (0.0005)
21
Year X Job Loss X X
Mean Dep.Var. 0.0013 0.0013 0.0014 0.0014 Observations 2208637 2208637 1889015 1889015
***p<.01, **p<0.05, *p<0.1
Notes: The regressions in columns 1-4 include the following additional covariates: social security contributions at the previous firm, regional unemployment rate, region and year fixed effects, total employment spells, dummy variables for experience decile, age decile, sector, job separation dummy and a high school graduate dummy variable. Columns 2 and 4 include the marked interaction terms. Reported coefficients are from a linear probability model. Standard errors in parentheses are clustered at the individual level.
6. Discussion and the fiscal impact of the 2008 reform
To ascertain the fiscal impact of the 2008 reform, we performed a simple calculation using our main results to obtain an estimate of the monthly burden/savings of the reform. The estimates from Table 3, column 3 suggest that the reform resulted in 17,036 more men receiving partial disability benefits over the three-year period from 2009 to 2011. These were men added to the disability rolls because of the reform; thus, the payments that they received represent the cost of the reform for men’s partial disability. However, the government saved money on those who would have entered into the disability system regardless of the reform, but entered with lower benefits because of the reform. If we assume the disability rate was constant and use the baseline benefits for our four groups (partial men, total men, partial women, and total women), we found that by 2011, the government was losing approximately 6.8 million Euros on individuals who were induced into applying for (and then ultimately received) disability. However, the government was saving 18.6 million Euros by paying lower benefits to those who would have applied regardless. Therefore, our estimates suggest that in the end, the reform did succeed in reducing the amount spent on disability; however, these savings were quite small: the 11.8 million net monthly Euros saved by the Spanish government is less than two percent of the disability monthly budget.
7. Conclusion
This paper adds to the growing body of evidence showing that the design of a disability benefit system can have a significant impact on disability entry. We analyzed the 2008 disability reform in Spain and found that contrary to its intended purpose, the reform
22 increased disability application. The positive effect is because the reform incentivized application for those who expected to have low labor force participation in the future. Although the absolute value of these individuals’ benefits was decreased by the reform, their present value was greater than it would have been in the future after continued low labor force participation. Overall, we found that the reform increased partial disability application by 46 percent in men and 22 percent in women. However, despite having the opposite effect of its intent, the reform had a small impact on government expenditures.
The Spanish system and the 2008 reform demonstrate some of the unexpected effects of policy reforms. First, disability receipt is still an absorbing state in Spain, with less than 1 percent of individuals leaving disability in a given year. Even in a disability system with no work disincentive, if the benefit formula depends on both the number of years contributed and on age, then unemployed disabled workers are incentivized to apply for disability over finding new employment (assuming that they expect their future employment probabilities to be low). A final important point is that in the context of a weak job market, individuals may find disability application appealing despite lowered benefit levels. Overall, the 2008 Spanish reform highlights the difficulties of disability design; thus, governments with disability reform agendas should be wary of unintended consequences.
23 REFERENCES
Autor, D. Duggan, M. Gruber, J. 2014. Moral hazard and claims deterrence in private disability insurance. American Economic Journal: Applied Economics, 6(4): 110-141. Autor, D. 2011. The Unsustainable Rise of the Disability Rolls in the United States: Causes, Consequences and Policy Options. MIT Working Paper.
Autor, D. Duggan, M. 2010. Supporting Work: A Proposal for Modernizing the U.S. Disability Insurance System. Center for American Progress and the Hamilton Project. Autor, D. Duggan, M. 2003. The rise in the disability rolls and the decline in unemployment. Quarterly Journal of Economics; 118; 157-205.
Black, D. Kermit, D. Sanders, S. 2002. The impact of economic conditions on participation in disability programs: Evidence from the coal boom and bust. American Economic Review 27-50.
Burkhauser, RV. Daly, MC. 2011. The declining work and welfare of people with disabilities: What when wrong and a strategy for change. Washington, DC: American Enterprise Institute.
Burkhauser, RV., Butler, J.S. and Gumus, G. 2003. Option Value and Dynamic Programming Model Estimates of Social Security Disability Insurance Application Timing. IZA Discussion Paper No. 941.
Burkhauser, RV., Butler, J.S. and Gumus, G. 2004. Dynamic programming model estimates of Social Security Disability Insurance application timing. Journal of Applied Econometrics; 19: 671-685.
Butler, M. 2001. Neoclassical Lifecycle Consumption: A Textbook Example. Economic Theory, 17 (1): 209-221.
Campolieti, M. Riddell, C. 2012. Disability Policy and the labor market: Evidence from a natural experiment in Canada, 1998-2006. Journal of Public Economics; 96: 306-316. Cervini-Plá, M., J. I. Silva, and J. Vall-Castello. 2016. “Estimating the Income Loss of Disabled Individuals: The Case of Spain.” Empirical Economics; 51:809.
Chen, S. Van der Klaauw, W. 2008. The Work Disincentive Effects of the Disability Insurance Program in the 1990s. Journal of Econometrics; 142; 757-784.
De Jong, P. Lindeboom, M. Van Der Klaauw, B. 2011. Screening Disability Insurance Applications. Journal of the European Economic Association; 9; 106-129.
García Pérez, J.I. 2008. La Muestra Continua de Vidas Laborales: Una guía de uso para el análisis de transiciones. Revista de Economía Aplicada, E-1, Vol.XVI, 5-28.
Gruber, J. 2000. Disability Insurance Benefits and Labor Supply. Journal of Political Economy; 108: 1162-1183.
24 Gruber, J. Kubik, J.D. 1997. Disability Insurance Rejection Rates and the Labor Supply of Older Workers. Journal of Public Economics; 64; 1-23.
Hainmueller, Jens, 2012. Entropy Balancing for Causal Effects: A Multivariate
Reweighting Method to Produce Balanced Samples in Observational Studies. Political Analysis, Cambridge University Press, vol. 20(01), pages 25-46.
Jimenez-Martin, S. Juanmartí, A. Vall Castelló, J. 2017. Great recession and disability insurance in Spain. UPF Working Paper 1519.
Karlström, A. Palme, M. Svensson, I. 2008. The Employment Effect of Stricter Rules for Eligibility for DI: Evidence from a Natural Experiment in Sweden. Journal of Public Economics 92; 2071-2082.
Koning, P. Lindeboom, M. 2015. The rise and fall of disability insurance enrolment in The Netherlands. Journal of Economic Perspectives, 29(2), pp.151-172.
Korkeamäki, O. Kyyrä, T. 2012. Institutional rules, labour demand and retirement through disability programme participation. Journal of Population Economics 25; 439-468.
Kreider, B. 1998. Workers application to Social Insurance Programs when earnings and eligibility are uncertain. Journal of Labor Economics 16; 848-877.
MacDonald, BR. O’Neil, M. 2006. Being American: The way out of poverty: The discussion to transform Social Security, Medicare and Disability Tax Law. World Institute on Disability. Oakland, CA.
Maestas, Nicole, Kathleen J. Mullen, and Alexander Strand. "Disability Insurance and the Great Recession." American Economic Review 105.5 (2015): 177-82.
Marie O. Vall Castello J. 2012. Measuring the (Income) Effect of Disability Insurance Generosity on Labour Market Participation. Journal of Public Economics 96; 198-210.
OECD. 2009. Sickness, Disability and Work; Keeping on track in the economic downturn. Background Paper, High-Level Forum; Stockholm.
Pascual N. Rodríguez I. 2013. Effects of unemployment on self-assessed health and mental health: empirical evidence for Catalonia (2006-2012). Master project. Master in Health Economics and Policy, Barcelona Graduate School of Economics.
Ramos-Muñoz, B. 2007. Comparación de las magnitudes estadísticas del Empleo según la Encuesta de Población Activa y la Muestra Continua de Vidas Laborales”. Presented in the “Jornadas de Usuarios de la Muestra Continua de Vidas Laborales”, October 2007.
Rege, M. Telle, K. Votruba, M. 2009. The effect of plant downsizing on disability pension utilization. Journal of the European Economic Association 7, 4: 754-785.
25 Silva, J.I. Vall Castello, J. 2017. Partial disability and labour market adjustment: The case of Spain. Labour Economics, 48, 23-34.
Staubli, S. 2011. The Impact of Stricter Criteria for Disability Insurance on Labor Force Participation. Journal of Public Economics 95; 1223-1235.
Stock, J.H. Wise, D.A. 1990. Pensions, the Option Value of Work and Retirement. Econometrica, 58, 1151-1180.
Urbanos R.M. Lopez-Valcarcel BG. 2015. The influence of the economic crisis on the association between unemployment and health: an empirical analysis for Spain. The European Journal of Health Economics, 16(2), 175-184.
Vall Castello, J. 2017. What happens with the employment of disabled individuals when all financial disincentives to work are abolished?. Health Economics, 1-17.
Van Sonsbeek, JM. Gradus, R. 2013. Estimating the effects of recent disability reforms in the Netherlands. Oxford Economic Papers, 65(4): 832-855.
26 ONLINE APPENDIX 1: Extended Theoretical Model
To illustrate the model’s predictions in section 3, we simulate the reform considering different combinations of and for an individual 45 years old. 20
For an easier interpretation, we present the results in terms of and . The rest of the model’s parameters are shown in Table A1 and have been parameterized using the MCVL for the pre-reform period 2004-2007 as well as information from other studies.
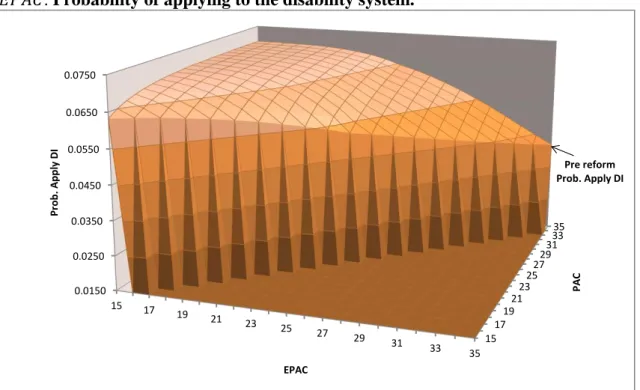
Figure A1 shows the simulated post reform probabilities. To evaluate the effectiveness of the reform, we need to compare these probabilities with the simulated pre-reform probability of 0.0420 when .21
As we can see, the post reform probabilities of applying to the disability status are always higher to the simulated one during the pre reform. More in detail, the simulations show that a 45 years old individual with a lower than 35 or with a value higher to displays higher probability of applying to the disability system after the reform is introduced. Only those individuals with a and with no expected change in their labor force attachment, will keep disability application at the same level than before the reform.
Also notice that during an economic recession many individuals should expect a low labor force attachment, increasing the probability of applying to the system. In other words, for a given , a reduction in the increases the probability of applying to the disability system. Individuals with a lower value of expect to work less for the remainder of their working life and face a rapidly decreasing PAC years and therefore PAC percentage. These are the individuals who will have the greatest incentive to apply and the simulation bears this out. An individual with a PAC of 35 years, , will experience an increase from 0.0420 to 0.0699 in the probability of applying for DI if his falls from 35 to 15 years ( falls from 1.0 to 0.5).
20We consider a 45 years old individual because he nearly represents the median age of the population in Spain. Similar patterns to the ones observed in Figure A1 are obtained when considering other ages (although with different probabilities). We would like to emphasize that the numerical scenarios presented here pretend to illustrate the main theoretical predictions from the model, and not to replicates the empirical estimations in section 5.
21
Notice that there is only one pre-reform probability that equals 0.042 because PAC years did not exist before the reform.
27 Next we consider changes in current level of PAC years. The simulation shows that the closer an individual is to the upper bound of 35 years, the higher the probability of applying for disability benefits. This represents the absolute value of the benefits, in that those with a higher PAC percentage, are more likely to apply for disability than those with a lower value. For example, a 45 years old individual with and of 15 years, shows a probability of applying to the DI of 0.0633. In turn, this probability increases to 0.0699 if the PAC increases from 15 to 35 years, .
Figure A1: Simulated effects of the reform under different scenarios of and . Probability of applying to the disability system.
Note: Since EPAC cannot be higher than PAC by definition, the probabilities of these combinations are not defined.
Table A1: Parameterization of the theoretical model for a given individual
Parameters Value Definition
0.070 Disability probability shock
Discount factor
Working disability costs
15 17 19 21 2325 2729 3133 35 0.0150 0.0250 0.0350 0.0450 0.0550 0.0650 0.0750 15 17 19 21 23 25 27 29 31 33 35 PA C Pr o b . App ly DI EPAC Pre reform Prob. Apply DI
28
1.20 Regulatory base
0.55 Percentage applied to the regulatory base 1.00 Normalized wage of the officially disabled 1.20 Wage of the non-officially disabled
σ 0.1 Standard deviation of log(z)
η 0.00 Log normalization of the mean of z
Note: In this parametrization, we normalize to the unity. Then, matches an average wage gap of 21 percent between a disabled and nondisabled individual (Cervini-Plá, Silva, and Vall-Castello, 2012). The regulatory base is set equal to . The discount factor is set to match the average observed probability of applying to disability benefits before the reform (0.042). The working disability costs assumes that the non-officially disabled individual has a degree of disability of 33 percent, which is the minimum level of disability requires to applied for disability benefits. The parameter is taken from the Spanish Disability System. Finally, the logarithm of the idiosyncratic productivity z is assumed to have normal distribution with mean η=0 and standard deviation σ=0.1
Alternative policy scenario: abolishing incentives to join the DI system
We next simulate an alternative reform that would not have the incentives to apply to the DI system for individuals with a low labor force attachment. We propose a similar policy to the one implemented in 2008 but we exclude the age component (65-Age) from the formula to calculate the actual PAC. Thus, the new formula is almost identical to the old-age benefit formula that already exists in Spain;
This is the only parameter that we change and we leave the PAC percentage unchanged. That is, we assume that the corresponding PAC percentage follows the same rule as the one introduced in 2008. Table A2 shows the simulated results for a 45 year-old individual under the presence of two different labor force attachment scenarios (following the simulations above). The first one is a high labor force attachment scenario and assumes that the individual will work every year until retirement. The second is a low labor force attachment scenario that assumes individual will only work five more years until retirement.
29 Table A2 shows the simulated results. In the first block we include the simulated probabilities of applying to the disability system after the 2008 reform while in the second block we show the simulated probabilities under the alternative policy scenario that we are proposing, which excludes the age component from the PAC formula. The most important result is that, in our alternative policy scenario, the probabilities of applying to the disability system (Prob) are, most of the time, lower than the pre reform probability. In other words, most of the simulated probabilities in the second block are lower than the estimated probability of 0.0420 with PAC=EPAC=1. In contrast, in the actual system the probabilities are higher or equal to the pre reform one (see the first block).
Notice that this result also implies that the alternative system shows lower probabilities than the actual system. For example, in the actual system (first block), a 45 year-old with 10 years of contributions has a PAC of 30 years with expected PAC of 15 (30) years in the low (high) labor attachment scenarios. In these two scenarios, the probabilities of applying to the disability system are 0.0698 and 0.0470, in each case. In contrast, in the alternative scenario proposed (second block), the actual PAC for this individual is reduced from 30 to 10 while the expected PAC will remain unchanged. In this case, the probabilities for applying to DI fall to 0.0633 and 0.000, in each case. The intuition behind this result is simple; eliminating the age component from the PAC formula reduces the actual PAC and, at the same time, ensures that the expected PAC (EPAC) will not be lower than the observed PAC, implying that E(θ)≥θ at any given age and number of years contributed. Therefore, since the individual will not take into account a reduction in the future PAC during his working life, the incentive to apply to the disability system falls.
It is important to emphasize that the alternative reform we present in this section is not necessarily more efficient than the 2008 reform. Although it is true that this alternative scenario increases the disincentive to apply for disabled workers with relatively low levels of disability but with low labor-force attachment, it can be the case that the benefits do not go to those who deserve them the most since the disincentive to apply can also be higher for people with low labor force attachment due to bad health conditions. Our goal here is not to target a more efficient reform but to show the sensitivity of the DI system with respect to a scenario that eliminates the age component from the formula to calculate the actual PAC.
30 Table A2. The effect of the proposed alternative policy scenario on the probability of applying to the disability system.
The Spanish Disability System under the real reform
Low LFAS High LFAS
Age Contrib. years PAC θ EPAC E(θ) Prob EPAC E(θ) Prob
45 10 30 0.9 15 0.5 0.0698 30 0.9 0.0470
45 15 35 1 20 0.65 0.0693 35 1 0.0420
45 20 40 1 25 0.8 0.0647 40 1 0.0420
45 25 45 1 30 0.9 0.0554 45 1 0.0420
45 30 50 1 35 1 0.0420 50 1 0.0420
Alternative hypothetical reform in the Spanish Disability System
Low LFAS High LFAS
Age Contrib. years PAC θ EPAC E(θ) Prob EPAC E(θ) Prob
45 10 10 0.5 15 0.5 0.0633 30 0.9 0.0000
45 15 15 0.5 20 0.65 0.0379 35 1 0.0000
45 20 20 0.65 25 0.8 0.0080 40 1 0.0041
45 25 25 0.8 30 0.9 0.0334 45 1 0.0201
45 30 30 0.9 35 1 0.0322 50 1 0.0322
31 ONLINE APPENDIX 2: Differential Effects of Treatment
In Table A3 we examine how the effects of the reform differed by the amount of benefits lost. Recall that after the 2008 reform, for those below the 35 year PAC threshold, the amount by which their disability benefits were reduced depends on their PAC years. For instance, those with 15 PAC years or lower received 50 percent of their previous benefit amount, while those from 16 to 34 PAC years received 53 to 98 percent depending on their PAC years (Table A4 in online appendix 3 presents the PAC years and corresponding percentages). The reform acted like a one-time shock where one’s benefit level was dropped to a new lower level. The reform incentivized application because an individual’s PAC years would continue to fall if their labor force attachment was low. Our theoretical model predicts that disability application should be higher for those closer to the 35 PAC year threshold because they stood the most to lose over time if their PAC years continued to fall. The model does not suggest the effect of one’s distance to the cut-off to be linear, therefore we allow for a flexible functional form. We divide the treated group into four sub-groups, those with 15-20 PAC years, 20-25 PAC years, 25-30 PAC years, and 30-35 PAC years (PAC years is a continuous variable). We allow each subgroup to have its own treatment effect. The specification is as follows: (9)
Where treatment(PAC) are dummy variables equal to 1 if the individual’s PAC years are within the specified range. The estimated effects of the various treatment groups are similar with the exception of treatment(PAC15-20), which has a consistently lower effect on disability entry across gender and types of disability. The estimates in Panel A and C, column (1) suggest that males whose PAC years were from 15-20 were 20.3 (31) percent more likely to receive partial (total) disability after the reform, while those with PAC years from 30-35 were 36 (47) percent more likely to receive partial (total) disability post reform. We observe similar results for women on partial (total) disability entry: there is a 9 (29) percent effect for females with 15-20 PAC years compared to a
32 36 (60) percent effect for those 30-35 PAC years. The effects for the other PAC year ranges (20-25, 25-30) are similar to those found for the 30-35 group. The results of table 6 suggest that the effect of the reform incentivized application (and therefore increased entry) for those affected but the effect was not as salient for those with 15-20 PAC years. This finding is consistent with the dynamic nature of disability impacting the decision to apply. After the reform, the benefit reduction was capped at 50 percent and those with 15 PAC years had already reached that cap and those with 16-20 PAC years are already close to the cap, hence they do not have as much benefits to lose as compared to those with more PAC years.
Table A3: Effect of reform on disability entry by PAC years Partial Disability Panel A: Men (1) (2) PAC(15-20)*post 0.0012*** 0.0008*** (.0002) (.0002) PAC(20-25)*post 0.0016*** 0.0013*** (.0002) (.0002) PAC(25-30)*post 0.0012*** 0.0009*** (.0002) (.0002) PAC(30-35)*post 0.0009*** 0.0006*** (.0002) (.0002)
Year X Job Loss X
Mean dep. Var. (PAC(15-20)) 0.0059 0.0059
Mean dep. Var. (PAC(20-25)) 0.0044 0.0044
Mean dep. Var. (PAC(25-30)) 0.0035 0.0035
Mean dep. Var. (PAC(30-35)) 0.0025 0.0025
Observations 2725971 2725777 Panel B: Women (1) (2) PAC(15-20)*post 0.0005*** 0.0003** (.0002) (.0002) PAC(21-25)*post 0.0002 0.0001 (.0002) (.0002) PAC(26-30)*post 0.0004** 0.0003 (.0002) (.0002) PAC(31-35)*post 0.0005** 0.0003 (.0002) (.0002)
Year X Job Loss X
Mean dep. Var. (PAC(15-20)) 0.0053 0.0053
Mean dep. Var. (PAC(20-25)) 0.0031 0.0031