Università degli Studi di Napoli
Federico II
DOTTORATO DI RICERCA IN
FISICA
Ciclo 30°
Coordinatore: Prof. Salvatore Capozziello Settore Scientifico Disciplinare FIS/05
Characterisation of dust events on Earth
and Mars
the ExoMars/DREAMS experiment and
the field campaign in the Sahara desert
Dottorando Tutore
Gabriele Franzese dr. Francesca Esposito Anni 2014/2018
A birbetta e giggione che sono andati troppo veloci
e a patata che invece adesso va piano piano
2
Summary
Introduction ... 6
Chapter 1 Atmospheric dust on Earth and Mars... 9
1.1 Mineral Dust ... 9
1.1.1 Impact on the Terrestrial land-atmosphere-ocean system ... 10
1.1.1.1 Direct effect ... 10
1.1.1.2 Semi-direct and indirect effects on the cloud physics ... 10
1.1.1.3 Indirect effects on the biogeochemical system ... 11
1.1.1.4 Estimation of the total effect ... 11
1.2 Mars ... 12
1.2.1 Impact on the Martian land-atmosphere system ... 13
1.3 Dust lifting phenomena ... 14
1.3.1 Dust Storms ... 14
1.3.1.1 Martian Dust storm ... 14
1.3.2 Dust Devils... 15
1.3.2.1 Dust Devils on Mars ... 18
1.4 Physics of the boundary layer ... 19
1.4.1 Atmospheric Stability ... 20
1.4.2 Neutral case ... 21
1.4.2.1 Wind Speed Profile ... 21
1.4.2.2 Temperature Profile ... 22
1.4.3 Not neutral case... 23
1.4.3.1 Stability parameters L, Ri, Rb ... 23
1.4.3.2 Wind Speed Profile ... 24
1.4.3.3 Temperature Profile ... 24
1.4.4 Dust feedback... 25
1.5 Physic of dust lifting ... 25
1.5.1 Suspension ... 25
3
1.6 Electrification ... 29
1.6.1 Electrification on Mars ... 30
Chapter 2 The ExoMars missions and the Moroccan field campaigns: detection and study of dust lifting events ... 31
2.1 The ExoMars program ... 31
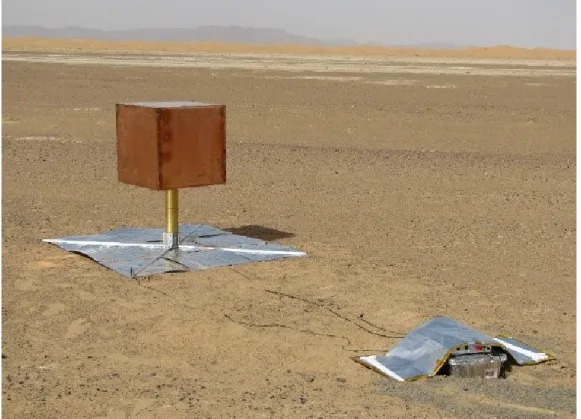
2.2 The DREAMS Experiment ... 33
2.2.1 MicroARES... 34
2.2.2 MicroMED ... 35
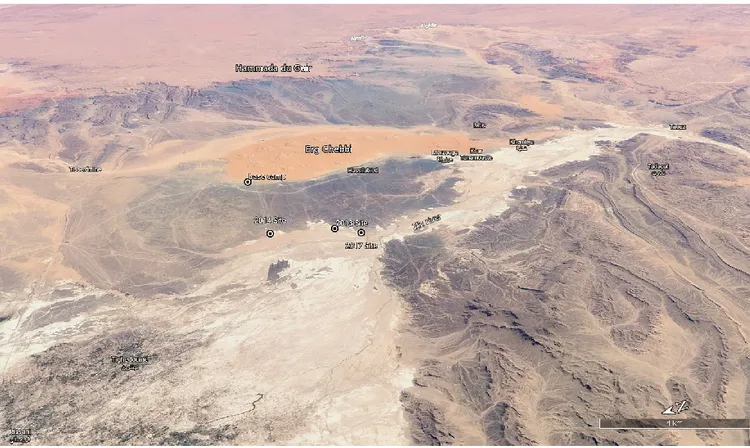
2.3 Saharan field campaigns ... 37
2.3.1 2013 field campaign ... 38
2.3.2 2014 field campaign ... 39
2.3.3 2017 field campaign ... 41
2.4 DREAMS as dust devils probe on Mars ... 42
2.5 Dust storm detection ... 44
2.6 Dust Devil detection ... 45
2.6.1 Time domain research ... 46
2.6.1.1 Pre-processing of the data ... 46
2.6.1.2 2013 detection algorithm ... 47
2.6.1.3 2014 Detection algorithm ... 49
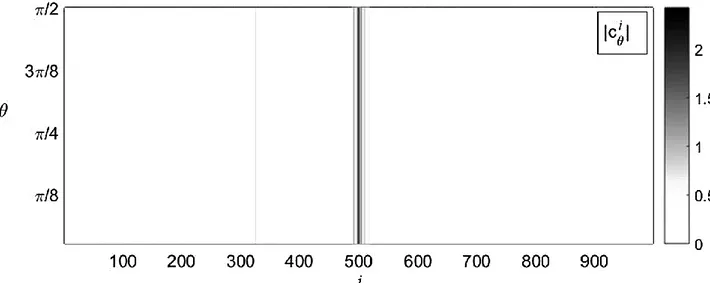
2.6.2 Tomography technique ... 50
2.6.2.1 Application to dust devils and categorization of the detections ... 52
2.6.3 Validation of Tomography technique ... 56
2.6.3.1 Comparison of the different methods ... 58
2.7 Dust Devil impact parameter ... 60
Chapter 3 Proprieties of the dust induced E-field ... 64
3.1 Dust Storms ... 64
3.1.1 Bimodality of the observed dust storm distribution ... 65
3.1.2 E-field proprieties ... 69 3.1.2.1 Relation with the dust concentration and atmospheric relative humidity
4
3.1.2.2 E-field feedback on dust emission ... 72
3.2 Dust Devils... 75
3.2.1 Daily and seasonal activity ... 76
3.2.2 Wind speed regime ... 78
3.2.3 Pressure drops distribution ... 80
3.2.4 E-field proprieties ... 81
3.2.4.1 Distribution and Orientation ... 81
3.2.4.2 Signal trend and connections to the other vortex parameters ... 83
3.2.4.2.1 E-field vs vortex pressure drop and wind speed ... 86
3.2.4.2.2 E-field vs vertical flow speed ... 87
3.2.4.2.3 E-field vs lifted dust ... 88
3.2.4.3 Sources of uncertain ... 89
3.2.5 Parallel to the martian case ... 90
Chapter 4 Evaluation of the intrinsic vortex parameters ... 94
4.1 2017 field campaign ... 94
4.2 Impact parameter evaluation model ... 97
4.2.1 Concordant Rotation ... 100 4.2.1.1 Not-direct passage ... 100 4.2.1.2 Direct passage ... 102 4.2.2 Discordant Rotation ... 104 4.2.2.1 Not-direct passage ... 104 4.2.2.2 Direct passage ... 105
4.2.3 Reconstruction of the vortex intrinsic parameters ... 107
4.2.4 Application of the model ... 107
4.3 Camera images distances evaluation ... 108
4.3.1 Evaluation of the starting values ... 111
4.3.2 Fitting procedure ... 112
4.4 Comparison of the techniques ... 116
Conclusion and Future Works ... 121
6
Introduction
Suspended dust can significantly affect the thermal profile of the atmosphere, absorbing and reflecting the solar radiation, influencing also the cloud formation and life-cycle. Once entrained at altitude, smallest grains can be transported all over the planet, mixing the soil composition and affecting the amount of mineral and nutrients of the different ecosystems. The average global effect on the terrestrial climate is still not well established. However, except peculiar and rare conditions, it is estimated as not predominant. Indeed, the presence on Earth of oceans, vegetation and other complex factors limits the abundance of dust sources and mitigates the aerosol total contribution.
The martian environment presents instead a different situation. Despite being much thinner than the terrestrial one, martian atmosphere can still sustain aeolian processes: they are common and diffuse all over the planet and able to set in motion sand and dust grains, as evidenced by the diffuse present of dunes. The presence of fewer competing factors, the arid environment and the widespread distribution of dust sources make the dust contribution one of the crucial factors that drive the planet climate. Indeed, martian dust storms can last several months, even covering the whole planet surface absorbing up to 80% of the incoming solar radiation.
Another important phenomenon associated with the dust clouds is the mutual contact electrification of the grains, that can generate electric fields up to several kV/m. On Mars, the triboelectricity associated with dust impacts is expected to be the main charging mechanism of the atmosphere and could lead to potential greater than the breakdown voltage, with the consequent formation of electrostatic discharges. These phenomena can potentially affect the atmospheric composition and the habitability of the planet.
Therefore, in the frame of the Martian exploration, the study of the dust lifting phenomena covers a key role and represents one of the goals of the present and future missions. The ExoMars 2016-2020 programme aims to search for signs of past or present life on Mars, and investigates the Martian atmosphere and the long-term climate changes. The first mission has been launched in 2016. It included the Schiapparelli lander, developed to demonstrate the technology for entry, descend and landing on the Martian surface, and the Trace Gases Orbiter, actually in orbit around the planet with the aim to map the sources of atmospheric trace gases.
The second mission will be launched in 2020 and it will include a surface platform and a rover. The aims of the mission are the search for life signs, the investigation of the boundary and subsurface layer to characterize the water and geochemical distribution, the climate evolution and the habitability of the planet.
In this optic, the missions also involve the deployment on the martian surface of instruments able to study the meteorological, electric and dust activity parameters of the planetary boundary layer.
The team I joined during my PhD work at the INAF astronomical observatory of Capodimonte is directly involved in the ExoMars programme, being in charge of the DREAMS meteorological station on board of the Schiapparelli lander of the ExoMars 2016
7 mission, and of the MicroMED optical particle counter on board of the surface platform of ExoMars 2020.
In the frame of the instruments developing and the acquisition of martian analogous data on Earth, our team has carried out various campaigns in the Sahara desert, during the peak activity season for the dust processes, to study the environment and the lifting phenomena that are expected on Mars.
The data acquired in the Sahara represent up to now the most comprehensive data set available for the dust phenomena, being also the only one that crosses synchronous acquisition of meteorological, electric, sand and dust activity parameters.
Currently, there are still many open questions regarding the dust processes physics, largely due to the lack of proper field surveys. Indeed, both on Earth and Mars, we still lack a proper estimation of the injection rate, global amount and physical proprieties of atmospheric dust. The wind speed threshold during dust storms and devils for the
entrainment of sand and dust grains are still matter of controversy, due to the not precise knowledge of the magnitude of the different forces involved. In particular, the role of the electric forces is very unclear and, in general, the proprieties and the development of the electric field related to the dust cloud composition and environmental meteorological parameters heavily need further investigation to be understood.
Therefore, in order to answer at least partly to the aforementioned questions, my PhD research topics have been:
- the development of proper detection algorithms able to individuate the dust events acquired in the data,structuring the techniques in such a way that they can be used be used also for the analysis of the data collected by the ExoMars missions; - the physical characterization of the dust storm and dust devils activity observed
during the Saharan campaigns, studying in particular the electric proprieties of the events and the relations between the electric field, the amount of sand and dust lifted and the environmental conditions;
- the comparison of our terrestrial results with the martian data available in
literature and the study of what we can expect and what we have to look for in the future ExoMars data, that may fill many of current lacks.
The work is structured as follows:
- In Chapter 1 I will discuss the role of airborne dust on the planet climate, both on Earth and on Mars, describing also what are the main lifting processes, such as dust storms and devils. In addition, I will briefly introduce the boundary layer physics, the basic laws of the surface-atmosphere interaction that lead to the grains lifting and the involved electrification process.
- In Chapter 2 I will present the ExoMars programme and the related field
campaigns we performed in the Sahara. In addition, I will describe the detection algorithms we developed to individuate the active lifting processes acquired in the surveys.
- In Chapter 3 I will discuss the analysis of the dust lifting activity monitored during the terrestrial campaigns, focusing on the description of the observed electric proprieties.
8 - In Chapter 4, I will present the analysis of the Saharan campaign I personally
planned and led in 2017, specifically aimed to the study of the dust devil processes.
9
Chapter 1
Atmospheric dust on Earth and Mars
In this chapter we explain what is the dust and its role on the planetary atmosphere and climate. We introduce the main dust lifting phenomena and the physic at the base of the lifting process. In addition, we discuss about the triboelectrification process associated with windblown grains and the resulting induced E-field.1.1 Mineral Dust
The mineral dust is the component of the atmospheric aerosol originated by the suspension of mineral grains (<̃ 60 m in diameter) from the soil. The principal mechanism for the mobilization of the soil grains is the wind erosion, however, there are cases where other natural mechanisms like the thermophoresis or the electric forces can give a relevant contribution.
The dust is mainly originated in arid and semi-arid region like deserts and dry lake beds. On Earth, all the main dust sources are located in the north hemisphere, while the contribution of the south hemisphere is estimated under 10% of the global dust emission (Choobari et al., 2014). The Sahara Desert represents the first contributor to the global dust budget giving around 55% of the total (Rajot et al., 2008), and the highest concentration of the emissions comes from the Lake Chad Basin. Other important sources are spread in Middle East and Asia, like the Lut Desert, the Karakum Desert, the Taklimakan Desert and the Gobi Desert.
Dust is also produced during the grinding and abrasion by ice over bedrock in river beds and glaciers and hence it is abundant in cold climate regions and at high latitudes where it is emitted by strong glacier-driven or katabatic winds (Dagsson-Waldhauserova et al., 2013).
The abundance of the emissions depends on the season and it is related to the dust storms activity; some regions like the Africa and the Middle East are more active in the summer period (Goudie and Middleton, 2006), while the activity in the Chinese region peaks in spring (Shao and Dong, 2006; Sun et al., 2001). The dust originated from different sources can present substantial different composition and, even considering a single source, the composition could be not homogeneous variating with the size of the grains. The characteristics and concentration of dust in an area are not just related to the local sources. Indeed, once lifted the grains can remain in suspension for weeks, travelling for thousands of kilometers, driven by the global circulation.
Alongside the seasonality due to the atmospheric dust lifting phenomena, the dust concentration can be affected by sporadic phenomena, like the volcanic eruptions, that can tremendously increase the amount of dust in the atmosphere. In addition to the natural sources, a percentage between the 10 and 30% of the emission has anthropic origin (Tegen and Fung, 1995; Sokolik and Toon, 1996). The human contribution to the deforestation and
10 the desertification of many area of the planet favors the increase of the dust emission. Moreover, dust grains are directly lifted by activities like the mining, agriculture and overgrazing (Moulin and Chiapello, 2006), e.g. in Australia the anthropogenic dust emission counts for about 75% of the total (Bryant, 2013).
1.1.1 Impact on the Terrestrial land-atmosphere-ocean system
The effects of the dust on the atmospheric balance are complex and heavily depend on the concentration, size and composition of the grains. Usually, the are divided into direct, semi-direct and insemi-direct effects. The semi-direct effects are related to the dust impact on the atmospheric radiative budget, while the semi-direct and indirect effects are both related to the interaction of the dust with the clouds. In particular, the semi-direct effects describe the role of the dust absorption of radiation on the cloud’s lifecycle, while the indirect effects are connected to the role of the dust as ice nuclei and cloud condensation nuclei. In this way the dust is able to influence the weather and the hydrological cycle. In addition, it affects the biogeochemical cycle, working as a trans-continental vector of nutrients for land and ocean habitats.
Lastly, the atmospheric dust affects the quality of the air affecting the human care. Grains under 10 µm of size are easily inhalable. Coming in contact with wet airspace surfaces they can deposit inside the respiratory system, melting and releasing toxic constituents for the organism and serving also as a vector of biological components such as bacteria, endotoxins, and fungi.
1.1.1.1 Direct effect
The dust grains have a diameter of the order of tens of microns or less because the larger grains are too heavy to enter in suspension for a long period. The range of diameters makes the atmospheric dust able to interact with both the short and the long wave radiation. Hence, the dust plays the dual action of reflecting in space part of the solar radiation (short wave radiation) and trapping part of the radiation emitted by the surface (long wave radiation), heavily affecting the thermal gradient of the atmosphere and consequently the climate. In presence of a suspended dust layer the surface will be cooled during the day-time and warmed during the night-time (Hansell et al. 2010), resulting in an overall cooling, due to the preponderance of the interaction with the shortwave radiation (Yoshioka et al. 2007). Thus, the atmospheric dust plays on average a role opposite of the greenhouse gases, giving a cooling contribute that counterattacks the gases warming effect.
1.1.1.2 Semi-direct and indirect effects on the cloud physics
After the suspension, part of the dust is embedded within clouds. Here, it can lead to the “cloud burning effect”, enhancing the evaporation through the absorption of the solar radiation (Hansen et al. 1997; Ackerman et al. 2000). In addition, the influence of the grains
11 on the atmospheric temperature profile affects the vertical and horizontal development of the cloud coverage (Koch and Del Genio, 2010).
Due to their size, the dust grains work as ice cloud nuclei (Sassen et al., 2003), and, when they are coated with soluble materials or absorb water, they can growth until to act as efficient cloud condensation nuclei (Levin et al., 2005). In this way, the dust affects the amount of droplet inside the cloud, modifying their optical proprieties and the precipitation rate. These interactions are complex, and, depending on the circumstances, the net effect can be both a suppression or an enhancement of the rain precipitation. For this reason, the atmospheric dust can heavily affect the hydrological cycle.
1.1.1.3 Indirect effects on the biogeochemical system
Alongside these contributions, the dust re-deposition plays an indirect effect on biogeochemical system (Mahowald, 2011). Suspended dust is removed from the atmosphere by gravitational sedimentation and wet precipitation. Dry deposition dominates over the lands, while the wet deposition is preponderant on the oceans (Zender et al., 2003). The dust is vector for long range transport of crucial nutrients for the ecosystems, in particular nitrogen, phosphorus, and iron. For example, we know that the tropical forests are phosphorus-limited (Vitousek, 1984; Swap et al. 1992), while many ocean biota, such as phytoplankton, are iron limited (Martin et al., 1990). The atmospheric CO2 is one of the stronger greenhouse gases and could inhibits the growth of the Ozone layer. The concentration of this gas is regulated by the plant respiration and by the “biological pump” mechanism of the oceanic phytoplankton. The dust cycle modulates on a long time scale (hundreds and thousands of years) the productivity of these ecosystems, thus strongly affecting the absorption of the atmospheric CO2 (Okin et al., 2011). This effect is so pronounced that the variation in the suspended dust concentration has been proposed as one of the main factor that drives the interglacial-glacial variation of the CO2 concentration and thus the climate change (Martin, 1990).
1.1.1.4 Estimation of the total effect
It has been estimated that both the dust indirect effect on the cloud development and on the biogeochemical cycles give a neat contribution on the global radiative forcing comparable to the direct effect (Mahowald, 2011; Foster et al., 2007). However, the impact of the dust on the global climate is far from well established, primarily due to the uncertainty that affects the evaluation of the global dust burden value, the not total comprehension of the chemical and physical properties of the lifted grains, as well the lack of knowledge of the temporal and spatial variability of the concentration.
The intergovernmental panel on climate change (IPCC) provides at regular intervals Assessment Reports of the state of knowledge on climate change. The latest Fifth Assessment Report, given in November 2014, highlighted how aerosols contribute the largest uncertainty to the total climate forcing estimate for the Earth (IPCC, 2014). The in situ observations provide direct information on dust composition, size distribution,
12 chemical and physical proprieties; however, they are too sparse for adequate global coverage and we have to use satellite observations to monitor the emissions on a global scale. The planetary dust cycle is currently simulated using different models, but, depending on the assumptions and starting input parameters, the aerosol emission estimate ranges over more than a factor 2.
To improve these results, the acquisition of further field data, as the ones presented in this work, plays a crucial role. In addition, we have to take into account the dust lifting processes are not limited to the terrestrial environment, they are present also on other planet equipped with an atmosphere able to sustain aeolian process. Therefore, the understood of dust lifting physics on Earth is important also for the implications on the planetary exploration. In particular, in this work we will focus on the Martian case, in the frame of the ExoMars 2016-2020 programme that aims to investigate the possible presence of past or present life on Mars. One of the requirements necessary to achieve this objective is the study of the climatic conditions of the planet that, as we will see in the next section, are strongly influences by the dust processes.
1.2 Mars
Mars is the fourth planet of the solar system. Its radius (∼3.396 km) is about one half of the terrestrial one, while its gravity (∼3.71 m/s2) is around one third. The solar longitude (Ls) is the parameter used to indicate the Martian season: it is the angle that the planet describes in its motion along the ecliptic. It ranges from 0° to 360°, where 0° correspond to the start of the year, while 360° is the end. The Martian year lasts 687 terrestrial days, while the rotational speed is similar to that of the Earth with a Martian day that lasts 24h and 39’. During its evolution the planet has lost most of its atmosphere and currently it maintains only a tiny one with a superficial pressure of ∼6 mbar, around 6‰ of the terrestrial one. Despite this, the atmosphere is still able to sustain aeolian processes. The environmental conditions of the two Martian hemispheres are strongly asymmetric. The Martian rotational axis is tilted of 25.2° and its orbit has a large eccentricity; moreover, the southern hemisphere is on average around 5 km higher than the northern one. For these reasons, the southern hemisphere summer is shorter than the northern one, but it is warmer, due to the stronger insolation, and it is characterized by a stronger Hadley circulation favored by the topography (Joshi et al, 1995). During the so called “dust storm season” (from Ls∼180° to Ls∼330°), these factors lead to the generation of strong boundary winds and consequently the planet exhibits the strongest dust lifting activity.
The Martian regolith forms a loosely packed, porous medium, which is the source of the ubiquitous airborne dust and allows the exchange of volatiles with the atmosphere.
The space missions for Mars exploration have been ongoing since the early 1960s, and nowadays we count more than twenty successful missions. Currently, there are six orbiters around the planet (Mars Reconnaissance Orbiter, Mars Express, Mars Odyssey, Mars Atmosphere and Volatile Evolution, Mars Orbiter Mission and ExoMars Trace Gas Orbiter) and two active rovers on the surface (Mars Exploration Rover Opportunity and Mars Science Laboratory Curiosity).
13 The presence of dust in the atmosphere and the high frequency of dust lifting events on the surface have been known since early Martian missions. Indeed, it has been observed how the near surface atmosphere is characterized by an ever-present dust haze. Despite this, the mobilization of the sand size grains has not been observed until recent years. Indeed, until 2008 it was still considered that Martian aeolian bedforms were relict features formed in the past when atmospheric densities or wind speeds were higher (Merrison et al., 2007). On Mars, it is supposed that, like on Earth, the dust lifting is initially triggered by the set in motion of the sand grains (see saltation process in par. 1.5.2). Therefore, the abundance of dust mobilization coupled with the lack of bedform migration has represented a paradox for several years (Sullivan et al., 2008). The acquisition of high-resolution images from both land and orbits has resolved this paradox, showing that the mobilization of sand actually takes place on the planet (Bourke et al., 2008; Bridges et al., 2007; M. Chojnacki et al. ,2010; Sullivan et al., 2008). Silvestro et al. 2010 has given the first evidence of widespread ripple and dunes migration on the planet, proving that the Martian surface is currently active, with frequent sand transport events.
1.2.1 Impact on the Martian land-atmosphere system
Overall, the dust cycle is a critical factor that drive the weather and climate of the planet. As we described for the Terrestrial case, Martian airborne dust affects the absorption and reflection of the solar radiation inside the atmosphere. Due to the enhanced presence of dust, this effect is stronger than on Earth. In addition, also on Mars dust grains serve as
condensation nuclei for the clouds of water, CO2 and ice present on the planet. Moreover, due to the of lack of vegetation and any other kind of coverage of the surface,
the optical properties of the soil heavily affect the energetic balance between the amount of radiation absorbed and reflected by the planet. The measure of the reflectance of a surface is called albedo. The continuous transport and redeposition of dust clouds around the planet and the tracks left by dust devils passage can substantially change the local albedo of the Martian region. These variations affect the thermal structure and circulation of the boundary layer, causing a direct feedback on the momentum exchanged between soil and atmosphere and hence on the lifting processes.
In absence of precipitation and fluvial systems on the present Mars, the aeolian processes represent the principal erosion phenomena of the landscape, causing the migration of the ripple and dune systems and the creation of wind streaks on the surface.
We will discuss more deeply the dust lifting events active on the Martian surface in the next section.
Another important aspect to take into account is related to the induction of strong electric fields near the ground due to the presence of suspended dust; we will discuss more deeply this topic in par. 1.6.
14
1.3 Dust lifting phenomena
1.3.1 Dust Storms
On Earth, dust storms are local phenomena arising by strong unidirectional winds and extended gust fronts able to lift sand and dust particles from the surface, reducing the visibility under 1000m (Goudie 1978). They are common in arid and semi-arid environment and can growth up to scale of thousands of km, becoming visible from the Terrestrial orbit. Inside the larger events, the wind speed can exceed 30 km/h, while the visibility can decrease up to few tens of m.
On Earth, aside from the case of sporadic episodes like volcano eruptions, dust storms give the main contribution to the injection of dust into the atmosphere. The lifted dust can travel for thousands of km, evidence of this is the frequency with which the Europe is covered by the dust originated in the North Africa dust storms. In very rare cases, the same storm can extend over an area with a scale length of some thousands of km, e.g the great North American dust storm of 1933 that covered the region between Montana, Ohio, Missouri and the Lake Superior. However, on average, the Terrestrial storms are much smaller than their Martian counterpart.
1.3.1.1 Martian Dust storm
Martian dust storms have been observed from Earth since the nineteenth century: Antoniadi firstly reported large yellow clouds obscuring part of all of the surface.
With the beginning of the Martian space exploration the Mariner 9 probe in 1971 was the first spacecraft to orbit around the planet, encountering the largest global storm observed so far. Successively, the Viking missions have observed the global dust storm of 1977 both from land and orbit.
The rate of dust injection into the atmosphere is comparable on Mars and on Earth (∼ 3 ∙ 1015𝑔/𝑦𝑟, Greeley and Iversen, 1987) and local dust storms occur frequently and are probably dynamically similar to dust storms on Earth.
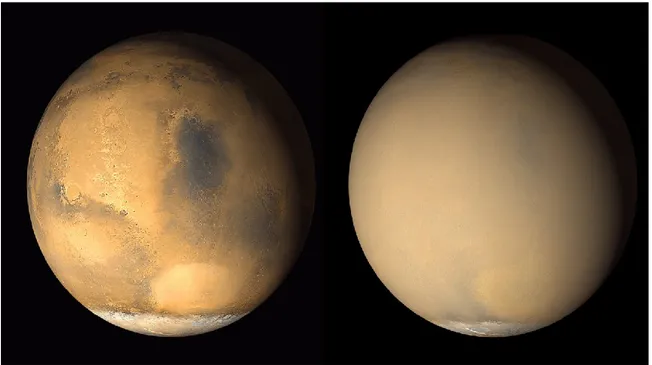
In period of high activity, there may be several tens of storms contemporaneously active on the planet. Typically, the activity peaks in late spring and early summer, when Mars is near perihelion. However, in some years, the storms do not develop at all. They can last from few weeks to few months, even various months in case of global dust storms. Usually, the major storms become visible as local bright clouds core, yellow or red, of few hundreds of km. After few days the core starts an expansion phase with the formation of secondary cores that join the main cloud. Under particular circumstances, that are still not completely clear, on average every three martian years, this expansion can lead to the formation of a planet encircling storm (see Fig. 1). There is no evidence that dust is raised simultaneously on a global scale, more likely different strong storms originated in particular geographical localities lift enough dust to cover the whole planet. About one-half of the dust clouds appeared near the edge of the southern polar caps, and the other half occurred mainly in the southern hemisphere, for the different elevation and topography, as we explained in par 1.2.
15 The greater intensity of the Martian dust storm compared to the Terrestrial ones is related not only to the major abundance of dust sources but also to the stronger orographic effects that drive the wind circulation. Indeed, the Martian surface has a height gradient that overcomes 30 km and many storms originate from slope winds generated off the flanks of the volcanoes in the Tharsis region (up to 22 km of height) (Lee et al., 1982).
Guzewich et al. 2015 have analyzed the dust storms active in dust lifting recognizable from the orbital images of the Mars Global Survey and the Mars Orbiter Camera, for Martian years (MY) from 24 to 28. They observed how the dust storm activity peaks in the equinox periods but is nearly absent near each solstice. Comparing theirs results with the ones obtained for the global dust opacity during MY24-27 (Montalbone et al 2014), Guzewich et al. 2015 concluded that the dust storm activity is strictly related to the global dust opacity, being responsible of around 50% of the total lofted dust. Smaller scale dust lifting phenomena, in particular dust devils, have to be taken into account and have to play a role on the optical depth comparable to the dust storms one. These kind of phenomena become predominant in the solstice and aphelion periods, due to the decrease of dust storm activity.
Fig. 1 Two images of Mars, taken by the Mars Orbiter Camera on NASA's Mars Global Surveyor orbiter, before and
after the great dust storm of 2001. The first image is taken at the start of June, while the second one is relative to the end of July. Credit to: NASA/JPL-Caltech/Malin Space Sciences Systems https://mars.nasa.gov/resources/21448/
1.3.2 Dust Devils
Dust devils are convective vortices, stable vertical columns of air in rotary motion, strong enough to entrain material from the surface.
Their formation is favored in conditions of strong insolation, low humidity environment, lack of vegetation and buildings or other high obstacles and gently sloping topography (Balme and Greeley, 2006). For these reasons, they are often observed in terrestrial deserts
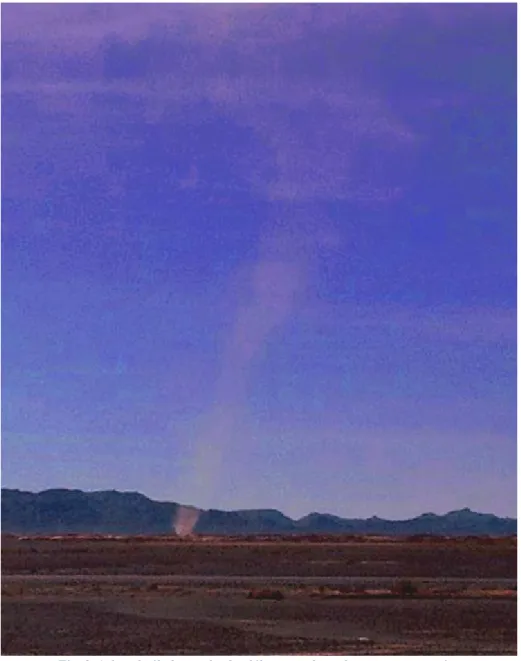
16 and are also very common on the surface of Mars. Fig. 2 shows a dust devil photographed during one of the field campaigns. The diameter of the dust column can remain roughly constant or increase with the height, the column can be perpendicular to the surface or slightly tilted in the direction of motion.
Fig. 2 A dust devil observed a few kilometers from the measurement site.
At the center of the column there is a low pressure core, related to the vertical convection, that induces a horizontal rotary motion of the air flow. The rotational speed vr in function of the distance d from the center of the vortex, can be reasonably described using the Rankine vortex model (Giaiotti and Stel 2006):
17 𝑣𝑟(𝑑) = { 𝑉𝑟𝑅 𝑑 𝑖𝑓 𝑑 > 𝑅 𝑉𝑟𝑑 𝑅 𝑖𝑓 𝑑 < 𝑅 (1a) (1b) where d is the distance from the vortex center and R is its radius, i.e. 𝑑 = 𝑅 is the vortex region with maximum rotational speed, called vortex wall. The speed linearly increases with the distance d from the center of the vortex up to its wall, where it reaches its maximum Vr, then decreases as the reciprocal of d.
The pressure has its minimum value in the center of the vortex and its trend in time can be described by a Lorentzian curve (Ellehoj et al. 2010):
𝑃(𝑡) = −𝛥𝑃𝑜
1 + (𝑡 − 𝑡½𝛤 )𝑜 2
+ 𝐵 (2)
where B is the background pressure value, ΔPo is the magnitude of the pressure drop at the
center of the vortex relative to B, to is instant relative to the minimal pressure and Γ is the
full width at half maximum (FWHM) of the signal. The first term of on the right side of eq.(2) is the pressure drop ΔP(t) and it represents the theoretical signal that a vortex leaves in the pressure time series.
Dust devils with a single pressure core are the most common, however in some cases the vortex can present more than one core. The magnitude of ΔP is usually of the order of one thousandth of the atmospheric pressure (∼1 mbar on Earth).
At vortex wall, the rotational speed is approximately in cyclostrophic balance with the magnitude of the pressure drop, namely, the force due to the pressure gradient is equal to the centrifugal force:
𝑉𝑟2
𝑅 =
𝛥𝑃𝑜 𝜌
(3) The rotational motion of the vortex overlaps the motion of the wind background. When the total wind speed reaches a sufficient magnitude, the whirlwind starts to lift sand and dust from the surface becoming a true dust devil. These vortices are one of the most efficient aeolian lifting mechanisms, thanks to the combined effect of horizontal and vertical wind, saltation and pressure-gradient force (Klose et al., 2016). The relative importance of the different mechanisms is still unclear, but, their sum makes the dust devil more effective in dust size grains lifting than the shear stress related to unidirectional wind (Greeley et al., 2003). Inside the wall of the column the lifted grains follow an upward helical pattern, forming a debris-laden annulus, while the central region of the vortex is relatively dust free. The vertical wind speed rapidly decreases outside the vertical column, and the dust devil is surrounded by a region characterized by a downward directed motion, where the lifted grains relapse toward the surface. In some cases, the passage of the dust devil can leave a visible track on the surface due to the removal of the first soil layer and the consequent albedo change.
On Earth, the whirlwinds affect the atmospheric dust concentration on local scale, but, they seem to be responsible of only some percent of the global dust budget (Jemmett-Smith et al. 2015).
18 Sinclair in 1966 has been the first to systematically study a large dust devil dataset in the Sonora Desert (Arizona). He observed that the best environmental wind speed to favor vortex formation is around 5 m/s and that the activity peaks around noon, when ground is at its warmest. Indeed, one of the main mechanism to generate the vorticity that lead to the whirlwind is the vertical air motion induced by surface region warmer than the neighbors. The horizontal gradient of surface temperature leads to a pressure gradient that induces the air convection and rotation.
1.3.2.1 Dust Devils on Mars
The presence of dust devils on Mars has been confirmed by several Mars Mission, using both landed and orbital instruments.
Ryan, 1964 has been the first to suggest the possible existence of dust devils on Mars. The possibility to find convective vortices on the surface was strongly suggested by the desertic conditions of the planet (Neubauer, 1966; Gierasch and Goody, 1973). The first evidences of their presence was given by the NASA Viking missions: Ryan and Lucich, 1983 and Ringrose et al., 2003 have identified many convective vortices in the Viking landers wind and temperature measurements. The complete characterization of the pressure signatures of these events was not possible yet, due to the infrequent sampling and the poor digital resolution of the data. The confirmation that the vortices could be actually dusty was later given by the analysis of the Viking Orbiters images, where a hundred of near-surface dust columns were identified (Thomas and Gierasch, 1985). During the Pathfinder mission, tens of dust devils have been identified both in the images of the lander (IMP camera) and in the data of the surface meteorology package (MET), allowing the first Martian study of the vortices pressure and temperature profiles (Schofield et al., 1997; Murphy et Nelly., 2002; Metzger et al.,1999; Smith and Lemmon, 1999; Ferri et al.,2003).
Afterwards, the NASA Mars Global Survey and the ESA Mars Express mission have allowed the observation from the orbiter of dozen dust columns and dust devils tracks through the high-resolution Mars Orbital Camera (Edgett and Malin, 2000; Malin and Edgett, 2001) and the High Resolution Stereo Camera (Greeley et al., 2005; Stanzel et al., 2008).
The NASA Mars Exploration Rover mission landed in 2004, has monitored three seasons of dust devil activity in Gusev crater using the Spirit rover (Greeley et al., 2006). Spirit was equipped with a composite cameras system without meteorological instruments and it collected images of hundreds of events. The NASA Phoenix Mars Lander, landed in 2008, collected meteorological data almost continuously for 151 Martian sols, measuring 502 pressure drops compatible with dust devil passages (Ellehoj et al., 2010). The NASA Martian Science Laboratory (MSL) Curiosity rover, landed in 2012, is still active on the surface, monitoring the boundary layer atmosphere through the Rover Environment Monitoring Station (REMS). So far it has collected 245 convective vortices signatures (Steakley and Murphy 2016).
The nearly global Mars coverage of the orbiter images show how dust devils are common and widespread on the surface of the planet. Dust columns have been identified in both
19 hemispheres in every season, and dust devil tracks have been observed almost at every latitudes and elevation (Malin and Edgett, 2001; Greeley et al., 2004; Stanzel et al., 2008). The diameter of the observed Martian dust devils ranges from the meter to the kilometer, while the height goes from the hundreds of meters to various kilometers. The pressure drop is of the order of ten µbar, the rotatory speed ranges from few m/s to over the 50 m/s, while the translational speed usually goes from few m/s to about 15 m/s, with rare peaks up to 50 m/s. The temperature variation is of the order of the kelvin degree.
Pathfinder, Phoenix and Curiosity are the only missions that have collected usable pressure time series of the events. Despite the three mission have landed in very different sites, subtropical for Pathfinder, norther polar for Phoenix and equatorial for Curiosity, they observed very similar dust devil characteristics. In all the cases the cumulative distribution of the pressure drops is describable with a power law with exponent around 2-3, in the same range of variation. Both the Martian surface pressure P and the pressure drop of the events are around one thousand times smaller than the ones on Earth. Hence, the ratio ΔP/P is quite similar on the two planets. However, the Martian dust devils can be an order of magnitude larger in diameter and height than the terrestrial ones (Fenton et al., 2016). Overall, the meteorological characteristics of the Martian dust devils are really close to the terrestrial ones suggesting that the events could have a common formation mechanism and dynamics (Ringrose et al., 2003).
Usually the whirlwinds are observed between 8:00 and 17:00 (Local True Solar Time LTST) and most of the daily occurrence is concentrated around noon: between 11:00 and 13:00 for Pathfinder and Curiosity, and between 11:00 and 15:00 for Phoenix. The seasonal occurrence usually peaks in the summer season.
As already mentioned, the role and importance of dust devils in the Martian climate is a highly studied and debated subject, however they seem to count for around 50% of the global dust budget (Guzewich et al., 2015). They represent a continuous source of lifted dust, active even outside the dust storms season. For these reasons they have been proposed as the main mechanisms able to sustain the ever present dust haze of the Martian atmosphere (Neubauer, 1966; Thomas and Gierasch, 1985; Klose et al., 2016; Murphy et Nelly., 2002; Ferri et al.,2003; Fisher et al.,2005; Stanzel et al., 2008).
The study of dusty vortices is one of the key scientific points to be pursued by the next Mars space missions: the NASA InSight 2018 and the ESA/ROSCOSMOS ExoMars 2020.
1.4 Physics of the boundary layer
The planetary boundary layer (PBL) is the region of the atmosphere closest to the surface, where the principal factors that influence the air flow are the friction with the surface and the vertical temperature gradient (Kaimal and Finnigan 1994). The height of the PBL on Earth is usually under the km and above this layer the air flow is in near-geostrophic balance. Indeed, increasing the height, the effects of the surface become less and less relevant.
20 - a surface layer of about 50/100 m where the quantity of momentum τ, heat H and moisture E exchanged between the soil and the atmosphere are independent from the height;
- and a region above up to a Km, where τ, H and E can slightly depend on the altitude and the Earth rotation.
Our main interest will be focused on the surface layer, where the dust lifting happens.
1.4.1 Atmospheric Stability
The atmospheric pressure P decreases with the altitude z due to the lesser weight of the overlying air column. When the pressure gradient is affected only by the gravity force we say that the atmosphere is in hydrostatic equilibrium and we have that:
𝑑𝑃 = −𝑔𝜌𝑑z (4)
where g is the gravity acceleration and ρ is the air density.
Hence, even in adiabatic conditions, the temperature T of the air layers is not constant with the altitude z, but it changes according to the pressure variation. We can define the potential temperature θ as the temperature that the air layer would have if it was at the reference pressure Po:
𝜃(𝑧) = T(z) ( 𝑃𝑜 𝑃(𝑧))
𝑅
𝑐𝑝 (5)
where R is the gas constant, and cp is the specific heat at constant pressure. Usually, the
reference Po is chosen equal to the pressure at surface level.
Using the eq.(4) and the ideal gas law, we can connect the potential temperature gradient to the temperature gradient by the equation:
𝜕𝜃(𝑧) 𝜕𝑧 = 𝜕𝑇(𝑧) 𝜕𝑧 + 𝑔 𝑐𝑝 (6) That is more useful to rewrite in the form:
1 𝜃 𝜕𝜃 𝜕𝑧 = 1 𝑇(Г𝑑− Г) (7) where Г𝑑 = 𝑔
𝑐𝑝 is the dry adiabatic lapse rate and Г = 𝜕𝑇(𝑧)
𝜕𝑧 is the environmental lapse rate. There are three different conditions of atmospheric stability:
stable, when 𝜕𝜃(𝑧)
𝜕𝑧 > 0 and Г > Г𝑑. Any kind of vertical mixing of the atmosphere is inhibited by the buoyancy forces.
neutral, when 𝜕𝜃(𝑧)
𝜕𝑧 = 0 and Г𝑑 = Г. An air layer does not suffer any buoyancy forces ascending or descending.
unstable, when 𝜕𝜃(𝑧)
𝜕𝑧 < 0 and Г < Г𝑑. The vertical motion of the air layers is favoured by the buoyancy forces.
The unstable condition is usually observed during the day-time, when the surface is heated by the solar radiation, raising the potential temperature of the lowest air layers. During the night-time, the situation is inverted because the superficial soil layer cools faster than the
21 atmosphere, lowering the temperature of the near ground air. The neutral condition is observed at the sunset and sunrise, when there is the transition between the stability and instability of the atmosphere. The amount of momentum exchanged between the surface and the air flow is affected by the atmospheric stability.
1.4.2 Neutral case
1.4.2.1 Wind Speed Profile
We start splitting the wind speed v in two components, the main component (denoted by an overbar) and the fluctuating component (denoted by the prime):
𝑣 = 𝑣̅ + 𝑣′ (8)
We can define the same subdivision for each atmospheric parameter, like pressure, temperature and humidity.
The main component is related to the large scale motion of the flow, while the fluctuations are linked to the behavior of the atmospheric turbulence. Hence, we have to mediate on a time interval much longer than the turbulence time scale, so that 𝑣̅ = 0. More generally, ′ the mean has to be evaluated over a time interval where the Reynolds averaging conditions are verified (Kaimal and Finnigan, 1994).
Let’s us call (u,v,w) the tridimensional components of the wind. The air flow is in a laminar regime if w̅ ≅ 0, otherwise we are in presence of a turbulent regime. In this work, we will deal only with laminar flows.
Above the boundary layer, in particular at middle latitudes, the wind flow is usually in geostrophic balance: the two main forces that affect the flow, the Coriolis force and the Pressure gradient force, are nearly equal. In this condition, if the atmosphere is in hydrostatic equilibrium, the wind speed does not directly depend on the altitude and the wind blows at the so called geostrophic speed.
Instead, in the boundary layer the air flow is mainly affected by friction with the soil surface and the effect increases by decreasing the height. The wind is slowed down by friction and hence transfers energy to the soil. We define τ the flux of momentum that flows through the horizontal plane. Using the so called K-theory, τ can be expressed as a function of the wind speed vertical gradient as:
𝜏 = 𝐾𝑚𝜌𝜕𝑢̅ 𝜕𝑧
(9) where 𝐾𝑚 is the turbulent exchange coefficient for momentum, 𝜌 is the air density.
Since it is a flux, τ can also be defined in terms of the covariance between the horizontal and vertical wind component. For simplicity, if we consider the coordinate system with the axis x parallel to the wind propagation direction (𝑢, 𝑣) = (𝑢, 0) , we have:
𝜏 = −𝜌 𝑢′𝑤′̅̅̅̅̅̅ (10)
It is convenient to introduce a parameter 𝑢∗, called friction velocity, to parametrize τ and the wind profile. The friction velocity has indeed the dimension of a speed and all the estimates on the lifting process efficiency can be brought back to the evaluation of this parameter. It is defined by the relation:
22
𝜏𝑜 = 𝜌 𝑢∗2 (11)
the subscript symbol 0 indicate that the flux is evaluated at the surface level. In the general case where (𝑢, 𝑣) ≠ (𝑢, 0), we obtain:
𝑢∗ = √𝑢′𝑤′̅̅̅̅̅̅ 𝑜
2
+ (𝑣′𝑤′)̅̅̅̅̅̅̅̅𝑜2
4 (12)
Even if all the quantities are evaluated right at the surface level, the value of τ is practically constant up to few tens of meters above the surface. Hence, it is possible to evaluate the covariance also at some meters from the soil (Monin and Obukhov, 1954; Haugen et al., 1971).
𝐾𝑚 has the dimension of a speed times a length, hence we can introduce a constant of proportionality k and rewrite the coefficient as:
𝐾𝑚 = 𝑘 𝑢∗𝑧 (13)
k takes the name of Karman constant, its value is empirically derived and ranges between 0.35 and 0.43. In this work we will assume 𝑘 = 0.4 .
Joining the equations (9), (11) and (13), we obtain the following equation for the horizontal speed gradient: 𝜕𝑢 𝜕𝑧 = 𝑢∗ 𝑘 𝑧 (14) By integrating, we obtain the so called “law of the wall”(Priestley, 1959):
𝑢(𝑧) =𝑢 ∗ 𝑘 log 𝑧 𝑧𝑜 (15) where zo is the roughness length that represents the altitude where the wind speed becomes zero. The value of zo is related to the height of the soil coarseness, and it is roughly equal to 1/30 of the mean grains diameter.
To summarize, increasing the altitude the value of the wind speed logarithmically increases from the value 0 to the value of the geostrophic wind.
1.4.2.2 Temperature Profile
Starting from the temperature gradient, we can define the amount of heat H exchanged between the surface and atmosphere using the K-theory:
𝐻 = −𝐾ℎ 𝜌 𝑐𝑝𝜕𝜃̅(𝑧) 𝜕𝑧
(16) where Kh is turbulence heat exchange coefficient.
More specifically H represents the heat flux that passes through the horizontal plane. In analogy with what we did for the flux of momentum, we can also define H in term of the covariance between the vertical turbulence and temperature fluctuation:
𝐻 = − 𝜌 𝑐𝑝𝑤′𝜃′̅̅̅̅̅̅ (17)
Usually, it is introduced the temperature scale 𝜃∗ as analogous of u*: 𝜃∗ = 𝑤′𝜃′
̅̅̅̅̅̅ 𝑢∗
(18) In theory, also this quantity has to be evaluated right over the surface, but, as we said, the fluxes variations are negligible in the surface layer.
23 If no heat is exchanged (𝜃∗ = 0), we are in the neutral case and using the definition of potential temperature we will have simply:
𝜃̅(𝑧) = 𝜃𝑜 (19)
that is, the potential temperature is constant with height.
Whereby, the temperature change with height is given only by the pressure variation: 𝑇̅(𝑧) = 𝑇𝑜−
𝑔 𝑐𝑝
𝑧 (20)
where To is the temperature of the air layer immediately over the surface.
1.4.3 Not neutral case
1.4.3.1 Stability parameters L, Ri, Rb
Different parameters can be used to evaluate the atmospheric stability. The choice of one over another depends on the quantities that are known for the system that we want to study. The most used parameter has been introduced by Monin and Obukhov and has the form:
𝐿 = − 𝑢 ∗2 𝑘𝑔
𝜃̅𝜃∗
(21)
L has the dimension of a length and the ratio z/L (where z is the altitude) expresses the stability of the atmosphere:
- stable, if z/L>0; - neutral, if z/L=0; - unstable, if z/L<0.
Generally speaking, the Monin-Obukhov similar theory introduces the concepts that the fluxes τ and H can be evaluated using only the parameters 𝑢∗, 𝜃∗ and 𝑧
𝐿, as we will see in the next two sections.
One of the practical difficulties in evaluation of L is its directly dependence on 𝑢∗ and 𝜃∗and hence the requirement to measure the wind turbulence components in all the three dimensions. In most of the cases, the wind is measured only in the horizontal plane and with a rate of acquisition too low to evaluate the turbulence term.
For this reason, it can be more practical to utilize the Richardson number Ri:
𝑅𝑖 =𝑔 𝜃̅ 𝜕𝜃̅ 𝜕𝑧( 𝜕𝑢̅ 𝜕𝑧) −2 (22)
where, usually, the gradient terms are evaluated directly by using the difference of temperature and wind speed measurements taken at two different heights:
𝑅𝑖 =𝑔 𝜃̅
∆𝜃̅ ∆𝑢̅2∆𝑧
(23) whereby, Ri does not require the measure of the turbulence terms, and it doesn’t depend
directly by the vertical wind speed.
Using the Monin-Obukhov similarity function ϕ, that we will describe in the next section, we can directly link L to Ri:
24 𝑅𝑖 = { 𝑧 𝐿 1 (1 +5𝑧𝐿 ) 𝑠𝑡𝑎𝑏𝑙𝑒 𝑧 𝐿 𝑢𝑛𝑠𝑡𝑎𝑏𝑙𝑒
Lastly, it has been introduced the Richardson bulk number Rb for the cases when the wind
speed and the air temperature are known at only one height z, but the surface temperature is also available:
𝑅𝑖𝑏 =𝑔𝑧 ∆𝜃̅ 𝜃̅ 𝑢̅2
(24) where ∆𝜃̅ indicates the difference between the surface and air temperature.
Both Ri than Rb are defined with the same sign of L, hence if the parameter is positive it
indicates stable atmosphere, unstable if it is negative and neutral if it is zero.
1.4.3.2 Wind Speed Profile
We can introduce the effects of not neutrality of the atmosphere on the wind profile, incorporating a function that dependent from the stability parameter in eq.(14):
𝜕𝑢̅ 𝜕𝑧 = 𝑢∗ 𝑘 𝑧 𝜙𝑚( 𝑧 𝐿) (25) 𝜙𝑚 is called momentum similarity function and its trend has to be derived empirically from the experiments. Currently, the most used expression is the Businger-Dyer form (Dyer, 1974; Businger, 1988; Högström, 1988): 𝜙𝑚(𝑧 𝐿) = { 1 + 5𝐿𝑧 𝑠𝑡𝑎𝑏𝑙𝑒 1 √1 − 16𝑧𝐿 4 𝑢𝑛𝑠𝑡𝑎𝑏𝑙𝑒 (26)
anyway, these expressions are valid in conditions not too far from the neutrality. The general form of the integrated eq. (25) is:
𝑢(𝑧) =𝑢 ∗ 𝑘 log 𝑧 𝑧𝑜 − 𝜑𝑚|𝑧𝑜 𝑧 (27)
where 𝜑𝑚 is the primitive of 𝜙𝑚 and it represents the corrective term to the law of the wall. However, it is clear that the introduction of ϕ makes the integration much more complex than the neutral case and the eq. (27), as it is, can be very unpractical to use in a context of real data. Depending on the case, various simplification can be assumed, as rewrite the eq. (26) in function of Ri and consider 𝜙𝑚 not depending on z during the integration,
reintroducing the altitude only in eq. (27).
1.4.3.3 Temperature Profile
25 𝜕𝜃̅ 𝜕𝑧 = 𝜃∗ 𝑘 𝑧 𝜙ℎ( 𝑧 𝐿) (28) where 𝜙ℎ is the heat similarity function, whose expression is similar to that of 𝜙𝑚:
𝜙ℎ( 𝑧 𝐿) = { 1 + 5𝑧𝐿 𝑠𝑡𝑎𝑏𝑙𝑒 1 √1 − 16𝑧𝐿 2 𝑢𝑛𝑠𝑡𝑎𝑏𝑙𝑒 (29)
In the limit of neutral atmosphere, 𝜙ℎ(0) = 1, while 𝜃∗ = 0 and the right term of eq. (28) simply reduces to 0.
1.4.4 Dust feedback
The emission of dust can establish a feedback on the local dust lifting processes (Yue et al. 2010). As discussed earlier, the dust layer absorbs the solar radiation, heating itself and the atmosphere, cooling the surface at the same time. This increases the stability of the boundary layer decreasing the value of u* and the shear stress (eq. (27)): the wind speed is increased over the dust layer and decreased below it. For this reason, the feedback is usually negative, leading to the partial slowdown of further lifting phenomena. For example, in presence of aerosol clouds, a wind speed reduction up to 8% and 4% has been measured over the China and the Sahara, respectively (Jacobson and Kaufman, 2006; Heinold et al., 2008).
On the other hand, this effect can be inverted during the night time, where the emission due to the dust cloud can warm the surface, leading to an increase of the wind shear stress. Moreover, in some cases the feedback can result positive even during the daytime. Indeed, a dense near ground dust haze capturing the outward thermal radiation of the soil, can lead to an overall heating of the lower air layers. This leads to the increase of the atmospheric instability, favoring the convective motions and hence a further injection of grains in atmosphere.
1.5 Physic of dust lifting
R. A. Bagnold has been one of the most important early researcher of the physics of grains lifting. During his studies he individuated three main modes for the wind to set in motion the grains: the suspension, the saltation and the creep.
In the following we will analyze these different processes, explaining their range of effectiveness, both on Earth and on Mars.
26 Let us consider firstly a grain that is already in atmosphere. The particle is only affected by the wind and the gravity (G). When the air flow encounters an obstacle, in this case the particle, it exerts a dynamic pressure P. Following the Bernoulli theory P assumes the form:
𝑃 =1 2𝜌𝑣
2 (30)
where ρ is the air density and v is the relative speed between the flow and the particle motion. Let’s define A as the cross sectional area of the grain, i.e. the projection of the particle surface on a plane orthogonal to the relative motion direction. The force that affects the grain depends also on the shape of the object, texture, viscosity and other proprieties of the particle surface and fluid turbulence. Hence, we define a generic drag coefficient Cd
that takes into account these factors and that is usually empirically estimated. We obtain that the wind drag force D over the particle is:
𝐷 =1 2𝜌𝑣
2C d𝐴
(31) We can define the drag as the opposition force exerted by the wind on a body that tries to penetrate the flow. Hence, D has the same direction but opposite verse with respect to the motion of the body in the rest frame of the flow.
Considering only a vertical motion, the particles will fall accelerated by the gravity until reaching a maximum speed called free fall value vF, for witch D equals G. Smaller is the
grains, and hence less is G, less will be the vF needed to obtain the equality 𝐷 = 𝐺.
As seen in par.1.4.2.1, even in case of laminar flow, the air has a vertical turbulence component w’. The motion of the grain relative to this vertical component is downward directed with a speed equal to vF + w’. Hence, on average, the turbulence will exercise a
drag D’ upward directed. D’ tends to lift the grains with a speed w’, hence if we have w’>vF, the particles will stop falling and will be maintained in suspension by the
turbulence. Obviously, this process is effective only for smaller particles, the ones of dust size that have a low vF, while sand size and bigger particles will tend to return to the surface.
As we mentioned, dust in suspension can be lifted up in the atmosphere and travel for thousands of km before to re-falling on the ground.
1.5.2 Saltation
Until now, we faced the case of a particle that is already injected in the atmosphere. To consider the case of a particle that is still on the surface we have to introduce other important forces. Let consider a spherical grain placed on a bed of other similar particles under the influence of a horizontal wind flow. The drag tends to set in motion the grain in the horizontal direction, however this is not the only force exerted by the wind. There is another aerodynamic force directed orthogonally to the direction of relative motion that take the name of lift force. Indeed, when the wind blows around the particle, the stream moves faster over the particles than below it, where it encounters an increased friction and number of obstacles. The Bernoulli principle states that the velocity is inversely proportional to the pressure, hence a region of low pressure is created over the particle and a high one below, leading to a net upward pointing pressure gradient force, also called Saffman force, that generates the lift.
27 In order to set in motion the soil grains, the aerodynamic drag and lift have to overcome the gravity and the friction that link them to the bed below. This friction is made by the interparticle forces of chemical and electrical nature that coalesce the grains, as Van der Walls, electrostatic and water absorption forces.
As we said in the last section, the magnitude of the drag force depends on the factor Cd that
has to be evaluated empirically. However, the evaluation of the lift force is even more complicated, as it is the evaluation of the interparticle cohesion. The factors that regulate these forces are both macroscopic (e.g. composition of the soil, shape of the grains, fluid turbulence and environmental condition as the humidity and temperature) than microscopic (e.g. the distribution of the electron on the grains surface and around the contact points) and a proper grain by grain modelling is currently unachievable.
Instead to resolve the singular forces for each particle, we can consider on average the interaction between the air flow and the soil. As we introduced in par 1.4.2.1, the amount of momentum transferred by the wind to the soil is τ and it can be parametrized with the parameter u*, eq. (11). The friction velocity is not a real speed of the wind, however, it approximatively gives the amount of vertical turbulence w’ near the surface. As particles of different sizes will need a different amount of momentum τ to be set in motion, we can define this threshold as a function of u*.
Bagnold defined two kinds of threshold: a static or fluid threshold ut* needed to set in
motion the particles when they are still at rest, and an impact threshold needed to sustain the motion once this has already started. We can define ut* as (Bagnold, 1941):
𝑢𝑡∗ = 𝐴𝑓√𝜌𝑝− 𝜌 𝜌 𝑔 𝐷𝑝
(32)
where 𝐷𝑝 and 𝜌𝑝 are the diameter and density of the grain, while At is a factor that takes into account the contribute of cohesion, flow turbulence level and lift force.
For the smaller particles the cohesive forces strongly overcome the gravity contribution becoming the main resistance to motion; this results in an enhanced difficult in lifting dust size grains than sand ones. Indeed, on Earth, it has been observed that the optimum grain size for the lifting by wind is around 75 µm, with a value ut* around 0.2-0.3 m/s (see Fig.
3). The threshold rapidly increases for particle sizes greater and smaller than the optimum. On Mars, where the atmosphere is more rarefied, the threshold is one order of magnitude higher: ∼2 m/s for the optimum size ∼ 115 µm (Greeley et al., 1976).
This means that the first particles will be set in motion by wind speed of around 50 m/s, a value that is quite uncommon on the planet. Moreover, if we consider dust size particles, the necessary wind speed value grows up to over 200 m/s, a condition extremely rare on the planet. Hence, the direct aerodynamic wind lift cannot explain the abundance of dust lifting phenomena on Mars and the mean distribution of the dust haze, that peaks around diameter of ∼ 1-2 µm (Pollack et al., 1979). Indeed, even if a particle is too heavy to enter in suspension, when the drag is high enough to break the cohesion, the lift force could imprint enough impulse to raise it even slightly off the surface.
28 Fig. 3 The fluid threshold in function of the grain size for Earth, Mars and Venus. (modified, from Iversen et al.,
1976)
After the detachment from ground, the sand grains trajectories are mainly affected by the wind drag and gravity, while, the lift force due to horizontal wind that raised the object rapidly becomes negligible due to re-balancing of the flux speed above and below it. Also other contributions, as turbulence lift and the Magnus force due to grains spin, seem to be negligible. Hence, the grains will move in ballistic trajectories gaining horizontal momentum by drag before to re-fall. By impacting on the ground, these bullets partially convert a fraction of their horizontal momentum in vertical one, transferring energy to other grains. The energy can be enough not only to raise other sand grains but also to break the agglomerates of dust with a sandblasting process (the impacts on the ground of the re-falling sand grains at high velocity), making them much easier to lift (Alfaro et al., 1997; Shao, 2008; Greeley, 2002). The whole process is known as “saltation” and, starting from the particles of optimum size, it can set in motion a range of grain from large sand to small dust. Once started, the saltation can be sustained by wind less intense than the static threshold, whereby, it is possible that a single strong gust begins the process and that this is able to propagate even in a low wind speed background (Almeida et al., 2008; Kok, 2010).
The saltation process is generated by the wind, but has a feedback effect on its profile. Indeed, the particle motion increases the roughness length zo with a mechanism called “Owen effect” (Owen, 1964; Raupach, 1991).
29 Some authors have also argued that electrostatic forces can affect the motion of saltators (the grains in saltation) (Schmidt et al. 1998; Zheng et al. 2003; Kok and Renno, 2008) increasing also the number of grains involved (Zheng et al. 2006; Rasmussen et al. 2009). Finally, if the particle is too heavy to be lifted, but still light enough to be set in motion by the drag, it will start to creep along the surface displacing other particle on its trajectory. The displaced grains could in turn enter in suspension or saltation depending on their size.
1.6 Electrification
The terrestrial atmosphere is characterized by a global electric circuit that connect the ionosphere to the surface. Inside the ionosphere, the electric conductivity is increased by the ionization by solar and cosmic rays and its value is approximatively constant with height. Under the ionosphere there is the so called electrosphere where the conductivity decreases toward the surface. A general positive current flows from the upper atmosphere and to the soil, tending to positively charge the electrosphere and the surface. The value of the electric field is inversely proportional to the conductivity, hence, its maximum is reached in a layer of roughly 1 km above the surface with a fair weather field of ∼50 V/m downward directed.
Sand and dust lifting phenomena can lead to the induction of electric field (E-field) up to three orders of magnitude greater than this background. For example, dust devils with a vertical electric field of over 4000 V/m have been reported, firstly by Freier (1960) and Crozier (1964, 1970) and more recently by Farrell et al. 2004.
Inside the dust cloud, the grains mobilized by the wind collide with each other and with the surface, acquiring charge by triboelectricity, leaving the whole system approximatively neutral (Kunkel, 1950; Eden and Vonnegut, 1973).
The exact mechanism that leads to the grains electrification is still debated and not completely understood (see Harrison et al. 2016 for a review on the topic). For a heterogeneous system the charge acquired during the impacts depends primarily on the composition of the colliders and their superficial proprieties (McCarty and Whitesides 2008). In the simplified case that the whole cloud is approximatively homogeneous, the charging process is size-dependent: the smaller grains tend to acquire a charge opposite to the larger ones (Inculet et al., 2006; Duff and Lacks, 2008; Esposito et al., 2016a; Harrison et al., 2016; Neakrase et al., 2016). The smaller particles are lighter and are then driven upwards by the flow, while the larger ones remain closer to the ground, thus producing the charge separation.
The presence of suspended dust negatively charged over a cloud of sand of the opposite sign (upward directed E-field) is consistent with the majority of field and laboratory measurements reported in literature (Bo and Zheng 2013; Frier 1960; Croizer 1964 and 1970; Farrell et al. 2004, Jackson et al. 2006). However, there are cases where this electric configuration is not reproduced (Trigwell et al. 2003, Sowinski et al. 2010, Kunkel 1950) and there are also reported cases where the electric field is downward directed (Demon et al. 1953; Esposito et al. 2016).
30 Overall, the contact electrification is still poorly understood. Laboratory experiments confirm that composition and the diameter distribution of grains play a fundamental role; however, the quantification of their effect is still not clear. The problem is even more complex when we want to study the triboelectrification inside the dust lifting events, because the dynamic of the phenomena and the environmental atmospheric conditions can heavily affect the final result.
These reasons have motivated the execution of more detailed field surveys, as the ones reported in this work. Indeed, the main purpose of this thesis is exactly the study of the proprieties of the E-field induced by dust lifting events, in order to deepen our knowledge on a field that is still really poor understood and apply the results to the Martian atmosphere, that recent studies hypothesize considerably affected by the triboelectrification.
1.6.1 Electrification on Mars
A global atmospheric electrical circuit is likely to exist also on Mars, but, due to the lack of an adequate in situ instrumentation, its presence has not yet been confirmed. However, the abundance of entrained dust, the generally favorable condition for lifted grains to acquire and hold charge and laboratory experiments performed in Martian like condition suggest the existence of an atmospheric electric field, widespread across the planet and highly variable in relation to the dust lifting activity (Eden and Vonnegut 1973, Forward et al. 2009, Barth et al 2016). The triboelectricity associated with dust impacts is expected to be the main charging mechanism of the atmosphere, differently than on Earth where the atmospheric ionization dominates.
The electric field induced by the lifting processes may significantly affect the composition of the Martian atmosphere and the habitability of the planet, locally enhancing by up to 200 times the chemical formation of oxidants able to scavenge organic material from the surface (Atreya et al. 2006).
If the potential difference equals the breakdown voltage of the system an electrostatic discharge can occur. According to the Paschen’s law, this voltage decreases with the gas density, that on Mars is two order of magnitude lower than the terrestrial one. Hence, the Martian atmospheric electric breakdown field strength is only ~20 kV/m (Melnik and Parrot 1998) and the concentration of suspended charges can lead to the formation of electric discharges, potentially able to interfere and cause damage to the landed instrumentation, representing also an issue for the human exploration.


![Luigi Fontanella, L’adolescenza e la notte, Firenze, Passigli, 2015 : [recensione]](data:image/gif;base64,R0lGODlhAQABAIAAAP///wAAACH5BAEAAAAALAAAAAABAAEAAAICRAEAOw==)