Development of biomechanical-based
analysis tools for the evaluation of
infringements and performance in
race-walking
Advisors:
Candidate:
Prof. Giuseppe Di Gironimo
Teodorico CAPORASO
I
Index
Index of Figures ... IV Index of Tables ... IX Abstract ... 1 Introduction ... 3CHAPTER 1: ENGINEERING IN RACE-WALKING ... 5
1.1 The role of engineering in sport ... 7
1.1.1 The impact of technologies in sports ... 8
1.1.2 Sports engineering applications @ IDEAS Lab ... 10
1.2 Race-walking: history and rules ... 13
1.3 Infringements and performance in race-walking ... 18
1.4 Race-Walking stakeholders ... 28
1.5 Technology in Race-walking ... 30
CHAPTER 2: USER-CENTERED DESIGN FOR RACE-WALKING ANALYSIS TOOLS ... 43
2.1 Kansei Engineering ... 45
2.2 Definition domain ... 47
2.3 Span the Semantic and Properties Space ... 48
2.4 Selection of the Optimal System Architecture ... 53
CHAPTER 3: BIOMECHANICAL-BASED METHOD FOR ASSESSMENT OF INFRINGEMENTS AND PERFORMANCE IN RACE-WALKING ... 57
3.1 Inertial data processing ... 59
3.1.1 Signal Filtering ... 59
II
3.2 Step Classification ... 63
3.2.1 Binary classification ... 63
3.2.2 Three-level classification ... 63
3.2.3 Fuzzy classification ... 65
3.2.4 Estimation of judge’s field of view – Step sequence classification ... 66
3.3 Performance indices assessment ... 68
3.4 Development of a customized strategy for élite race-walkers: radar chart representation ... 69
CHAPTER 4: EXPERIMENTAL VALIDATION OF INDICES FOR EVALUATING INFRINGEMENTS AND PERFORMANCE IN RACE WALKING SCENARIOS ... 72
4.1 Laboratory tests ... 74
4.1.1 Participants ... 74
4.1.2 Devices and Experimental Settings ... 75
4.1.3 Experimental Protocol ... 77
4.1.4 Data analysis ... 79
4.1.5 Results and discussion ... 80
4.2 Field test ... 85
4.2.1 Field test: EP assessment ... 86
4.2.1.1 Experimental set-up ... 86
4.2.1.2 Experimental protocol ... 87
4.2.1.3 Results and discussion ... 88
4.2.2 Field test: experiments with elite athletes ... 91
4.2.2.1 Participants ... 91
III
4.2.2.3 Comparison and Evaluation: Data analysis ... 93
4.2.2.3.1 Binary step classification: Results and Discussion ... 97
Athlete 1 ... 97
Athlete 2 ... 101
Key outputs Binary classification... 105
4.2.2.3.2 Three level step classification: Results and Discussion ... 106
4.2.2.3.3 Fuzzy classification: Results and Discussion ... 108
4.2.3 Radar chart representation of infringements and performances for nine èlite athletes 109 CHAPTER 5: TOWARDS THE EXPERIMENTAL PROOF-OF-CONCEPT OF A CUSTOM SYSTEM FOR EVALUATION OF INFRINGEMENTS AND PERFORMANCE IN RACE-WALKING ... 115
5.1 Proof of Concept: Measurement Unit ... 117
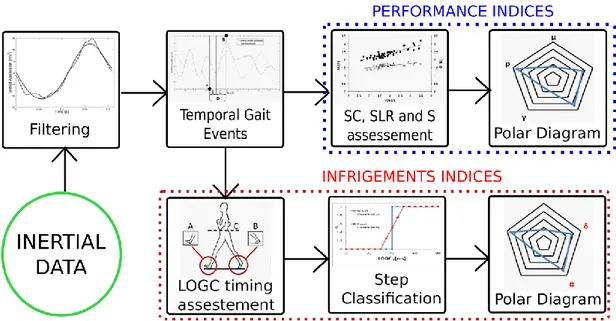
5.1.1 Inertial sensor platform ... 117
5.1.2 Inertial sensor packaging... 118
5.2 Proof of Concept: Control Unit ... 121
5.2.1 Development of IART: a mobile app for evaluation of infringements and performance in race-walking ... 121
Conclusions ... 125
Acknowledgments ... 127
Appendix A ... 129
Questionnaire “Support device to control the loss of contact with the ground-level in the race-walking” ... 129
IV
Index of Figures
Figure 1 The flow chart of the case-study approach ... 6 Figure 2 First page of a newspaper and pictures of pedestrian race at the end of 18th in
England ... 13 Figure 3 Mean velocity of world records for the men’s 20km race-walking. ... 16 Figure 4 Mean velocity of world records for the men’s 50km race-walking ... 17 Figure 5 Highlights of a race-walking cycle: 1) the heel-strike event, 2) the mid-stance event, 3) the start of the propulsive action, 4) the toe-off event ... 18 Figure 6 Frontal plane in virtual view of a race-walker. ... 19 Figure 7 Knee-flexion extension during the stance phase and related warning for bent knee ... 20 Figure 8 Temporal gait events: A) the toe-off and C) the heel-strike; B) shows a LOGC ... 21 Figure 9 A picture of the men’s 20 km race-walking in the last Olympic Games (Rio de Janeiro 2016 - FIDAL - G. Colombo) ... 23 Figure 10 Biomechanical warnings for the judging of infringements in race-walking ... 24 Figure 11 In a) a bent knee (with a flexion of knee before the vertical upright position); c) a LOGC picture. In b) the symobols associated with the two infringements (“<” bent knee and “˷” LOGC) ... 25
Figure 12 In a) a race-walker received a yellow paddle; b) a picture of the electronic board with the red cards associated to the different race-walkers; c) a disqualification in competition of a race-walker ... 25 Figure 13 Percentage of red card for LOGC related to men’s 20 km, women’s 20 km and men’s 50 km and an overall during the last three edition of World IAAF Championship (Moscow 2013, Beijing 2015 and London 2017) and last edition of Summer Olympic Games (Rio de Janeiro 2016) and an overall of the four competition. ... 26
V
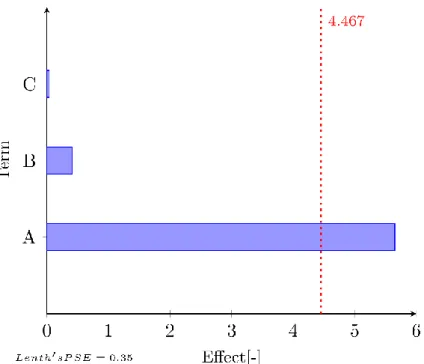
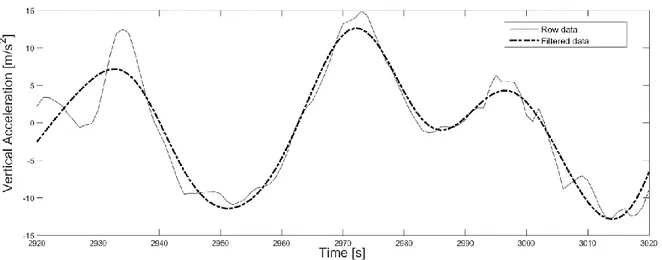
Figure 14 Race-walking stakeholders ... 29 Figure 15 Pie chart of the race-walking studies partecipants divided into seven different range. ... 38 Figure 16 Pie chart of the race-walking studies scenario. In the legend: LTO represents Laboratory Track Overground; LT represents Laboratory Treadmill; LO represents Laboratory Overground; RC represents Road Competition; TT represents Track Test; RT represents Road Test ... 38 Figure 17 Bar graph about sample frequencies of the equipment in race-walking studies. In blue the bars related to all the papers; in red the bars related to papers in real scenario ... 39 Figure 18 Bar graph about type of equipment in race-walking studies. On the x lable V represents High Speed Camera video(s); P represents force platform(s); S represents Inertial Sensor(s); C represents infrared camera(s); IP represents Insole Pressure System; O represents Optojump. In blue the bars related to all the papers; in red the bars related to papers in real scenario ... 40 Figure 19 The flow chart of the Kansei Engineering approach ... 44 Figure 20 Chart of the effects (overall mean response with α = 0.05) ... 55 Figure 21 Main effects plot for the overall mean response and optimal level of the significant A factor ... 55 Figure 22 Picture of a possible real scenario: measurement unit placed at the end of athlete’s column vertebra in communication with the control unit handled by judge. ... 56 Figure 23 Flow chart of the methodological approach for inertial data processing and analysis ... 58 Figure 24 The power spectrum for accelerations on the x-axis ... 59 Figure 25 The comparison between the vertical acceleration based on raw data and the one two-times filtered ... 59 Figure 26 The signal processing applied to inertial system data in laboratory test ... 60
VI
Figure 27 The signal processing applied to inertial system data in laboratory test ... 61 Figure 28 The correlation between the CoM accelerations and gait temporal events (TOE: toe-off event; HSE: heel strike event) for assessing the LOGC (using the threshold value E). The time between two following HSE represents the Step time. ... 62 Figure 29 Acceleration data, on the left: the vertical acceleration near the bottom point of the cycle; on the right: antero-Posterior acceleration near the maximum point of the cycle. ... 64 Figure 30 The novel step classification. On the abscissa axis the value of LOGCT expressed in
ms. On the ordinate axis the different step classification. On the graph the legal steps are in “green”, doubt steps in “yellow”, illegal steps in “red”. The vertical dotted line represents the limit of human eyes (40 ms). ... 65 Figure 31 Inertial system membership function compared with the binary classification ... 66 Figure 32 Judge’s field of view design: A) Judge; B) Athlete; C) Area of observation for a field of view at β; D) Additional Area for field of view allowed through acceptable eye rotation (γ). The x axis represents the athlete’s direction of progression, y axis is orthogonal to the athlete’s direction of progression ... 67 Figure 33 In the figure the red indices are related to the infringements, the black ones to the performance. The blue opacity area (β) represents the synthetic index. ... 71 Figure 34 The methodological approach ... 74 Figure 35 The experimental setting of the ErgoS Lab: the A zone shows the control volume, the B zone shows eight integrated platforms of force, and the capital letter C indicates the ten infrared digital cameras. The bottom left corner of the B zone matches with the origin of the reference system. The x and z axes show the anteroposterior direction and the medio-lateral direction, respectively; and the y axis (not visible since leaving the plane) indicates the vertical direction. All distance are expressed in meters. ... 78 Figure 36 Main phases of a race-walking cycle during a laboratory test ... 79 Figure 37 A basic ROC graph showing three classifiers ... 83
VII
Figure 38 The variation of the accuracy in function of the E (toe-off threshold) ... 84 Figure 39 Flow chart methodological approach field test ... 85 Figure 40 Data collection setting: 1) the laptop with software for acquisition of inertial data and the USB Bluetooth; 2) the webcam; 3) the high-speed camera; 4) the tablet ... 86 Figure 41 Main phases of a race-walking cycle during a field test ... 87 Figure 42 Scatter plot of Optimal Threshold vs cadence Step ( in red the area excled by analysis) ... 89 Figure 43 Normal probability plot of residuals (response OT) ... 90 Figure 44 Two photo sequences with magnifying glass focus around the left foot (near the TOE) and right foot (near the HSE): a) Last imagine with visible ground contact of left foot; b) First imagine without last visible ground contact of left foot; c) Last imagine without visible ground contact of right foot; d) First imagine with visible ground contact of right foot. ... 95 Figure 45 Comparison between the two classifications (M: represent the inertial system; GT: the high speed camera system) on three levels. The vertical dotted line represents the limit of human eyes (40 ms). ... 95 Figure 46 Membership functions for the video ground truth system ... 96 Figure 47 A basic ROC graph showing the two classifiers: (A) advanced, (P) previous ... 100 Figure 48 A basic ROC graph showing the two classifiers for the athlete 2: (A) advanced, (P) previous ... 105 Figure 49 Two precision-recall curves represent the performance levels of two classifiers A and P. ... 108 Figure 50 Radar charts for the experimental tests. The red indices are related to the infringements, the black ones to the performance. The coloured lines graphically show the trend of the indices at different speeds (blue: 12.0 km/h, red:13.0 km/h, green:14.0 km/h, yellow:14.5 km/h). ... 111
VIII
Figure 51: Performance (ρ, γ, μ), infringement (α, δ) and overall (β) indices at different speeds. ES, effect sizes according to Hedges' g ... 112 Figure 52Pie graph showing κ indices ... 113 Figure 53 Architeture design proof of concept development ... 116 Figure 54 Rendering of the box case components: a) whole box b) upper part; c) lower part ... 118 Figure 55 Picture showing the several component of measurement unit: inertial sensor, case box upper and lower part, port cover, 4 screws and battery. ... 120 Figure 56 A screenshot of the IDE Android Studio ... 122 Figure 57 Flow diagram of app user interface ... 123
IX
Index of Tables
Table 1 Estimation of performance improvement index (∆Overall) and the equipment factor
assessed for each discipline (∆Equipment) in a specific interval of time (∆Time). ... 9
Table 2 Estimates of performance improvement index (∆Overall) in a specific interval of time (∆Time) for the main race-walking man race event. ... 16
Table 3 Flight Time data (mean ± SD) and total red cards (loss of contact) ... 23
Table 4 The biomechanical studies of race-walking in the last five years ... 31
Table 5 Kansei words based on the affinity diagram ... 49
Table 6 Mean scores of properties ... 51
Table 7 Design factors and their levels selected for the development of concepts ... 51
Table 8 Fractional factorial design of three factors defining four concepts ... 53
Table 9 Subjective ratings collected for each Kansei word and their overall mean ... 54
Table 10 Analysis of variance for the overall mean response (α = 0.05) ... 54
Table 11 Mean and standard deviation related to age, stature, weight and experience of race-walkers ... 75
Table 12 Data sheet of the inertial system ... 76
Table 13 Data sheet of the dynamic system ... 76
Table 14 Data sheet of the kinematic system ... 77
Table 15 Descriptive statistics for LOGC data stratified for measuring system [ms]... 80
Table 16 Steps classification according to three different methods for LOGC evaluation ... 81
Table 17 Comparison of classification metrics ... 82
Table 18 LOGC data collected during trials with inertial system (previous model) and ground truth ... 88
X
Table 19 Summary parameters of the model ... 90 Table 20 LOGC inertial assessment with the advanced model. ... 91 Table 21 Mean and standard deviation related to their personal best, age, stature and experience of race-walkers ... 92 Table 22 Planning of trials analyzed: the line in reds include the trial tests for the overview athletes’ analysis; the column in blu the trials for the specific speed analysis. ... 93 Table 23 Steps’ classification according to contingency table for the trials at 12.0 km/h, 12.9 km/h, 13.7 km/h and 14.6 km/h (previous model) ... 97 Table 24 Steps’ classification according to contingency table for the trials at 12.0 km/h, 12.9 km/h, 13.7 km/h and 14.6 km/h (adavanced model) ... 98 Table 25 Statistics for the two models at different velocities (best values are underlined in each column). ... 99 Table 26 Contingency table of step sequences based on previous (right) and advanced (left) model ... 99 Table 27 Statistics for the two models in sequence step evaluation (best values are underlined in each column). ... 100 Table 28 LOGC data collected during trials of Athlete 2 with inertial system (advanced and previous model) and ground truth ... 101 Table 29 Steps’ classification according to contingency table for the trials at 11.9 km/h, 12.9 km/h, 13.8 km/h and 15.7 km/h (previous models) – Athlete 2 ... 102 Table 30 Steps’ classification according to contingency table for the trials at 11.9 km/h, 12.9 km/h, 13.8 km/h and 15.7 km/h (advanced model) – Athlete 2 ... 103 Table 31 Statistics for the two models at different velocities (best values are underlined in each column) – Athlete 2 ... 104 Table 32 Contingency table of step sequences based on previous (right) and advanced (left) model – Athlete 2 ... 104
XI
Table 33 Statistics for the two models in sequence step evaluation (best values are
underlined in each column). ... 105
Table 34 Step sequences classification according to three multi-class confusion matrices for P and A model ... 106
Table 35 Comparison between Statistics based on the multi-class confusion matrices (best column values are underlined)... 107
Table 36 Coordinates of the four points in the Precision Recall graph ... 108
Table 37 Performance index α of the two models previous (P) and advanced (A) ... 109
Table 38 Performance index α in the step sequences analysis ... 109
Table 39 Performance and infringements parameters data collected during trials (mean±SD) ... 110
Table 40 Data sheet of the BWT901CL, WitMotion inertial platform ... 117
1
Abstract
Nowadays, the sports engineering and technology play an important role (like coaching and medical care) both for the overall performance of the athlete (training and competition) and in making sports more entertaining and safe. In this technological scenario an interesting case study, with a strong requirement of technology both for the improvement of performance and for the support of the judgments, is represented by the race-walking. This is a long-distance discipline within the track and field program characterized by two possible infringements (“bent knee” and “Loss Of Ground Contact”) but at the same time the best chronometric performance is required.
In this context, in order to assist coaching, judging and audience, the study aims at developing an innovative biomechanical based methodology for the performance and infringements assessment in race-walking using a wearable inertial system. For this aim, an user-center design for the development of the architecture of the system was carried out. So, the positioning on the human body and functional requirements of the system were defined through a Kansei Engineering approach by using a significant sample of athletes, coaches and judges within the race-walking environment. The analysis of variance (ANOVA) supported decisions concerning the optimal system architecture. This consists of: (i) an inertial sensor positioned close to the centre-of-mass of the subject (on L5 vertebra); (ii) a control unit.
Starting from the inertial data, a biomechanical based approach for the assessment of main parameters for performance and infringements in race-walking was developed. Based on the assessment of the LOGC time, according to the race-walking competition rules, three different step classification methods were proposed. In addition, we developed a customized strategy for élite race-walkers that allows to obtain key biomechanical indices related to performance and infringements (and a synthetic overall index). Their representation on a radar graph allows an intuitive analysis. The methodology was validated both in laboratory and field condition using a commercial inertial sensor. The first one was
2
conducted at the ErgoS Lab part of the Fraunhofer Joint Labs IDEAS (www.ideas.unina.it) and CESMA (www.cesma.unina.it). It consists of a motion capture system, including force platform (680 Hz) and infrared digital cameras (340 Hz), which are more accurate than the inertial system (200 Hz). The proposed biomechanical based approach and step classifications were evaluated in field tests, using a high speed camera system (240Hz). These experimental tests were performed in a training scenario with nine international élite race-walkers. They performed four outdoor field tests at different velocities. Through statistical classification, it was found that the proposed methodology has achieved encouraging results in comparison with state-of-the-art approaches and could be a good tool to assist experts in step classification. The statistical analysis also confirms the quality and reliability of the proposed biomechanical indices as well as of their representation.
Finally, a prototype of a customized sensor for race-walking and a dedicated mobile app were developed. Starting from an inertial sensor platform integrated with a Bluetooth module, the mobile app with two possible settings (coach and judge) was developed. It offers an example of a useful and practical tool for field applications.
3
Introduction
Recent history shows that, at various levels and in many disciplines, technological evolution has radically changed the way how sport is approached from the monitoring and training point of view; consequently, the performance of the athletes has improved. The use of technology for sport applications allows to collect a large amount of data by different tools. Video and tracking technology, wearable devices, fitness trackers, equipment design and clothing, as well as the novel materials introduced in the recent years, have strongly influenced the performance. The adoption of these new tools is useful to understand and evaluate the dynamic evolution of the general state of the athlete's physical condition. More recently, technologies have been tested also to help the judgment system in many sports. This influence is also evident in the world of the race-walking. Race-walking is a long-distance discipline within the track and field program characterized by two possible infringements (bent knee and Loss Of Ground Contact) but at the same time the best chronometric performances are required. It is worth noticing that nowadays judges can rely only on their subjective observations (made by human eyes); to date, technology is not used to support the judging decisions. With the current method, there is a critical issue in race-walking competitions: the very short duration of the loss of ground contact events generates difficulties in a proper identification of a correct/incorrect gesture. This is a major problem since the looking for performance optimization might determine a good or bad final result. For example, increasing the step length even of a single centimeter can lead to a time improving of about 2 minutes at the end of 50 km, greater than the range between the first and the fourth at the Olympic games.
So, nowadays the context of the race-walking highlighted the need of an analysis tool for the monitoring of the performance and infringements, in order to assist coaching and judging. The present study aims at achieving this objective using a wearable inertial system. These custom tools could allow to assist coaching, judging and audience in race-walking. For this aim, the work involves the following objectives:
4
- to develop a user-center design for sport analysis tool in race-walking through a Kansei Engineering approach;
- to develop a biomechanical based approach for the assessment of the main parameters for infringements and performance in race-walking;
- to validate the methodology in laboratory and field condition using a commercial inertial sensor;
5
CHAPTER 1:
6
In this first chapter, we present the role of engineering in sport with a particular focus on its influence in equipment improvements and performance analysis tools. Then, the case study of race-walking is introduced with an overview about its history and rules. After a short description of race-walking world with its main stakeholders, the role of technology in this particular sport is shown. Finally, a review of the last studies on race-walking biomechanics allows to understand the features of the current available technology with a focus on field tests. The flow chart in Figure 1 summarizes the approach used for our case-study.
7
1.1 The role of engineering in sport
Although sport and engineering can appear different worlds, their interaction is increasingly marked. The engineering is involved in sport and it is part of the complex world around the athlete. It answers the requests of the best performance and protection of the athletes. These motivations are at the basis of the birth of the “Sports Engineering”. It is a relatively young engineering discipline that links the gap between two distinctive fields: sport science and engineering. A possible definition of Sports engineering is: “the technical application of math and physics to solve sporting problems” and it “implies the design, development and research into external devices used by athletes, sports men and sports women, to enhance their performance” (Taha, 2013). On the other side the sport science is “a scientific process used to guide the practice of sport with the ultimate aim of improving sporting performance” (Bishop, 2008). It is evident a partial overlapping between the two discipline (as descried by Haake (Haake S. , 1999)). They have the shared aim to improve the athlete’s performance, but they play a different role. In general, sports engineers develop a method, and then apply their skills to many different sporting fields. They are involved in designing and answering the athlete’s demands, besides measuring the performance of the athlete, the equipment itself, as well as their interaction. This information is precious for sports science expertise. Indeed, they use these data to have the best available evidence at the right time, in the right environment, for the right individual to improve the athlete’s performance (Bishop, 2008). The first steps of the engineering scientific study in the sport have led to a drive to build better, faster and stronger equipment and ultimately athletes as well. This has largely been driven by the rise of professional sport (and their associated budgets) together with national prestige in international competitions such as the Olympics. Moreover, in the Paralympic field sport engineering allows para-athletes to increase their participation in sport competition and their performance. Nowadays, sports engineering is a discipline that combines the fields of mechanical engineering, electronic and communications engineering, computational modelling and data analytics as well as biomechanics and sensors.
8
In detail, in the athlete’s world sports engineering allows:
- to improve the design of equipment (and athlete’s interaction) in order to increase the performance of the system (equipment plus athlete). For this aim, sports engineers use also the knowledge coming from basic discipline like aerodynamics (i.e. in sport like cycling, sailing, football, alpine skiing) and hydrodynamics (i.e. in sport like swimming, rowing, kayak) and materials science;
- to improve the design of equipment (and athlete’s interaction) in order to increase the safety and reduce the risk of injuries of the athletes. For this aim, sports engineers use tools like: simulation models that allow to obtain good reproduction of the real situation (athlete’s interactions and impacts) and to study behaviors of the different products, in order to define the best design and to choose the material with best proprieties;
- to develop tools for the measurement of athlete’s performance (i.e. real time feedback system) in order to assess key performance indices (and race prediction pacing systems) useful to better understand and to improve the efficiency of the sport gesture. For this aim, the sports engineering uses the knowledge coming from the biomechanical and kinematics studies to develop protocol for data analysis and specific algorithms.
- to develop products and tools to increase the active engagement in sports for not able people. For this aim, sports engineers design adaptive products (i.e. wheelchair and handcycle) and they develop new methodologies of impairment classification to make them able to compete in sports (such as tests of impaired coordination for Paralympic classification (Connick, 2016)).
1.1.1 The impact of technologies in sports
In this context, it is clear that the sports engineering and technology play an important role (like coaching and medical care) both for the overall performance of an athlete (training and competition) and in making sports more entertaining and safe.
As shown, the effects of sports engineering are related with sports equipment improvement but also with performance analysis tools. A quantitative evaluation of the evidence and the
9
magnitude of the technological effect on sport performance (in terms of sport equipment improvement) was showed by Haake (Haake S. J., 2009). In his research, he took into consideration four discipline of the Olympic games program: 100m, pole vault and javelin in track and field program, 1 hour on track in cycling program. Table 1 shows the results obtained.
Table 1 Estimation of performance improvement index (∆Overall) and the equipment factor assessed for each discipline (∆Equipment) in a specific interval of time (∆Time).
100 m Pole Vault Javelin 1h Cycling
∆Time [years] 108 94 76 111
∆Overall +24% +86% +95% +221%
∆Equipment +4% (17%) +30% (35%) +30% (32%) +100% (45%)
In a similar period of reference (∆Time) a large difference between each sport is shown. Cycling has seen the most important equipment improvement contribution, indeed Table 1 shows that the ∆Equipment is 100% (in the one-hour cycling world record). It could be attributed to developments in bicycle aerodynamics (Lukes, 2005) and it is equal to the 45% of the overall improvement. In the track and field area, significant improvements (technological developments affected the index by about 30%) were seen with the introduction of new pole vaults (Burgess, 1996) and javelin (Hubbard, 1984) (although in the 1986 the change of center of mass location in the javelin significantly worsened performance). Finally, the analysis of the 100m sprint underlined that ∆Equipment (due to in improvement in aerodynamic clothing design (Chowdhury, 2009)) is just 4%, representing the 17% of the ∆Overall equal to 24%. In this case, the improvement in the methodology of training represents a primary aspect in the overall increasing of the performance.
So, the weight of the improvement in the methodology of training is the key point in the performance increasing in long distance discipline (where, in relationship with the velocity, the aerodynamic clothing design is negligible). In this case the support of tools for the measurement of athlete’s performance can play an important role for the training.
10
On the other side, the technological effect on sport is also evident in the support of the judgment. Several sports are already in full contact with the technology to assists the referee. Many systems are based on high speed camera system. They allowed the development of tools like the Video Challenge in the volleyball that permits to determine if the ball has fallen down outside or inside the game area (Chen, 2011). In the tennis, since 2002 there is the technology of “Hawk-Eye” tennis ball tracking system. Starting from a high-speed camera system the ball is extracted on each frame and 2D 'tracklets' of the ball's motion are built up on the image plane. These tracklets are sent to the 3D Reconstitution module which constructs the tracklets into 3D tracks and determines the impact points between separate tracks (Owens, 2003). Other example of technological support is in the soccer, where since 2012 there is the “Goal-Line Technology”. It provides a clear indication to the referee - typically on a special watch - whether the ball has fully crossed the line. In this case a technological solution based on electromagnetic field with a RFID (Radio-Frequency Identification) approach is also used (Psiuk, 2014).
In this technological scenario an interesting case study, where there is a strong requirement for technology both for the improvement of performance and for the support of the judgments, is represented by the race-walking.
1.1.2 Sports engineering applications @ IDEAS Lab
The Joint Laboratory "Interactive DEsign And Simulation" (IDEAS, www.ideas.unina.it) has been established by Fraunhofer IWU - Fraunhofer Institute for Machine Tools and Forming Technology in Chemnitz (Deutschland) and DII – Dept. of Industrial Engineering in Naples (Italy). The DII have also signed two scientific partnerships with:
- physicians specialized in Physical and Rehabilitation Medicine of the Multidisciplinary Department of Medicine for Surgery and Orthodontics of the University of Campania “L. Vanvitelli”, in order to maximize the benefits of interdisciplinary research;
- Don Orione Rehabilitation Center of Ercolano (Naples), in order to increase our public and social engagement activities.
11
One of Joint Lab IDEAS is the Laboratory of Ergonomics and Sports (ErgoS Lab) at CESMA (www.cesma.unina.it) - University of Naples Federico II. The ErgoS Lab is an advanced multifactorial laboratory for the analysis of human movement. The laboratory allows, in sports area, the use of different technologies. It gives the opportunity to have useful information and feedbacks to adjust and improve technique and performance. ErgoS Lab offers the possibility to simulate the movement with the standardization of training environment. In addition, the integration of motion capture system information with body pressure data offers useful measurements in ergonomic and comfort area. Posture and ergonomics evaluations permit to prevent occupational injury and illness also through a specific advanced design.
The laboratory is equipped with ten infrared and four colour digital cameras, eight tri-axial force platforms and six electromyography probes. A central workstation integrates, synchronizes and reworks the signals coming from the connected devices. A further stand-alone mobile system consisting of an inertial sensor synchronized with six EMG probes is used for outdoor measurements. A whole-body pressure mapping system made of resistive insoles for feet and two resistive mats for seat and backrest completes the lab equipment. Proper biomechanical analysis software allows to build up multifactorial protocols involving 3D kinematics and dynamics, muscle activity and pressure mapping. The laboratory is also equipped with an impact test apparatus, consisting of a vertical linear rail system allowing the adjustment of drop height.
Its main research themes are:
• Design of sport equipment (such as the improvement of the sports equipment performance carried out in the field of rowing (Caporaso T. G., 2018) (Caporaso T. P., 2018)); • Development and validation of protective device for impact safety in sports (for example, the improvement of the athlete safety in the field of soccer (Odenwald, 2016) (Lanzotti A. C., 2016) and the improvement of passive safety in sports and gymnastic equipment applications (Schwanitz, 2014) (Costabile G. A., 2013) (Costabile G. S., 2013).
12
• Design of custom aids for health and sport based on biomechanics measurement systems for laboratory and outside laboratory use (such as design and developing of a biomechanics measurement system to acquire human body morphology) (Grazioso S. S., 2016) (Grazioso S. S., 2018) (Grazioso S. S., 2018);
• Development of performance analysis methods for use in élite sports performance and technique evaluation (Caporaso T. G., 2018);
• Development of custom metrics to measure human performance in partnership with coaches, trainers and physician useful to in the implementation of élite sport programs for able and disable people (for example developing customized methods for assessing motor tasks in people with intellectual disability) (Caporaso T. P., 2017) (Palomba A. C., 2018) . Additional research items in sports area are in the following fields: swimming with the design of a packing system to use inertial sensor in swimming tests; and cycling for development of a multifactorial analysis protocol to carry out performance and posture indices useful to improve posture and reduce the risk of injuries (even using digital human modelling (Caporaso T. D., 2017)).
Finally, in this work will be presented an extended study on race-walking. This study covers different of the previously mentioned research items. Indeed, it is centred on the development of a biomechanics measurement system for real scenarios. It is based on user centred design and includes the development of performance analysis methods in élite sports. Finally, it allows to provide key performance indicators through a mobile app.
13
1.2 Race-walking: history and rules
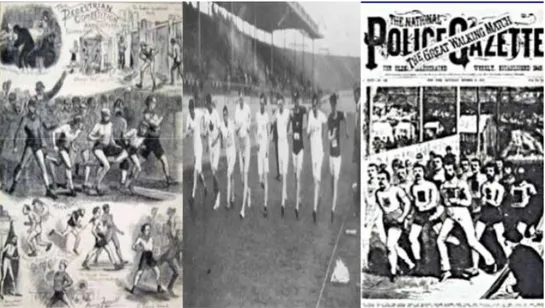
Race-walking is a historical discipline born in Great Britain in the 16th century. The first
race-walking events (called pedestrian race), took place at the end of the 18th in England and then
even in the USA. These races were followed by press and people and race-walkers were very famous (see Figure 2). In the second part of the 19th century, race walking lost reliability to
the public because of the lack of rules to identify the transition between walking and running (Schiffer, 2008).
Figure 2 First page of a newspaper and pictures of pedestrian race at the end of 18th in England
In the scenario of the official sports events, it has always been included in the track and field program of the major international events. Indeed, race-walking became a permanent Olympic event in 1908 and has been included in the International Association of Athletics Federations (IAAF) World Championships. Although all the athletic disciplines have seen many changes over the time, the evolutions and the improvements of the race-walking have a unique history in the track and field world. In the scenario of official sports events, the central and critical point of race-walking’s history is its rule (or definition).
The first “Rule of Race Walking” is dated 1877: “A succession of springs and the toes of one foot should not leave the ground till the heel of the other was down’’. The rule was changed many times: in the 1926 the first definition by IAAF stated: “Walking is a progression by
14
steps so taken that unbroken contact with the ground is maintained”; in the 1956 there was the introduction of comma about “..the leg shall be straightened (i.e. not bent at the knee) for at least one moment”; in the 1972 this comma had further specification: “For at least one moment, and in particular, the supporting leg must be straight in the vertical position”. The progression of technology of the 1990s showed through the recording of high-quality video and photo (with a high sample frequency) a constant loss of ground contact during racewalking action. So, starting from this apparent contradiction between definition and reality but wanting to remain linked to the concept of walking, the definition was changed, introducing the require of “visible loss of contact”. However, the comma about “bent knee” still remained difficult to apply. So, the definition of race-walking changed again in the 1995. This is the last and actual definition of race walking (from the rule 230 of Competition Rules IAAF) and it states: “Race Walking is a progression of steps so taken that the walker makes contact with the ground, so that no visible (to the human eye) loss of contact occurs. The advancing leg must be straightened (i.e. not bent at the knee) from the moment of first contact with the ground until the vertical upright position” (Schiffer, 2008).
During competitions, the rule control is committed on subjective human observations by judges (by human eye) and, since 1880, in race walking events cautions and disqualifications had to be left to the discretion of the judges. However, the judgment has been a critical point since the beginning. Already in 1924 during the Olympic Games there were controversies about the judgements and the International Olympic Committee decided to cancel race-walking by successive Games (1928). Then, it was reintroduced in the Olympic program in the 1932. However, even in the following edition of Olympic Games, although the race-walking was no more deleted from the official program, there were other issues because of the lack of homogeneity in the judgement (the most popular: Helsinki 1952, Montreal 1976 and Sydney 2000). In the last case, the leader of the men’s 20-kilometer race was disqualified fifteen minutes after the finish of the race and a similar situation happened at the end of the women’s 20-kilometer event with the disqualification of the leader of the race few meters before the finish line. In the 2001, in order to reduce the time for the communication of red cards to the disqualification posting (and to improve the timeliness of
15
the judgment action) a new quick transmission system of the proposal of disqualification was developed. In the 2007, during the IAAF World Championship in Osaka, Francisco Javier Fernandez (Spain) was originally disqualified by the Chief Judge after crossing the finish-line in second place in the men’s 20-kilometer race. After examining the video of the race and discussing with the Chief Judge, the Jury of Appeal decided unanimously that the mode of progression of the Spanish athlete did not merit a disqualification. This are the first attempts where the technology helped the judgment system in race-walking to improve the homogeneity.
An important evolution was the change of distances and race surface. Race walking was born with two races, 3.500 meters and 10.000 meters, both on track (Olympic events in 1908). After the issues happened during the Olympic Games of the 1924, race walking became a road event on the distance of 50 km. The track race on 10.000 meters was reintroduced in the two editions after the Second World War, but it was characterized by many issues and from the 1956 it changed again and it became a 20 km on the road (Schiffer, 2008). Nowadays, these distances (20 and 50 km) are the official distance race in the main international events. The races take place on the road surface in circuit with laps of 1 or 2 km.
The evolution of the rule and the increasing of the race distances aimed to help the judges in their work and to reduce the problems connected with the judgments. Indeed, the evolution of the rule, as previously explained, gives more detail to understand the correct technique. In addition, the IAAF developed specific courses and guidelines to improve judgment and to make it homogeneous. The increasing of the race distances caused a reduction of the speed and we can see from the literature that the Loss of Ground Contact (LOGC) duration is directly proportional to the velocity (Pavei G. C., 2014).
However, the race-walking even shows in its time life an increasing of the performance and the issues connected with the judgement continue.
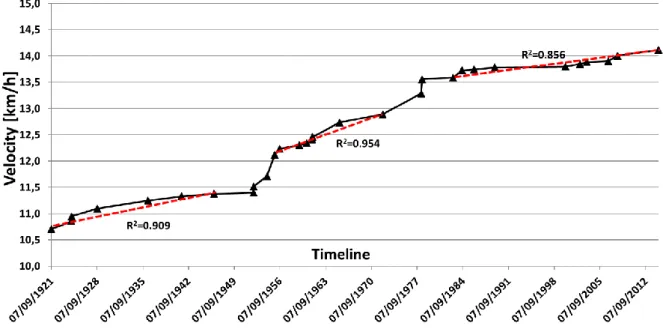
To assess the improvement of the performance in race-walking, according to Haake (Haake S. J., 2009), the first point is an analysis of the world record for the 20 km and 50 km
race-16
walking man (respectively Figure 3 and Figure 4). The 20 km and 50 km woman were excluded from the analysis because they are too younger in the official competition. About these data we can underline: (i) the world records start from 1912 (year of the official institution for the 20 km man), 1921 for the 50 km man; (ii) the world record does not include performances that were subsequently deleted due to the use of banned substances. In Table 2 the improvement of the world records is shown.
Table 2 Estimates of performance improvement index (∆Overall) in a specific interval of time (∆Time) for the main race-walking man race event.
20 Km Man 50 Km Man
∆Time [years] 107 97
∆Overall +66% +74%
In Figure 3 and Figure 4 we can see for each graph three linear trends, linked by two discontinuity points. The first one is the period after the Second World War and the second one the race-walking technical innovation by the Mexicans in the second half of 70s (Schiffer, 2008).
17
18
1.3 Infringements and performance in race-walking
The locomotor constraints related with definition of the race-waking have forced athletes to develop a characteristic pattern widely recognized as ‘race-walking cycle’ (Figure 5) (Di Gironimo G. C., 2016). In this figure is possible to identify four main events. The first one is the heel-strike event (1). It is the stage in gait in which the heel of the foot makes the first contact with the walking surface (not bending the knee). This is the instant with maximum antero/posterior deceleration, which depends on the position of the front leg. The front leg position is obtained as the angle in the sagittal plane between two segments: the first one is defined by joining the Center of Mass (CoM) of whole body with the point located in the projection of the malleolus to the front support; the second one is the vertical axis passing through the same CoM. This angle is called “Attack angle” (ATTang). The deceleration is
inversely proportional to the ATTang. The second event is the midstance event (2). It is the
instant when the CoM passes the vertical position. In the sagittal plane is possible to view the alignment of lower and upper leg. On the frontal plane (Figure 6), the race-walker’s pelvic obliquity is maximum, and it allows to reduce the elevation of the CoM vertical position. The third event is “the start of the propulsive action” (3). The foot is behind of the CoM, so the race-walker accelerates the body in the progression direction (Pavei G. C., 2014). The last event is the toe-off event (4). It is the instant of the last toe-contact with the ground during the stance phase (of gait), preceded by the forefoot loading and followed by the swing phase.
Figure 5 Highlights of a race-walking cycle: 1) the heel-strike event, 2) the mid-stance event, 3) the start of the propulsive action, 4) the toe-off event
19
In this instant, we can observe the push-off angle (POang) defined as the position of the rear
leg (pushing leg) at toe-off event. It is evaluated as the angle in the sagittal plane between two segments: the first one is defined by joining the CoM of whole body with the point located in the projection of the malleolus to the end of the rear support; the second one is the vertical axis passing through the same CoM. The antero/posterior acceleration is directly proportional to the POang.
Figure 6 Frontal plane in virtual view of a race-walker.
Related with the two commas of the definition of race-walking there are two possible infringements. The bent at the knee is a flexion of knee in the interval time between the heel strike event and the midstance event. For its assessment, the estimation of the flexion-extension of the knee is broadly recognized as a crucial parameter to evaluate the compliance of the athletic action with the rules of the competition. For a correct execution, as explained in the rule (c.f. section 1.2), the knee joint must indeed remain extended from the moment of the first contact with the ground (heel-strike event) until the passing through the vertical position (midstance). This stage lasts as long as about 35% of the stance phase (Dona, 2009). So, “the bent knee phase” lasts (in relationship of typical stance time for an élite race-walker) from 8 to 14 hundredths of a second (Pavei G. L., 2016). There is not a single reference value for the definition of straightened knee. Several studies provide different reference values for knee angles. Knicker and Loch (Knicker, 1990) consider knee joint as straightened for angles between -5° to 5°. Cairns et al. (Cairns, 1986) define it as
20
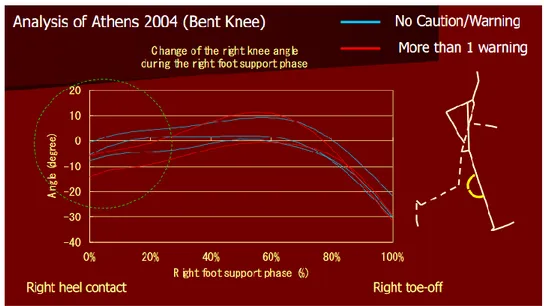
"hyperextended" for joint angles greater than -5°, while Hanley et al. (Hanley B. B., 2013) give the same definition for angles greater than 0°. In real race conditions they have found values between -6° and + 6° at the heel-strike event and values between -17° and 3° at midstance. In laboratory test (on treadmill) Pavei et La Torre (Pavei G. L., 2016) have found values between -2° and + 5° at the heel-strike event and values between -6° and +4° at midstance. Hoga and Ae (Hoga, 2009) have studied the judgment evaluation of the “bent knee” in a research study on the men’s 20-kilometer race during the Olympic Games in Athens (2004) (Figure 7). They carried out a comparison between the official summary of the race (i.e. the official document of the race where is possible to identify competitors, offenses, disqualifications and time of notifications) and the knee flexion-extension evaluation. For the last one they used a three-dimensional analysis with two video cameras (60fps). The analysis underlined the lacking correlation between the knee angle and the number of warning for bent knee. Indeed, it is possible to underline the presence of warning for race-walkers with a hyperextended knee and on the other side the case in which the support knee was a little bit bended and the athletes have not received any caution/warning.
Figure 7 Knee-flexion extension during the stance phase and related warning for bent knee
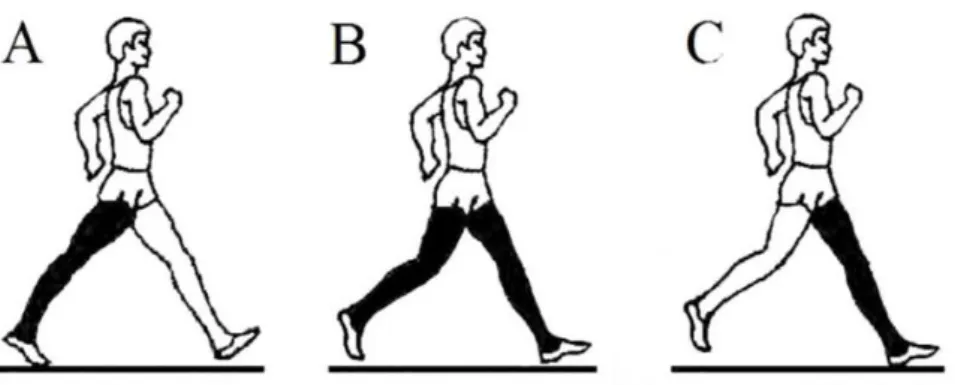
The second possible infringement is the LOGC. It is the time between toe-off event and the following heel strike event (Figure 8).
21
Figure 8 Temporal gait events: A) the toe-off and C) the heel-strike; B) shows a LOGC
The LOGC, of an élite race-walker lasts few hundredths of a second. Many studies were made to evaluate the LOGC of élite race-walkers in different conditions. In laboratory conditions with treadmills, using a motion-capture system analysis, a study on fifteen male race-walkers, divided into three groups (international, national and regional), has shown a range for LOGC values from 10ms up to 60ms (with average speed from 12.0 km/h to 18.0 km/h). In laboratory conditions without treadmills (Di Gironimo G. C., 2017), in our experimental tests with Italian national competition race-walkers we have collected LOGC between 10ms to 78ms. In training condition, a video-analysis study on sixteen international-level athletes, including ten men and six women, has shown a range for LOGC values from 30ms up to 45ms (with average speed from 12.0 km/h to 15.0 km/h) (DeAngelis M., 1992). Other works have evaluated the LOGC in race conditions: during 23th World
Race-walking Cup, in Cheboskary on May 2008, of three hundredths of a second for males in 20 km and of two hundredths of a second for females in 20 km and for males in 50 km (average speed of 14.5, 12.7 and 13.1 km/h, respectively) (Hanley B. B., 2013) (Hanley B. B., 2011). During the 25th World Race-walking Cup, in Saransk, on May 2012, the LOGC was evaluated
for medallists (both men and women) of the 20 km walk, and of the men’s 50km race-walk. The LOGC value was equal to 50ms for the male in the 20 km race, to 30ms for the female in 20km race and to 40ms for male ones in 50km race; the average speed of 15.2, 13.2 and 13.9 km/h, respectively (Hanley B. , 2013). All works underline the short duration of LOGC events. So, a proper identification of LOGC is very difficult due to human psycho-physiological limitations of vision.
22
Indeed, previous researches explain how people can perceive a movement in different ways (Claypool M, 2006) (Loschky L.C., 2005). Experimental tests on professional athletes of a first-person shooter have found that for refresh rates over 30fps (i.e. about every 33ms) the visual perception of the human eye does not show significant improvements (Claypool, 2007). On the other hand, the examination of limits of the visual resolution in natural scene viewing (Loschky L.C., 2005) has shown that the detecting image for human eye did not occur for fixations below 100ms. In addition, another study underlines that the human eye cannot accurately process an image if this does not persist for at least six hundredths of a second (Winter, 2005). This underline as it is not simple to define a quantitative limit of human eye where no visible loss of contact occurs.
In race-walking scenario, in the selection of judges for the IAAF Panel, eye exams are now required, to see if candidates have normal vision. But not much is asked about their ability to judge contact. In literature few data are available about judges’ ability. Researchers (Knicker, 1990) have studied the assessment of three judges about the race-walking technique. Each judge made 100 evaluations of step sequences observing the race-walker in a defined long observation area of 30 meters. Actions of race-walkers were simultaneously filmed with a standard video camera at 200fps. The study indicates a difficulty in recognizing LOGC shorter than 50 ms. This difficulty became evident also in race condition. Indeed, the analysis of the data in competition (25th World Race-walking Cup, in Saransk, on May 2012)
carried out by Hanley allows to make a comparison between the official summary of the race and the LOGC timing. Table 3 shows as with for same flight time (as well as LOGC) judges submitted different number of red cards for LOGC (Hanley B. , 2013).
In addition, other practical difficulties for the judges to assess the LOGC during competition are due to: (i) the restricted period of assessment available for them; (ii) the situation in which multiple athletes are close to each other’s (this often happens, especially during 20 km élite race) where it is very difficult for the human eye to pay close attention to two portions of the athlete’s body at the same time (Figure 9).
23
Table 3 Flight Time data (mean ± SD) and total red cards (loss of contact)
Flight Time (sec.) Red cards (~) 20 Km Senior Women 0.03 (± .01) 0
20 Km Senior Men 0.05 (± .01) 2 50 Km Senior Men 0.04 (± .00) 0 10 Km Junior Women 0.04 (± .00) 3 10 Km Junior Men 0.04 (± .00) 1
Figure 9 A picture of the men’s 20 km race-walking in the last Olympic Games (Rio de Janeiro 2016 - FIDAL - G. Colombo)
Thus, the race-walk judges know the biomechanics of race-walking, so that they may see loss of contact or a bent knee as it happened. Their judgments are based on biomechanical patterns. Starting from the recommendations for race-walking judges (Westerfield, 2007) (Di Gironimo G. C., 2016), some parameters characterizing an inefficient technique are:
- the interruption of the line “trunk-pelvis-pushing leg” (Figure 10.a): it is strictly related with POang and forward lean. If lean is emphasized it will most likely occur at
the waist, restricting forward hip rotation, reducing the horizontal component of acceleration (underlined by lower value of POang) and increasing the vertical one. The
24
of the CoM (without noticeable heel strike) the knee may even be bent. Indeed, it is very difficult to land flat without flexing the knee;
- the high value of the ATTang (Figure 10.b): it occurs when there is a restricting hip
rotation accompanied by too much emphasis on propulsion. Thus, hip flexion alone appears to move the legs and the step length is shortened. The race-walkers appear to bounce with each step and this has the effect to emphasize loss of contact. In extreme cases this inefficiency can lead the knee to be bent;
- high and tensed shoulders (Figure 10.c): they give the appearance of too much lifting of body mass which may be a precursor to possible loss of contact;
- too much knee lift (Figure 10.d): it has the effect to increase the vertical component of the CoM and emphasize the loss of contact. In addition, because of rapid leg swing it is difficult to dorsiflex the ankle enough before contact. In this case the foot lands flat and the knee can be flexed.
Figure 10 Biomechanical warnings for the judging of infringements in race-walking
Nowadays, the competition rules allow the judges to give the race-walker a yellow paddle (as a warning) when the athletes are going to break the rule. Two different symbols are associated with the two infringements (Figure 11). Each judge can give an athlete an only paddle for each infringement (Figure 12.a). Instead, the judge gives a red card (as proposal for disqualification) when he is sure of the race-walker’s infringement (according to IAAF recommendations that said to give a red card only when the athlete continues to break the rules of race-walking, not only for a step). All the proposals of disqualification are recorded and showed on electronic board (Figure 12.b). If three different judges submit a red card, the athlete is disqualified. The disqualification is given the athlete from the chief judge
25
showing him a red paddle (Figure 12.c). In addition, in the race-walking competition rules a new power for chief judge has been introduced since 2001. He has the power to disqualify race-walkers in the last 100 meters of a race (when the race-walker’s mode of progress obviously fails to comply with the definition).
Figure 11 In a) a bent knee (with a flexion of knee before the vertical upright position); c) a LOGC picture. In b) the symobols associated with the two infringements (“<” bent knee and “˷” LOGC)
Figure 12In a) a race-walker received a yellow paddle; b) a picture of the electronic board with the red cards associated to the different race-walkers; c) a disqualification in competition of a race-walker
In the described context the judgment evaluation of the infringements is not easy for the judge. So, the event of a missed or incorrect disqualification is possible and it could generate controversies which can be devastating to the individual athlete. However, the LOGC is the most critical and issued infringement. Nowadays, the LOGC represents the main infringement given to an élite race-walker. Figure 13 shows an overview of the proposal of disqualification in the last main international events. Here we can see that approximately 60% of red cards were caused by a LOGC, with a peak of over 80% in the men’s 20km race
26
(Caporaso T. P., 2018). In addition, although there is not a quantitative definition for both infringements, the possibility to define the “visible LOGC” appear simpler than the definition “straightened knee” that is strictly connected with the race-walker’s anthropometrical characteristics.
Figure 13 Percentage of red card for LOGC related to men’s 20 km, women’s 20 km and men’s 50 km and an overall during the last three edition of World IAAF Championship (Moscow 2013, Beijing 2015 and London 2017) and last edition of Summer Olympic Games (Rio de Janeiro 2016) and an overall of the four competition. On the other side, reaching the best performance while avoiding disqualification is the main goal of every professional race-walker. So, the results underline a continuous increasing of the performance as shown in the analysis of the mean velocity of world record on the 20 km race–walking in the last 107 years (Figure 3). The literature underlines the correlation between performance and kinematic parameters. Pavei et al. (Pavei G. C., 2014) pooled together data from eleven different studies, showing a linear descriptive equation between the Step Cadence (SC), Step Length (SL) and the walking speed. Although in élite race-walkers the importance of SL on race-walking velocity appears greater than SC, it should be noticed that there is a limit on how much SL can be increased before achieving dangerous SC value. Furthermore, increases in SL might be achieved through longer LOGC. The ability of
27
the best race-walkers is to achieve the optimal SL and SC (with a legal LOGC) (Hanley B. , 2013).
Additional parameters are the values of the ATTang and POang. These parameters are very
interesting because they provide an immediate measure to evaluate the braking and the propulsive phases (Di Gironimo G. C., 2016). In facts, the technique used by race-walkers to increase their speed involves high push-off angles and low attack angles. A possible parameter taking into consideration these two elements is the smoothness on the anterior/posterior component. It allows to evaluate the homogeneity of the acceleration pattern that is related with the ATTang (determining the deceleration at the heel strike event)
and POang (influencing the acceleration profile at the toe-off event). Indeed, studies show
that it significantly improves when the athlete's performance level increases (Choi, 2014). In addition, Gomez-Ezeiza et al. found significant relationships between race-walking economy (the oxygen cost defined as the steady-state oxygen uptake at a given submaximal speed) and certain biomechanical factors (i.e. velocity, LOGC) (Gomez-Ezeiza, 2018). This is important because this kind of metabolic evaluation is lacking practicality in daily training while main biomechanical factors are simpler to collect.
28
1.4 Race-Walking stakeholders
The race-walking world is composed by several features (see Figure 14). The main protagonists of the system are the athletes, “sport cars” and leading actors of the race, the coaches, “chief technical officers” of the athletes’ team, and the judges, guarantees of the regularity of the race. Secondary players, but however important part of athlete’s team, are the medical staff (physician and physiotherapists) and biomechanical researchers. The first ones guarantee the “maintenance” of the athlete-car in order to treat and prevent possible damages (injuries). The second ones are the managers of the research and development part of the athletes’ team. They study the biomechanical pattern of the athlete in order to suggest possible solutions to improve performance and to reduce the risk of injuries. All of them are part of the national (i.e. single National Federation) and international (i.e. IAAF) institutions. The institutions’ role is the organization of the race events at different (national and international) levels. Finally, hidden actors are the producers, that develop specific equipment or sensor devices for data collection about the athlete-car.
All the previous features are interested in having new tools for the monitoring of the gesture in training and competition scenarios. Athletes are interested in having objective feedback about their performance and technique. Coaches are interested in having key indicators of the performance and infringements of athletes useful to design new customized strategies to optimize the training and competitions. Judges are interested in having useful tools to assist their evaluation of infringements in competition scenario. The institutions are interested in the definition of a competition system for the evaluation of LOGC, in order to reduce the issues connected with the judgement and to improve the outside credibility of the race-walking. The IAAF with its Race-walking Committee would perform this system in order to draw up a rule change proposal (IAAF).These tools are interesting also for the other components of the race-walking-world: medical staff is interested in the comprehension of the athlete’s biomechanical pattern; the researchers are interested in having more field data useful for the comprehension and the modelling of race-walking biomechanics. The producers are interested in the development and in the sale of an innovative device for the evaluation of performance and infringements.
29 Figure 14 Race-walking stakeholders
30
1.5 Technology in Race-walking
As explained in paragraph 1.3, measurements and monitoring both for performance and infringements assume an important role in race-walking, in particular for élite athletes. Although in the race-walking world coaches and athletes even use subjective measurements (i.e. tools for the physical status and performance evaluation of the athletes, like the Rate of Perceived Exertion defined by Borg, offering a range from 0 to 10 for rating the perceived exertion during physical activity) (Borg, 1982) (Hanley B. , 2015), most of the biomechanics studies are based on objective measurements to evaluate performance and infringements. In this second category there are several different output data (Tao, 2012):
kinematic (K): “study of motion” (i.e. temporal/spatial parameters, accelerations, angular velocity, range of motion of joint angles). In order to collect these data, possible technologies available are: accelerometers, inertial sensors, high speed cameras, optical systems;
kinetic (KIN): “study of musculoskeletal internal loads” (i.e. joint torques and ground reaction force). In order to collect these data, possible technologies available are: platforms of force, insole systems;
electromyography (EMG): “study for evaluating neuromuscular activity “. It gives an added value in the interpretation of the kinematic and kinetic data useful for the estimation of muscle force. In order to collect these data, possible technologies available are: electromyography surface probes and electromyography intramuscular probes.
In addition, other useful measurements are physiological data (i.e. metabolic data such as heart rate data, lactate measurement and Maximal Oxygen Consumption). Overlooking studies about the only physiological measurement, Table 4 shows the issues about race-walking biomechanics published in the last 5 years (period from the last literature review (Pavei G. C., 2014)). We collected 45 studies (about 60% based on kinematic analysis, the others even using the kinetic one).
31 Table 4 The biomechanical studies of race-walking in the last five years
Authors Year Type of analysis N subjects Total Subjects Performance Level Equipment Scenario Sample Frequency N trials collected; speed
(Hanley B. B., 2013) 2013 K 5M 5F 5JM 5JF 20 I 2P; 1V LTO 1000 Hz (P); 100 Hz (V) 3Tr: 1St; Sp: SB (J: 10km; MF: 20/50 km): M: 3.79 ± 0.11 m/s; F: 3.47 ± 0.25 m/s. (Lee, 2013) 2013 K 5M 2F 7 N V, S TT 125 Hz (V); 100 Hz (S) 3Tr: 4.65m; 3Sp. (Padulo J. A., 2013) 2013 K 12M 12 EN 1V LT 210 Hz 3Tr: 200St; Sp: 3.5–3.3– 2.9m/s; Sl: 0–2–7%. (Padulo J. A., 2013) 2013 K 12M 12 E 1V LT 210 Hz 9Tr: 200St; Sp:3.61–3.89– 4.16m/s; Sl: 0–2–7%. (Smith, 2013) 2013 K 10M 10 N; I 2P, V LT 1000 Hz (P); 250 Hz (V) 1Tr: 30''; 103% RP 10 km (SB); mean Sp: 3.53± 0.18 m/s.
32 (Song Q. D., 2013) 2013 K, KIN 9M 5F 14 E P, 3V LO 50 Hz (V) 5Tr: 1St; tr Sp. (Chwała, 2014) 2014 K 12M 12 I C LT 120 Hz 7Tr: 3’; 6Sp: 2.77-3.05-3.33-3.55-3.89-4.17, then 1% Sl. (Hanley B. B., 2014) 2014 K 20JM 20JF 40 I 2V RC 50 Hz 1Tr: 5.20 m; 2St (1l-1r); mean Sp: M 3.71 m/s, F 3.22 m/s. (Preatoni, 2014) 2014 K 15M 15 I; N; R 6C LT 300 Hz 40St; Sp: 4.17 m/s. (Sovenko, 2014) 2014 K 9F 9 N V RC 25 Hz 50Tr; Sp: 3.32±0.15 m/s. (Dolenec, 2015) 2015 KIN 1F 1 N P LO 1000 Hz 20Tr: 1St. (Hanley B. , 2015) 2015 K, KIN 9M 5F 14 I P, V LT 1000 Hz (P); 250 Hz (V) 4Tr: 30”; 103% RP 10/20 km, Sp: 3.44 ± 0.21 m/s.
33 (Hanley B. B., 2015) 2015 K, KIN 10M 7F 17 I 2P, V LTO 1000 Hz (P); 100 Hz (V) 3Tr: 1St; 97-103% RP 20/50 km. (Padulo J. , 2015) 2015 K 12M 12 N V LT 210 Hz 100St; Sp: 3,56±0.17. (Pavei G. S., 2015) 2015 K, KIN 1M 1 T P; 8C LT 900 Hz (P); 300 Hz (C) 9Tr: 1’; Sp: 2.22-2.50- 2.78-3.06-3.34-3.62-3.90-4.17 m/s. (Song Q. X.,
2015) 2015 K, KIN 20M 20 R IP; TP TT 126 Hz (IP)
2Tr: 10St; mean Sp 3.5-3.8 m/s. (Cazzola, 2016) 2016 K 15M 15 I; N; R 6C LT 300 Hz Tr: 60'', 40St; 2Sp: 3.33 and 4.30 m/s. (Cronin, 2016) 2016 K, EMG 5M 6F 11 N; I V LT 100 Hz 2Tr: 3-6St; 2Sp: 2.78 m/s and RP 10/20Km (3.03-3.83 m/s). (Di Gironimo G. C., 2016) 2016 K, KIN 1M 1 I 8P; 10C LO 680 Hz (P); 340 Hz (C) 10St (l and r); mean Sp: 2.94 m/s.
34 (Di Gironimo G. C., 2016) 2016 K 1M 1 I V; S RT 240 Hz(V); 200 Hz (S) 4Tr: 90St; 4Sp. (Forczek, 2016) 2016 K, EMG 1F 1 N IP TT - 5Tr: 10'', 6-8St. 5Sp: 2.5-3.03-3.36-3.77-4.30 m/s. (Hanley B. B., 2016) 2016 K, KIN 11M 8F 19 I 2P; V LTO 1000 Hz (P); 100 Hz (V) 3Tr: 1St; 97-103% RP 20/50 km. (Harrison, 2016) 2016 K 7TM 11TF 14NM 2NF 34 T; B O; V RT 1000 Hz (O); 300 Hz (V) 6-10Tr: 8 m; Sp: 1 - 3.56 m/s. (Ito, 2016) 2016 K, KIN 3 3 T 2P; 12C LO 1000 Hz (P); 200 Hz (C) Sp: 2.98±0.31 m/s. (Norberg J. S., 2016) 2016 K, KIN 12F 3M 15 T; A 2P LO 1000 Hz 3Tr: 1 St; mean Sp: 2.3 m/s. (Pavei G. L., 2016) 2016 K 15M 15 I; N; R 6C LT 300 Hz 17Tr max: 60'', 40St; Sp: 2.77-5 m/s (+0.14 m/s/Tr).
35 (Sawamura, 2016) 2016 K 16J 16 B V RC 60 Hz 1Tr: 1St; Sp: 2.4-3.4 m/s. (Wang, 2016) 2016 K 11M 11 A 8C, V LT 200 Hz (C); 200 Hz (V) 10Tr: 6”, 3St; 2x5Sp: 0.55-1.11-1.66-2.22-2.77 m/s. (Alvarez, 2017) 2017 K 3M 2F 5 - O; V LT 1000 Hz (O); 1000 Hz (V) 3Tr: 20''; 3Sp: 3.33-3.61-3.89 m/s. (Barreto Andrade, 2017) 2017 K 4M 4F 8 N 2V TT 25 Hz 6Tr; RP, mean Sp 3.20 m/s. (Di Gironimo G. C., 2017) 2017 K, KIN 3M 1F 4 N 8P; 10C; S LO 680 Hz (P); 340 Hz(C); 200 Hz(S) 1St. (Hanley B. B., 2017) 2017 K, KIN 10M 7F 17 I 2P, V LTO 1000 Hz (P) 100 Hz (V) 3Tr: 1St; Sp: 97-103% RP 20/50 km. (Hanley B. B., 2017) 2017 K, EMG 5M 5F 5JM 5JF 20 I V; EMG LTO 100 Hz (V) 1000 Hz (EMG) 3Tr: 1St; Sp: 97-103% RP (SB).