11 March 2021
ALMA MATER STUDIORUM UNIVERSITÀ DI BOLOGNA
SCHOOL OF ENGINEERING & ARCHITECTURE
DICAM
(Department of Civil, Chemical, Environmental and Material Engineering)
Transportation and Road Safety Engineering
MASTER THESIS
In
Impact on Transportation During Covid-19 Crisis and
Road Safety Measures in Pandemic
Academic Year 2020/2021
Student SUPERVISOR
Shaik Mohammed Soban Prof. Ing. Andrea Simone
Matricola : - 0000850453 CO-SUPERVISOR
Dott. Ing. Cludio Lantieri
Dott. Ing. Navid Ghasemi
❖ Abstract :-
The briefing to know how countries are facing problems during pandemic
an overview on the state of play trends of urban transport since the outbreak of the
COVID-19 pandemic. It results four scenarios, the prevalence of one or the other
depending on the priorities Settled by policy makers and assistance advisers. The
guidelines deliver general suggestions for a post-COVID-19 smart and sustainable
urban transport mobility and a set of desirable actions on how to integrate EU
response into existing strategy priorities.
Against the crisis of a continuously changing environment, the aim of
this paper is to discuss the impact of COVID-19 crisis in Italy, the government
response to cope with the crisis and the major lessons learned during its managing
in pandemic. The analysis data to observe how Italy’s faced response has been
characterized by some rapid measures to implement the health crisis, but few plans
in the mitigation stage and a push back of community involvement. This contribution
pressure and its importance of a cultural shift, through the effort to apply in practice
the principles already indicated in the main global policy frameworks to guide
disaster throughout the country. A community social development approach can help
The Italian Authority has decreed a series of continuous limitations to
delay the COVID-19 pandemic spreading in Italy since March 10, 2020, including
limitation in person-to-person mobility and the closure of social, cultural, economic,
and industrial activities. Here we show the lockdown consequence in Northern Italy,
the COVID-19 most affected area, as revealed by noise variation at seismic stations.
The reaction to lockdown was slow and not homogeneous with spots of minor noise
reduction, especially in the first week. A fresh interpretation of seismic noise
variations in terms of socioeconomic indicators sheds new light on the lockdown
efficacy pointing to the causes of such delay: the noise reduction is significant where
non planning activities prevails, while it is small or negligible where dense
population and strategic activities are present. These results are key for analytic
interpretation of the pandemic transmission and the effectiveness of differently
targeted political actions.
❖ Table of Contents:-
Chapter-11) Introduction --- page-1 1.1 ) Worldwide covid-19 pandemic impacted to cause travel issues. ---page-2 1.1.1) Importance of Transportation. ---page-2 1.1.2) Worldwide Safety for Travelers---page-3 1.1.3) Safe travel tips during COVID-19 ---page-4 1.2) Risk-based stages for mitigation measures ---page-5 1.2.1) Useful steps to be advised while travelling in air ---page-5 1.2.2) Coronavirus Impacted on Transportation of EU in pandemic ---page-7 1.2.3) A coordinated approach to measures restricting free movement in the EU ---page-7 1.2.4) How are my free movements rights protected when travelling in the
EU during pandemic. ---page-7 1.3) Future of Transport: Update on the economic impacts of COVID-19. --- page-8 1.3.1) 1Direct impacts on transport and. Mobility. ---page-8 1.3.2) Change in mobility demand patterns. ---page-9 1.3.3) Health and safety measure ---page-11 1.3.4) Impact on Innovation ---page-12 1.3.5) Public policy priorities ---page-13 1.3.6) Policy Options ---page-13 1.4) Milan announces ambitious scheme to reduce car use after lockdown. ---page-13 1.4.1) Coronavirus-hit Lombardy city will turn 35km of streets over to cyclists and pedestrians. 1.4.2) Generating new road plans for use daily users. ---page-16 Conclusion ---page-17
Capter-2
2.1) In COVID-19 crisis reduction of Transportation in Asia. ---page-18 2.2) How COVID-19 is Changing Travel Demand and Mobility Patterns in Asia ---page-19
2.3) Urban Transport ---page-20 2.2.1) Impact on the Environment, Road Safety, and Economy. ---page-21 2.2.2) Climate Change and Air Pollution. ---page-21
2.2.3) Impact on Road Safety ---page-22
2.2.4) Impact on the Economy ---page-22 2.2.5) Exit Strategy for Lockdown in Asia. ---page-23 2.2.6) Good Practices for Enhancing the Resilience of Transport Services---page-24 2.2.7) Public Transit ---page-24
Conclusion ---page-25 Chapter-3
3) COVID-19 redefines public transportation in India---page-26
3.1) Introduction ---page-26 3.2) Characteristics of Sample set---page-26 3.3) Public Transport hits a roadblock post-lockdown---page-27
3.3.1) Passenger Travel Demand ---page-28
3.3.2) Share of Transport Modes Before COVID-19 ---page-28 3.3.3) India mobility modal shift post covid-19 crisis---page-29 3..3.4) Overall stated modal share for the sample pre and post COVID-19---page-31 3.3.5) Sample Characteristics and changes in Modal Shift---page-32 3.3.6) Distance travelled---page-32 3.3.7) Household income---page-33 Conclusion---page-33
Chapter-4
4) Covid-19 PIARC’S responses on roads and transport sectors---page34 4.1) About PIARC ---page=34 4.2) The Roads and Transport sector---page-35 4.2.1) PIARC point of view of the covid-19 pandemic---page-36 4.2.2) Global incidence of covid-19---page-36 4.2.3) Impact of Mobility---page-37
4.3) National and localized lockdowns, curfews and other restrictions have had a direct impact on mobility which remains below pre-pandemic level---page-38
4.3.1) Framework for the key stages of the pandemic---page-38 4.3.2) Overall PIARC covid-19 response---page-40
4.3.3) Maintaining Road Inspection and Surveillance---page-42 4.3.4) Maintaining Traffic Control---page-42 4.3.5) Technology and road network operations---page-43 General Overview on Road Network Operations During the Pandemic----page-43 Conclusion---page-43 Chapter-5
5) Road Safety Measures for Users ---page-45 5.1) Human Factor ---page-46 5.2) Perception ---page-47
5.3) Optical illusions ---page-47 5.4) Curve radius illusion ---page-49
5.6) Contrast and light conditions---page-49 5.6.1) Background problem ---page-49 5.6.2) Audible and visible cues ---page-50
5.6.3) Age group (needs of older drivers) ---page-51
5.7) Focus, Peripheral vision, and Driver’s field of view ---page-51
5.7.1) Speed and distance estimation ---page-52
5.7.2) Orientation and anticipation ---page-52 5.7.3) Human contribution to road accidents ---page-53
5.8) Controlled Zebra Crossing ---page-54
5.9) Raised crosswalks ---page-55
Conclusion ---page-56
Chapter - 6
Methodology ---page-57 6.1) Mobile Eye XG (ASL) ---page-57 6.1.2) Instrumentation and installation ---page-57 6.1.3) Anatomy of the human eye ---page-59 6.1.4) Eye vision of the human ---page-61
6.2) Eye Vision software---page-63 6.2.1) Position the Eye Image---page-63 6.2.2) Corneal Reflection (CR) Spot Recognition---page-63 6.2.3) Pupil Recognition---page-64 6.2.4) Scene Calibration---page-64 6.2.5) V-BOX & Instrumentation---page-65
Chapter-7
7.1) Case Study and Data analysis with Results ---page-67 7.2) Pedestrian crossing characteristics ---page-69 7.3) Execution of experiment ---page-71 7.4) Design calibration ---page-72 7.4.1) Results ---page-73 7.4.2) Camera Frame by frame analysis ---page-73 7.4.3) In case of attention-distraction analysis ---page-77 7.4.4) V-BOX and circuit tools functioning ---page-78 7.4.5) Perception at braking distance of 55 meters ---page-79 Conclusion ---page-81
List of figures ---page-82 List of Tables ---page-84 List of Graphs ---page-85 References ---page-85
1 | P a g e
Chapter-1
1) Introduction
The effect of Coronavirus on urban mobility has long enduring consequences. In more detail, the focus of this section is to examine how Covid-19 discipline measures changed people’s habits in reaching urban places and services, thus control the mobility subsystem. Urban system mobility is very composite and depends on several factors, primarily on it’s ways users move around the cities (walking, cycling, by buses or underground), on the level of easy reach to a place and the organization and structure of the public transport supply. The spread of the virus varied across areas, with the most majority of cases concentrated in some of the richest and most industrialized regions of the North, those with the most advanced health systems. As per 1 April 2020, Lombardy experienced 44,733 cases and 7,539 deaths. In Veneto, the corresponding values were 9,625 and 499. A community-based approach in Veneto, with extensive contact tracing and more rapid testing appears to be associated with substantially reduced rates of cases, hospitalizations, deaths, and infection compared with the hospital-centered approach in Lombardy. The regional government took action to strengthen its ability to trace the contagion, by starting to independently produce the chemical reagents needed to process thousands of swabs. There are 8 public health prevention departments in Lombardy (1 per 1.2 million), compared with 9 in Veneto (1 per 0.5 million). In Lombardy, 51.5 per cent of the patients were admitted, including 5.2 per cent to intensive care units. In Veneto, the corresponding figures were 25.1 per cent and 4.3 per cent, respectively.
While urban areas can enable access to important social and economic opportunities, they have also brought about new challenges related to traffic overcrowding, air- and noise pollution, and ineffective transport systems. The shift towards smart and more livable cities therefore places a particular responsibility on the transport sector, which accounts for a quarter of the Union’s total greenhouse gas discharge and which is a significant supporter to health-damaging pollution in cities.
In the hard-hit Italy, public transport ridership has seen decreases in the range between 80% and 90% in every major cities. In the short-to medium-term the most urgent priorities will therefore be to address the economic viability of the affected businesses across the industry as well as to make certain the safety of the travelling public once lockdown measures have been phased out.
2 | P a g e
1.1) Worldwide covid-19 pandemic impacted to cause travel issues. 1.1.1) Importance of Transportation.
Transportation is divided into private and public transport. An important distinction to reach in time must have to choose type of transport is mode of transport. In an urban context, the most relevant modes of transport will typically operate under transportation objects like Road network, Air ways, Rial ways etc.
Transport is important because it enables communication, trade and other forms of exchange between people, that in turn establishes civilizations. Transport plays an important part
in economic growth and globalization, but most types cause air pollution and use large amounts of land. Good planning of transport is essential to manage traffic flows and restrain urban sprawl. Yet, transportation is generally very vulnerable for security threats. It is an attractive target because of its importance in society and the presence of large amounts of people or crowds. High quality transport links ensure that communities can access basic services, facilities, and employment opportunities. The connectivity provided by such links promotes social inclusion, can reduce social isolation, and enhances quality of life.
3 | P a g e
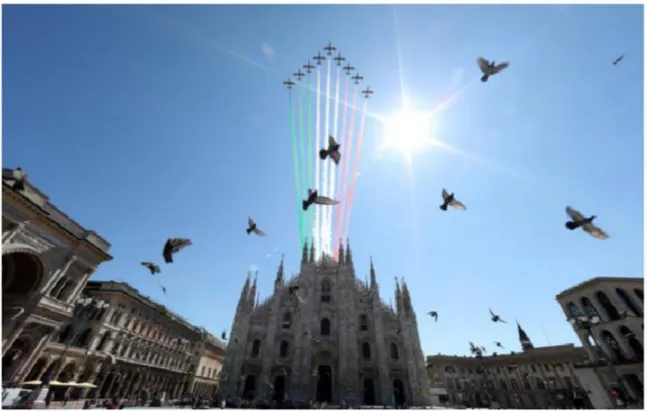
The COVID-19 crisis in Italy has uprooted life in the country and prompted emergency measures at a level not seen since the war. Some images from Italy under lockdown will be difficult to forget.
Italy was the first European country to be hit by the coronavirus back in February, and the first disruptions to normal life seemed monumental. A polemic arose between those determined for life to continue as normal, and those more cautious about the potential effects of the virus. Images from the final days of Venice Carnival before it was canceled, express the opposing mindsets as carnival-goers in elaborate masks juxtaposed tourists already donning protective face masks.
1.1.2 Worldwide Safety for Travelers.
• While COVID-19 cases continue to rise and fall around the world, some countries have opened their borders to travelers. The European Union Council has released a series of recommendations on travel restrictions within the EU, as well as from a select number of countries outside the EU. This map offers the latest EU COVID-19 travel data and guidelines. In
recent months, new surges in cases, Fig-2 During Lockdown safety travel throughout the world.
new variants of the virus have caused some nations (in Europe and elsewhere) to tighten their entry requirements again.
• The United States is not currently on the list of nationalities the EU has recommended allowing in (as of October 22). However, a few European countries and several countries outside Europe are welcoming US visitors, including the Maldives, Tanzania, Ecuador, Costa Rica, French Polynesia, Egypt, Turkey, Thailand, a number of Caribbean nations, and Mexico. New Zealand has also considered creating a “travel bubble” where it would open its border to travelers from Australia and vice versa.
4 | P a g e
An increasing number of countries are now requiring proof of a negative COVID-19 test before travelers depart their own country or upon arrival. Those who test positive on arrival may be required to quarantine (and some countries require all travelers to undergo a period of quarantine, whether it is not they provide a negative test result).
Despite these precautions, COVID-19 has not gone away – it remains a serious risk throughout the world. But the desire to travel has not gone away, either. Recent news of COVID-19 vaccines being rolled out has caused a surge in travel bookings. Yet it will be several months before those vaccines are widely available, and even longer before large proportions of the population can be considered immune.
1.1.3) Safe travel tips during COVID-19.
Preventing the spread of COVID-19 is a shared responsibility. Millions of people are dependent on tourism for their livelihoods – but opening their doors puts them and their fellow citizens at risk. So, if a country welcomes you, the decent thing to do is to comply with its requirements, not present it with a new outbreak.
• Wear a mask on your flight and wherever requested at your destination. If there are few
restrictions at your destination, you should strongly consider wearing a mask in public anyway. Studies have shown that masks help prevent the spread of COVID-19, and the more of us who wear them, the better. According to WebMD, "N95 masks are the most protective masks, followed by a three-ply surgical mask, then a fabric mask."
• Wash your hands thoroughly and regularly, avoid touching your face. While washing with
soap and water is the most effective way to avoid getting sick, it's also wise to carry hand sanitizer for situations where washing hands may not be possible.
• Practice social distancing – maintain distance of 1m or more from people outside your own household/other than your immediate travel companions.
If you've received two doses of the COVID-19 vaccine, great! However, you still need to wear a mask and social distance. It's not yet known whether getting the vaccine prevents those who've been vaccinated from spreading the virus to others, even if they don't get sick themselves.
5 | P a g e
1.2) Risk-based stages for mitigation measures
1.2.1) Useful steps to be advised while travelling in air.
Resumption of higher volumes of passenger air travel will be dependent on number of factors, including foremost public health agency guidelines (driven by travel risk levels), governmental travel restrictions and requirements, passenger confidence, and air carrier and airport operational capacity.
A risk-based approach will enable the transition between stages of restarting operations and the adjustment of mitigation measures based on risk, while recognizing that reverting to previous stages may be necessary. The goal is to maximize consistency and develop criteria for data reporting and the monitoring processes in support of evaluation and progression to the next stage(s). It is currently not feasible to provide any specificity of timing between these stages. At the time this document was published, most of commercial passenger aviation was in Stage 0 or 1.
Stage 0:
A situation with travel restrictions and only minimal movement of passengers between major domestic and international airports.
Stage 1:
Initial increase of passenger travel. This initial stage will coincide with relatively low passenger volumes, allowing airlines and airports to introduce aviation public health practices appropriate to the volume. There will be significant challenges as each stakeholder community adapts to both increased demand and the new operational challenges associated with risk mitigation. Health measures for travel required at airports will need to, at a minimum match those from other local modes of transport and infrastructure.
6 | P a g e
Stage 2:
As health authorities review the applicability of measures based on recognized medical criteria, passenger volumes will continue to increase. Several measures that were required in Stages 0 and 1 may be lifted. Health measures for travel required at airports will need to match those from other local modes of transport and infrastructure.
Stage 3:
This stage may occur when the virus outbreak has been sufficiently contained in a critical mass of major destinations worldwide as determined by health authorities. The reduction of national health alert levels and associated loosening of travel restrictions will be key triggers. Risk mitigation measures will continue to be reduced, modified, or will be stopped in this stage. There may not be effective pharmaceutical interventions (e.g. therapies or vaccines) commonly available during Stage 3, but contact tracing and testing should be readily available. Until specific and effective pharmaceutical interventions are available, States may need to continue to loosen or reinstate public health and social measures throughout the pandemic.
Stage 4:
This stage begins when specific and effective pharmaceutical interventions are readily available in most countries. There may be a set of residual measures/mitigations that could be retained, although these should also undergo a periodic review process.
7 | P a g e
1.2.2) Coronavirus Impacted on Transportation of EU in pandemic
1.2.3) A coordinated approach to measures restricting free movement in the EU
EU citizens have the right to free movement within the EU. At the same time, the current pandemic has led to various restrictions across the EU. To provide clarity to citizens and make their lives easier Member States have agreed to improve their coordination. They will share the latest epidemiological data with the European Centre for Disease Control which will publish a map of Europe (also including data from the Schengen Associated States), updated weekly, in a variety of colors depending on the risk in a given region.
Fig-3 Restriction zones called by EU with different colors.
There will be no restrictions if you are travelling from a "green" region. When travelling from an "orange" or a "red" region, national governments may ask you to get tested or undergo quarantine. Governments will give clear and timely information before they introduce such measures.
1.2.4) How are my free movements rights protected when travelling in the EU during pandemic.
8 | P a g e
2) you are always allowed to go back to your member state of nationality or residence. 3) you should not be discriminated against.
4) any measures restricting your free movement must be proportionate, but you should not -in principle – be refused entry.
5) if you travel of an essential function or need, you will not be required to quarantine.
1.3) Future of Transport: Update on the economic impacts of COVID-19. 1.3.1) Direct impacts on transport and.
Mobility.
Traffic and transport operations are the reflection of the social and economic activity. During the pandemic, the measures applied in order to limit the propagation of the disease resulted in extensive mobility restrictions with a pronounced impact on most transport modes.
Graph-1 Change in Transportation Activity EU27.
Air transport is the most affected sector, with more than 90% of programmed flights in EU27 cancelled. Passenger car traffic decrease by 60% to 90%, while public transport and passenger rail decreased by more than 50% in most Member States. The freight sector was more resilient, since supply chains were mostly kept open to support the continuing productive operations. Nevertheless, the pause in non-essential activities in some Member States and the decrease in retailing had a visible impact in certain segments of transport, Traffic and transport operations are the reflection of the social and economic activity.
During the pandemic, the measures applied in order to limit the propagation of the disease resulted in extensive mobility restrictions with a pronounced impact on most transport modes. Air transport is the most affected sector, with more than 90% of programmed flights in EU27 cancelled. Passenger car traffic decrease by 60% to 90%, while public transport and passenger rail decreased by more than 50% in most Member States. The freight sector was more resilient, since supply chains were mostly kept open to support the continuing
9 | P a g e
productive operations. Nevertheless, the pause in non-essential activities in some Member States and the decrease in retailing had a visible impact in certain segments of transport, distribution and logistics. Maritime transport and port traffic were affected by the reduction in the trade with China during the early phases of the pandemic but is showing signs of recovery. Demand for transport and mobility services will probably rebound once restriction measures are removed and activity gradually recovers. Nevertheless, the rate of recovery will vary across transport modes and Member States and will depend to a large extent on the speed of economic recovery, the cost of the measures to support it and the changes in the supply and demand of transport services as a result of the direct and indirect impacts of the pandemic. A clear picture of the full impacts will, most likely, not be possible before the end of 2021 and the repercussions will be probably still visible at least 3 years after the crisis. The main conclusion of the analysis was that the improvement of transport governance and the development of innovative mobility solutions with the engagement of citizens will be crucial to ensure that the future of transport is cleaner and more equitable than its car-centered present. The response to the COVID-19 pandemic and the recovery path in its aftermath can influence the evolution of the various factors and make the need for improved governance and innovativeness even more urgent.
1.3.2) Change in mobility demand patterns.
The pandemic crisis is already considered as one of the greatest shocks in the last 60 years, strong enough to modify future needs and social values. Several of the changes in personal priorities may persist in time, even after the eventual recovery. On one hand, social distancing has accelerated the adoption of technological solutions that help avoid transport. Teleworking, video-conferencing and other remote collaboration methods have long been seen as potential solutions for reducing transport demand.
The extensive adoption of such solutions by a large share of enterprises during the crisis will probably result in an increased share of employers and employees continuing to use them once the confinement measures are over. On the other hand, the increase in e-shopping during the crisis -as a response to limitations in retailing, risk aversion and social distancing- is also expected to be sustained in the future. Either as employees or as consumers, many individuals will limit trips that can be avoided through technology, or simply because they would consider them unnecessary.
10 | P a g e
Regardless of how soon the COVID-19 threat is over, the uncertainty concerning the possibility of new waves of the virus or other pandemics will remain in the near future and will probably lead to a higher risk aversion towards transport and travel. Apart from decreasing the trip frequency at individual level, the user preferences concerning transport modes and trip distances will also possibly change. As discussed in the JRC Future of Transport report, public transport is especially vulnerable to the changing trends in society and technology.
Emerging mobility technology and business models already threatened the role of public transport demand by shifting users to ride hailing services, shared mobility applications and micro mobility solutions (electric bicycles, e-scooters, etc.). In a post-pandemic situation, it is possible that a part of the population will avoid public transport due to disease transmission concerns and opt for more individualistic forms of mobility. Such behavior can shift demand back to private cars, biking (conventional or electric), micro-mobility and even walking. But probably favoring own vehicles as opposed to shared mobility options. “Sharing economy” services such as ride hailing, ride sharing, and other emerging Mass (Mobility as a Service) applications are therefore expected to face important viability problems as a result of the loss of income during the confinement period and the decreased demand afterwards. Air travel is the hardest hit transport mode. Its activity in the EU decreased by 90% during the pandemic and the high capital costs of airlines and airports make the survival of several actors questionable in the short term.
Trips in the 400 km to 1000 km distance band though will probably not be affected as much as the longer distance trips by air, and rail may benefit from the substitution effect of trips not released by air. However, trips that require indirect connections through intermediate stations or combinations of more than one transport modes are likely to be less attractive to travelers.
A potential economic slowdown would also affect overall demand and limit the development of the sector in terms of new investment and market opening. On the other hand, freight transport is more resilient to the direct impacts during the confinement period but very sensitive to the speed of the economic recovery. Production and supply chains maintained their operational capacity but can eventually be negatively affected by a drop in final and intermediate demand. However, the concerns raised during the pandemic may cause a deceleration of the globalization in supply chains to avoid future risks. Several countries and businesses will probably attempt to source their inputs from producers which are closer to them and cause at least a marginal decrease in the transport
11 | P a g e
intensity of their operations. E-commerce witnessed an increase in demand during the confinement period and will probably have a more important role in future consumption patterns.
The trends of digitization in logistics and distribution systems are therefore expected to continue reshaping urban and distance freight transport. The path to recovery for the transport sector depends on the strategy that will be followed in terms of the gradual relaxation of restrictions, the future operational rules that will affect the supply side and the rate of improvement of the general economic conditions. Figure 2 presents an initial estimate of the differential reaction of each transport mode, assuming that each mode reached minimum activity during the crisis and will gradually converge towards its baseline level. Changing mobility patterns and economic uncertainty would be, however, limiting factors in the medium term.
1.3.3) Health and safety measure
Most operators in both passenger and freight transport will be probably required to
improve their health & safety standards through the introduction of additional controls, disinfection procedures and additional protection equipment, e.g. improved High Efficiency Particulate Air (HEPA) filters. At least for the first months of the gradual return to normality, limits to the number and density of passengers and personnel in vehicles, vessels and aircraft (and stations, ports and airports) should be expected. Such measures will be necessary in order to minimize the potential spread of future waves of infectious diseases and -at least as important- to provide a sense of security to users. The drawbacks, however, would be the cost increase and service limitations for transport operators, and the added inconvenience for transport users.
12 | P a g e
Graph-2 Indicative scenario of transport activity recovery, JRC estimates (baseline=100)
1.3.4) Impact on Innovation.
Being the direct outcome of economic and social activity, transport and mobility should normally rebound in line with the speed of recovery back to normality. Apart from the direct impacts to transport demand from an economic slowdown, a lower investment in transport infrastructure, equipment and services may also affect the supply side. Public budgets will be channeled towards the post-pandemic crisis mitigation and the private sector may be facing liquidity problems, in both cases limiting the amounts available for transport related investments. The construction of transport infrastructure and the technology-led innovation in vehicle manufacturing are two sectors with a large economic impact in the EU that may strongly be affected by a financial crisis. In addition, lack of funding or risk aversion may limit the prospects of innovation in number of emerging technologies and applications in transport. These include the start-up ecosystem of new mobility options and business models or high uncertainty concepts such as the hyper-loop.
13 | P a g e
1.3.5) Public policy priorities.
How EU policy priorities will be re-orientated as a response to the post-pandemic
challenges will to a large extent shape how the transport sector will evolve. For example, maintaining the ambitions of the European Green Deal3 as part of the recovery measures can be a form of stimulating the EU vehicle manufacturing sector. At local policy level, it can be an opportunity to promote micro-mobility and clean transport modes to improve the environmental quality but also support innovation.
1.3.6) Policy Options.
Several operators, especially in air transport, will potentially require direct or indirect state support in order to maintain a level playing field while also ensuring the competitive position of EU operators at international level. Public transport and aviation are particularly vulnerable to the impacts of changing in user choices, worsening economic conditions and, tightening public budgets. State Aid rules will probably need to be updated and potentially take criteria such as preserving connectivity or minimum service into account. Health and Safety guidelines for all transport modes across the EU, including a time line for their application, are needed in order to ensure public trust and a uniform adoption by all operators.
They should address issues ranging from cleaning and disinfection standards to limitations to the allowed density of passengers across all types of publicly used transport mode. The European Green Deal priorities for mobility are compatible with a post-pandemic strategy for the transport manufacturing and service sectors.
1.4) Milan announces ambitious scheme to reduce car use after lockdown.
1.4.1) Coronavirus-hit Lombardy city will turn 35km of streets over to cyclists and pedestrians.
Milan is to introduce one of Europe’s most ambitious schemes reallocating street space from cars to cycling and walking, in response to the coronavirus crisis. The northern Italian city and surrounding Lombardy region are among Europe’s most polluted, to have also been especially hard hit by the Covid-19 outbreak. Under the nationwide lockdown, motor traffic congestion has dropped by 30-75%, and air pollution with it. City officials hope to fend off a resurgence in car
14 | P a g e
use as residents return to work looking to avoid busy public transport. The city has an announced the at 35km (22 miles) of streets will be transformed over the summer, with a rapid, experimental citywide expansion of cycling and walking space to protect residents as Covid-19 restrict ions are lifted. The road plan, announced on Tuesday, includes low-cost temporary cycle lanes, new and widened pavements, 30kph (20mph) speed limits, and pedestrian and cyclist priority streets. The locations include a low traffic neighborhood on the site of the former Lazzaretto, a refuge for victims of plague epidemics in the 15th and 16th centuries. Marco Granelli, a deputy mayor of Milan, said: “We worked for years to reduce car use. If everybody drives a car, there is no space for people, there is no space to move, there is no space for commercial activities outside the shops.
Fig-4In Milan roads the new track for cycle path along with pedestrians.
To limit the use of cars in view of the post Covid-19 reopening, Milan has a cutting-edge plan. It calls for wider pavements and an extensive network of new cycle paths, ensuring low-impact mobility and social distancing. The urban transformation works begin in the month of May.
15 | P a g e
Fig-5 Modal share in the Wuhan region, before and after the Coronavirus emergency. Source: from Fabio
Pasquali (Italy).
To forestall this danger, the Municipality has just launched the (Open Streets) plan, praised on Twitter by Greta Thunberg and highlighted by the British newspaper The Guardian as one of the
most ambitious urban projects in Europe in response to Covid-19. Starting in May and
scheduled for completion by the end of the summer, the plan calls for a whopping 35 kilometers of city streets to be modified to extend the network of cycle paths and pedestrian paths, all through low-cost interventions.
Fig-6 Bicycle ways of Milan in distance Kilometers.
“In Milan, public transport passengers will decrease from 1.4 million passengers per day to 400,000. We cannot accept them turning into a million cars”, explained the deputy mayor for mobility Marco Granelli. Open street eco-sustainable forms of transport that are alternatives
16 | P a g e
to cars (bicycles as well as e-bikes and electric scooters), includes reducing speed limits to 30
km/h and designating streets where pedestrians and cyclists have priority. Paris, Vienna, Barcelona, London,
Brussels, Milan. There is a common thread that, in this moment of global pandemic crisis, unites the policies of European administrations in terms of social distancing and safety. Cities must gradually return to normal, but with the use of public transport needing to be reduced by 75% due to the virus, they have avoid giving the “green light” to cars, which would bring traffic
and pollution back to the level of ten years ago. Fig-7 Pedestrian walk and bicyclic tracks.
1.4.2) Generating new road plans for use daily users.
In order to be able to implement the plan quickly the paths being created will be “signage-only”, defined not by curbs but by simple coloured lines on the asphalt, carved out next to the pavement by moving parked cars about a metre towards the centre of the roadway. Then they hope a growing number of citizens will convert to the use of bicycles and scooters, modes of transport that moreover are ideal in a flat city like Milan. Tax incentives like
those successfully implemented for
17 | P a g e
Conclusion
Many countries are effected by the covid-19 crisis that cause lot of loss to whole world
as a result the EU (European Union) region also has the problems in decrease the population due to pandemic a large number of deaths are taken places, every day rapid increase in new cases of covid-19 patients the virus was very new in the month of March so doctors work load is heavy to treat the patients to cure situation is in control by this condition after having positive symptoms the patients can’t breathe properly positive covid-19 should not travel or move out from they can for medical help.
Coming to the mobility and transportation reduction of vehicle on the road’s government implemented lockdown seriously everyone must follow the guide line given by the government or by the world health organization (W-H-O) precautions and everyone must consider their own safety measures person to person. By this reason, the people likely to travel by their private vehicle, there was fear in the people if travel through public transport there are many issues to keep and maintain the safety distance near around (1m) or in six feet distance must have to follow. Gradually the EU countries economy is reduced loss to transport industries and government logistic transport hits major loss in their business.
The above lesson we saw the example of the Milan (Italy) new lines are made on the pavement side by side to the road, the lines for bicycle way, pedestrian walk during lockdown it was easy process to create new construction work due to less very less traffic on the roads as the above pictures shows the bicycle liens and pedestrian walk. This work is done in many cities of Italy and throughout the EU countries. Now in this period in 2021 year the countries gradually reduction of the cases of covid-19 world is coming to stage of recovery period.
18 | P a g e
Capter-2
2.1) In COVID-19 crisis reduction of Transportation in Asia.
Transport has played a central role in the spread of the virus. It has also played a critical part in enabling frontline and essential workers to get to work during the pandemic. Will continue to represent an enabler in terms of supporting the different needs of the population throughout the different stages of recovery. The pandemic’s impact on passenger and freight transport has been profound. Mobility restrictions in response to COVID-19 have resulted in drastic changes
in travel behavior. Fig-9 Impact of COVID-19 on Transport in Asia and the Pacific
ADB = Asian Development Bank, COVID-19 = coronavirus disease.
Swift lockdowns across the globe forced all nonessential workers to work from home almost overnight, and schools to shift to e-learning. With the closure of brick-and-mortar shops and restaurants during the containment period, consumers flocked to online shopping and food delivery. The sharp reductions in economic activity have also curbed regional and national freight, transport activity. On the other hand, in many places, urban freight and logistics have prospered because of increased online shopping and food deliveries.
Some governments have launched financial stimulus measures in response to the COVID-19 pandemic. The transport sector is benefiting from these through financial support to the airline industry, the automotive sector, and public transit companies. In the case of repeated waves of transmissions, countries may fall back to earlier phases midway through the recovery and repeat the successive phases in the three-stage process. This is a stylized strategy; it is important to be aware that the actual response will vary between countries and cities, and between different transport subsectors within countries and cities.
19 | P a g e
In the response phase, travel is still expected to be limited, with the focus mainly on allowing essential workers to travel and enabling the shipment of goods. Measures include protecting transport staff and passengers, as well as frequent cleaning and sanitization. Complementing these, a robust system of contact tracing and health monitoring needs to be put in place.
2.2) How COVID-19 is Changing Travel Demand and Mobility Patterns in Asia
The pandemic has forced all transport users to reassess the necessity of their trips and resulted in temporary new travel patterns. At this point, it is hard to predict the extent to which these new behaviors will be sustained. It is probable that, even after lockdowns are lifted, work-from-home and e-learning arrangements will still be used more frequently compared with pre-COVID-19. This could change travel behavior and patterns, including the frequency and distance of trips.
including in Asia, imposed large-scale stay-at-home and quarantine notices, and implemented swift measures to move work and schools online, close recreational venues and public places, and ban large-scale events and gatherings. An overwhelming majority of economies have been affected, regardless of the extent to which restrictive measures were implemented—reflecting the high degree of interdependence among countries. Travel demand across all transport subsectors has fallen dramatically, with aviation the most severely affected.
20 | P a g e
2.3) Urban Transport
According to 10 June 2020, 26% of ADB (Asian Development Bank) members had recommended the closing of urban public transit systems and asked people to stay at home and 19% had a legal requirement to close urban public transit systems. About 56% of economies allowed urban public transit systems to continue operating with social distancing guidelines. The number of restrictions on urban public transit across ADB (Asian Development Bank) members peaked between mid-April and mid-May 2020 and has since gradually declined. On 10 June 2020, 19% still required the closure of urban public transit.
Public transit is on the path toward recovery in some cities. On 10 June 2020, public transit ridership was close to the January 2020 baseline trend in Asian cities such as, Ho Chi Minh City; City of Hong Kong, China; Fuji; Hiroshima; Kumamoto; Nagoya; Naha; Niigata; Okayama; Otsu; Sapporo; Sendai; Shizuoka; Takasaki; Toyama; Utsunomiya; and Yokkaichi.
Demand for driving and walking is increasing. The demand for driving and walking is increasing more rapidly than demand for public transit but with some exceptions, where these modes remain well below pre-COVID-19 levels.
Fig-10 Average Congestion Levels in Selected Asian Cities Source: TomTom. Traffic Index (accessed 24 June 2020).
21 | P a g e
2.2.1) Impact on the Environment, Road Safety, and Economy. 2.2.2) Climate Change and Air Pollution.
Before COVID-19, transport contributed to about 24% of carbon emissions directly related to global energy. The lockdowns put in place had a direct impact on CO2 emissions from transport both globally and in rapidly growing Asian economies (Figure 11). The transport sector is estimated to have made the largest contribution to COVID-19-related CO2 emission reductions. The initial impact in the transport sector (in early March 2020) was in Asia and the Pacific region, with other regions contributing significantly in April and May 2020. As lockdowns are relaxed and transport demand increases again, transport-related CO2 emissions are expected to rebound.
Fig-11 Transport-Related Carbon Dioxide Emissions Fig-12 Domestic Transport Emissions of of Selected Asian Economies and Globally ADB Members in 2020
22 | P a g e
2.2.3) Impact on Road Safety
In many countries, fewer people are traveling on roads because of the travel restrictions imposed to control the spread of COVID-19. Lower traffic on the roads is resulting in fewer road crashes. In France, the number of road accident casualties decreased by 40% and the number of seriously injured people reduced by 44% year-on-year in March 2020. Similar trends have been observed in California, where the number of casualties and seriously injured persons related to road accidents dropped by 50%.37 In Asia too, the reduction in road travel has had a positive impact on road safety—but, as the example of Malaysia shows, the lifting of the lockdown will result in a rapid return to business as usual.
2.2.4) Impact on the Economy
Transport is a key sector in most Asia and the Pacific economies. The transport sector’s gross value added in ADB (Asian Development Bank) members is estimated to be $2.8 trillion, or about 4% of gross domestic product (GDP). Data from the International Labor Organization indicate that about 157 million people are employed in the transport industry in ADB (Asian Development Bank) members, of which 52% are in road and railway transport services (including pipelines) and 17% are in wholesale and retail trade and automobile repair.
Fig-13 Transport Employment in ADB Members, 2020
ADB = Asian Development Bank.
23 | P a g e
2.2.5) Exit Strategy for Lockdown in Asia.
The impacts of these lockdowns are being felt at all levels, from individual job security to the global economy and trade. Experts believe there may not be a return to normalcy until a vaccine is found and disseminated widely. The timeline is uncertain and could be more than a year. In the meantime, countries should expect to enter a stage of coexistence with the virus. A pattern of intermittent easing and tightening of restrictions in the coming months may be likely, to keep new infections under control while balancing a rebooted economy.
Economic slows down, sustained remote working, e-learning, and e-commerce are contributing to reduced travel demand. Developing economies, such as the Philippines and Thailand, are showing similar trends, with driving recovering faster than public transit ridership. On the other hand, India is experiencing a much faster recovery of public transit ridership than of driving, most likely because of a relatively higher proportion of captive users. In several developed cities in Europe, extensive government investment in cycling infrastructure has contributed to increased uptake of walking and cycling.
24 | P a g e
2.2.6) Good Practices for Enhancing the Resilience of Transport Services.
Policy makers, regulators, and especially transport operators can take several measures to enhance the health resilience of transport systems and reduce the likelihood of users becoming infected as lockdowns are eased. This is especially relevant during the phase when COVID-19 infections are declining but the risk of community transmission still exists. Once there is no longer a substantial chance of community transmission, the good practices (under public transit, active transport, aviation, and freight and logistics), especially those on social distancing, are likely to be further relaxed or completely abandoned.
2.2.7) Public Transit
Public transit (including buses) plays an important role, particularly in densely populated cities. It provides the most efficient way of transporting large numbers of passengers in a cost-effective, affordable, and environmentally sustainable manner. Well-planned urban public transport systems also contribute to enhancing the accessibility and vibrancy of the city and quality of life for its residents.
Fig-14 Implications of Safe-Distancing Requirement on Public Transport Capacity m = meter.
Source: International Transport Forum. 2020. Re-Spacing Our Cities for Resilience. COVID-19 Transport Brief. 3 May.
25 | P a g e
Demand for urban public transit during the pandemic has been suppressed and is expected to remain below pre-COVID-19 levels if work-from-home trends and e-learning are sustained. The two key challenges are,
(i) tackling capacity challenges on public transport in the context of safe-distancing requirements.
(ii) how best to regain public confidence to encourage a return to public transport.
Additional efforts will be required to reassure public transport users of safety precautions and demonstrate that public transport is clean and safe. Government policies and financial support will be essential to enable public transport operators to remain viable so they can continue to support the movement of passengers and goods to keep the economy going while ensuring longer-term sustainability.
CONCLUSION
In Asian countries as we saw the covid-19 crisis has impacted to the public transport system many policies by government goes is loos of financial support to public users and fluctuation in the economic down government unable to support by financially to moving passengers. Bus transport plays an important rule for public users in highly populated cities.
Many users’ treys to use their own vehicles reduced in public transport and in lockdown situation people think better not to travel by any type to transport they are using work from home easiest way to not contact any other person during travel and in covid-19.
In above Asian cities the demand for driving and walking is increasing. The demand for driving and walking is increasing more rapidly than demand for public transit but with some exceptions increase. The number of restrictions on urban public transit across ADB (Asian Development Bank) members peaked between mid-April and mid-May 2020 and has since gradually declined.
26 | P a g e
Chapter-3
3) COVID-19 redefines public transportation in India. 3.1) Introduction
Ministry of Road Transport and Highways has some restriction on covid-19 for public transport pandemic has disrupted the way people interact with businesses and government, requiring reimagining of modes for interaction of citizens with Governments and businesses. While public transport was suspended across cities worldwide, during February-March, Google mobility report tracking visitors to public transit locations reported a decline of 60-90% traffic. On the same line, as per a World Bank-UITP study on the impact of COVID-19 on public transport in India, the passenger traffic has reduced by 80-100% during the lockdown, whereas the economic fallout to bus operators has been to the tune of INR 69,000 Crores.
Government of India has been proactive in dealing with the continuously evolving situation, from the onset of the pandemic. Several steps have been undertaken by GOI (Government of India) and MORTH (Ministry of Road Transport Highways) to deal with the disruption in goods and people movement. Shared public transport operators like cab aggregators, taxi associations, transport associations need to lead the effort in deploying technology to safeguard passengers and designing innovative personal hygiene protocols to prevent spread of the virus. Similarly, the hospitality industry specifically the HoReCa (Hotels-Restaurants-Cafeteria) segment will have to ensure similar sanitation arrangements for their continued operations recreating demand for individual travel and thereby the revival of public transport.
3.2) Characteristics of Sample set.
27 | P a g e
The COVID-19 pandemic has significantly impacted everyone and almost every aspect of life. The world is dealing with challenges which were hitherto unknown and the impact of this is visible on the global economy. The Transport sector, especially public transport, has been impacted significantly by the pandemic.
Fig-16 percentile ratio over all categories of Indian cities.
3.3) Public Transport hits a roadblock post-lockdown.
Many more people prefer to use their own vehicles post lockdown, it may lead to traffic congestion in cities with the rapid growth of urbanization in India, public transport has become an intrinsic part of city life for intra and intercity commute. Public transportation is the primary mode of transit in large cities and urban regions in India.
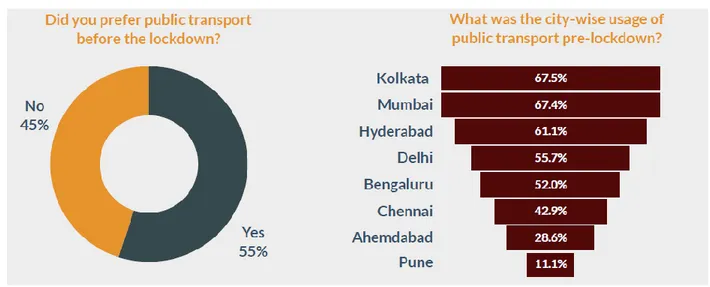
App-based Cabs, more and more people in urban areas are finding usage of public transport reliable, convenient, comfortable, and safe. Based on the survey conducted by us, we found that before the lockdown, 55% of the people in these cities or metropolitan regions were using public transport. Public transport was preferred by more than 2/3 (>67%) of the people in two of the most densely populated cities - Kolkata and Mumbai. It was less prevalent in cities like Pune and Ahmedabad.
28 | P a g e
However, the COVID-19 pandemic has significantly changed this as we have seen from our survey in the eight cities.
Fig- 17 Preference for Transport before Lockdown and Preference for Transport before Lockdown.
3.3.1) Passenger Travel Demand.
3.3.2) Share of Transport Modes Before COVID-19.
As per the survey, the share of different primary modes of travel before COVID-19 is captured in (Figure 18). The stated mode choice survey found high usage of private cars with 23 per cent of respondents using their own cars for work trips. Public transport was well represented, as metro and bus services were availed by 25 per cent and 9 per cent of the respondents, respectively. The intermediate public transport (IPT) modes, such as private taxis and autorickshaws constituted about 15 per cent of the sample. The high usage of public transport in the sample despite the availability of private cars and high-income levels in the sample suggests the prevalence of choice users.
Several respondents walked to work as well. Only 2 per cent of respondents reported that they cycled to work despite more respondents owning at least one bicycle. Distance between home and workplace might hinder cycling to work but this could also be attributed to the lack of cycling infrastructure in Indian cities. Two-wheelers were also represented in the sample with 9 per cent of respondents choosing this mode.
29 | P a g e
Mode of share mobility before covid-19
Fig-18 Share of different transport modes used by respondents pre COVID-19 (work trips)
3.3.3) India mobility modal shift post covid-19 crisis.
Respondents were asked if the COVID-19 crisis would influence their choice of transport modes. Most respondents (65 per cent) said, there would be no change in their choice. This was expected, as a large proportion of respondents used private cars and non-motorized transport (NMT) for their commute, anyway. Only 9 per cent responded that their choice would be altered by the crisis. The rest of the sample (26 per cent) responded with maybe – this could be a result of prevailing uncertainty at the time of filling the questionnaire. Overall, the results suggest that the transportation demand could be significantly altered with almost 35 per cent of the sample potentially switching to different modes.
To understand the nature of the shift, respondents were asked about their choice of transport post the COVID-19 crisis. Out of the respondents who said, maybe, 66 per cent provided a mode choice for the post- COVID-19 scenario, which was different from their initial choice of transport mode. These responses were included while estimating the modal shift.
30 | P a g e
Fig-19 Stated post-COVID-19 modal choice of initial metro users (work trips).
Fig-20 Stated post-COVID-19 modal choice of initial bus users (work trips).
In above figure shows that 41 per cent of initial bus users stated that they would shift to other modes. Like metro services, the most common change was a shift towards private vehicles and intermediate public transport. Additionally, some bus users stated, they would shift to non-motorized modes such as cycling and walking. The decrease was also witnessed in the use of local trains, mostly by residents in Mumbai.
31 | P a g e
3..3.4) Overall stated modal share for the sample pre and post COVID-19.
The largest decrease was seen in the modal share of metro services (9 per cent) followed by buses (4 per cent), and local trains (1 per cent). The decrease in these modes is compensated by a significant increase in the private modes of travel. The share of private cars and two wheelers increased by about 10 per cent. The share of private taxis also increased by about 2 per cent. The share of shared taxis decreased by a margin while the share of carpooling increased. The use of nonmotorized transport showed an increase with the modal share of cycling and walking (combined) increasing by around 3 per cent. Some respondents also stated that they would not travel to work post COVID-19 and prefer working from home, instead.
32 | P a g e
3.3.5) Sample Characteristics and changes in Modal Shift.
The modal choice affected the characteristics of the respondents too. The post-COVID-19 modal choice of public transport users was analyzed separately in terms of distance (from home to work), and household income.
3.3.6) Distance travelled.
All initial public transport users, who planned to switch to NMT, travelled less than 10 km to reach their workplace, with the majority travelling less than 5 km. A significant number of respondents shifting to personal vehicles and IPT also travelled less than 10 km. There is a possibility that these users could be nudged to shift to NMT if the right infrastructure were available. Most respondents, who wished to continue using public transport travelled more than 20 km. Shared cabs were also mostly opted for by those people who travelled more than 20 km, there by
suggesting that distance does influence a commuter’s choice between private taxis and shared modes.
33 | P a g e
3.3.7) Household income:
People shifting to private vehicles included both high- and lower-income respondents;
lower-income respondents mostly opted for two-wheelers. One surprising finding was that people shifting to NMT also belonged to higher income groups. This suggests that there is a willingness in people to shift to NMT irrespective of their income.
Graph-5 Household income and post-COVID-19 modal choice of initial public transport users.
Conclusion
India in covid-19 facing the problems like distance learning activities in the sense many people lost their jobs and students are struck to homes cannot get all facilities for learning from home. In lockdown trains, buses, taxis, air transport was closed to control the system and the people in India is huge task to government. Due to lockdown in India people not getting food on time so because of hungry any people die.
India stands second in list for covid-19 cases in world all borders where closed for the passengers who coming from other countries rapid in covid-19 cases. Private car and motor bike are used for home to work some people refers the remote working it is easy for employment to work from home then gradually employment rate is down day by day.
34 | P a g e
Chapter-4
4) Covid-19 PIARC’S responses on roads and transport sectors. 4.1) About PIARC
The PIARC is a world road association this network is stablished in 1909 at the
motor age as a non-profit organization. This network works worldwide over 100 years, the association continues to foster to facilitate the global discussion and knowledge sharing on roads and transport sectors. The association will be the world leader in the exchange of knowledge on roads and transport policy practice within an integrated sustainable transport industry. It also provides an overview of the policies and trends that affect all road users, the first international
road congress held in Paris when it was the called the Permanent International Association of
Road Congresses (PIARC).
The Road Engineering Association of Asia and Australasia was established in 1973 as a regional body to promote and advance the science and practice of road engineering and related professions. The Association was granted consultative status by the United Nations Economic and Social Council in 1970. The current organizational structure will be described below.
35 | P a g e
4.2) The Roads and Transport sector.
The roads and transport sector the public and private organization within it have been very
strongly impacted by covi-19. However, it has a vital role in keeping essential goods and workers moving, maintaining as much as possible the integrity of the supply chain, and ensuring that public heath, law enforcement and other emergency response professional can do their jobs effectively. Road transport is an essential service. The sector will have a vital role in the recovery too, especially if government prioritize infrastructure investment as an economic stimulus. With air transport severely hampered by the pandemic, surface transportation has become even more important in maintain connectivity and providing a lifeline to even the most remote places. Globally, land transport is estimated to account for 60 million direct jobs 2% of total employment. Indirect employment in the wider supply chain is even greater and land transport provide physical mobility which support employment in multiple other sectors. Direct employment in public agencies in the land transport sector is estimated at around 1.3 million at local, regional and national level. The covid-19 crisis has brought major changes to these agencies their supply chain, related workers, in following categories.
• The demand for mobility and in some cases transport capacity, has seen a significant decrease, with contraction in travel varying across modes models and networks.
• Border closures inspection and movement restriction have been implemented between nation regions and cities.
• The continued access to and operation of transport infrastructure and services has been critical to keep the supply of essential worker and goods moving.
• While in some countries construction, rehabilitation and maintenance work on the road , transport infrastructure and assets and other related contracts, have been suspended, slowed down or rescheduled in order in other countries construction activities have been declared essential and not only continued but accelerated to reduced traffic.
• Road operator in general experienced significant reduction in revenues either as a direct impact of the reduction in daily traffic or due to countries suspending toll collection during the heigh of the pandemic.
36 | P a g e
4.2.1) PIARC point of view of the covid-19 pandemic 4.2.2) Global incidence of covid-19.
Throughout all over the world as of 2nd December 2020, reported COVID-19 cases globally topped 64.5 million and almost 1.5 million were reported to have died. Figure 22 below illustrate key trends across regions.
Fig-22 Incidence of COVID-19 across the World (2nd December)
37 | P a g e
Fig-23 Increase of covid-19 cases and deaths by monthly in all continents.
4.2.3) Impact of Mobility
Lockdowns stay at home orders and restrictions on activities across the World have inevitably affected personal mobility and, by implication, access to various destinations and services. According to mobile data collected by Google and Apple, non-residential destinations have seen falls more than 60 to 90 per cent at maximum restrictions. Mobility levels have partially recovered in some countries as facilities have re-opened but are still around 20 to 40 per cent below pre lockdown levels. Renewed falls in mobility are also evidenced in some cities in late 2020 as lockdowns are reimposed to handle second waves of infection. It is likely to be some time before activity returns fully, impacted by the cessation of businesses and jobs, the substitution of some activities with online services, and the short-term repatriation of migrant workers to their home countries.
Congestion levels have fallen sharply in cities across the World, air quality has
improved, carbon emissions have fallen, noise levels have reduced some citizens and residents perceive an improved quality of life in working from home and interacting in their local neigh bour hoods rather than commuting to a city center office. There is also some evidence that road accidents, which kill around 1.2 million people a year globally, may have fallen in line with reductions in traffic levels, but this is not universal and the impact on accident severity may be less positive as motorists drive faster on quieter roads resulting in higher impact collisions.
38 | P a g e
4.3) National and localized lockdowns, curfews and other restrictions have had a direct impact on mobility which remains below pre-pandemic levels.
4.3.1) Framework for the key stages of the pandemic.
The focus of most transport professionals has been on tracking, managing, and recording the consequences of what the International Monetary Fund (IMF) has called “The Great Lockdown,” attention has increasingly turned to sustainable exit strategies and dividing actions in response to the COVID-19 pandemic into different stages. These need to be designed to not only release people from isolation, but carefully restart economic and social activity and pave the way for a viable and sustainable recovery into 2021 and beyond.
At the time of national lockdown measures have largely ended in most part of the World, changing at different times and with varying profiles in different places. Whilst a “second wave” is evident in some regions, for example Europe, in other continents, for example East Asia, infections have declined considerably.
39 | P a g e
Fig-25 Nationalized curfew which has direct impact on mobility,
to move from residential to workplaces its in below average during pandemic.
To assist in this process, the PIARC COVID-19 Response Team has made reference to a three phases model called Reopen – Recover – Reimagine. The model includes:
• Short-term Reopening from lockdowns, based on social distancing, face masks and other personal protection and greater intelligence and experience in tracking and managing the virus, with risks carefully managed until a vaccine and more effective therapeutic treatments are available. This release period is evident in some regions and countries in late 2020, but with the very real prospect of renewed lockdowns in others in response to second or third waves as infection rates increase again. Life is unlikely to get back to “normal” until well into 2021.
• Medium-term Recovery of national and local economies, supported as Governments and the private sector assess immediate needs and launch various initiatives for rehabilitating businesses, creating new employment, and rebuilding the sectors and localities worst impacted. This period is expected to last into 2021 and likely well beyond, including accelerated infrastructure delivery, technology research and other tools of economic stimulus and industrial strategy.