Scuola di Architettura Urbanistica Ingegneria delle Costruzioni
Master of Science in Architectural and Building Engineering
Curriculum Building Engineering
Affordable nZEB: energy and comfort analyses of low cost
strategies for nearly Zero Energy Buildings
Supervisor: Prof. Lorenzo PAGLIANO
Co-supervisor: Ing. Silvia Erba
Master dissertation by:
Andrea BATTISTEL
854584
Academic Year
“Nothing is as dangerous in architecture as dealing with separated problems. If we split life into separated problems we split the possibilities to make good building art”
I
1. Definition and diffusion of nearly Zero Energy Buildings ... 1
1.1. Introduction ... 1
1.2. nZEB European definition ... 2
1.3. Energy boundaries ... 4
1.4. European situation ... 8
1.5. Italian Situation ... 9
1.5.1 Energy efficiency requirements in Italy ... 9
1.5.2 nZEB diffusion in Italy ... 12
1.5.3 nZEB Barriers in Italy ... 14
2. Building design objectives ... 20
2.1. Thermal Comfort ... 20
2.1.1 Buildings with mechanical heating/cooling system ... 21
2.1.2 Buildings without mechanical cooling ... 23
2.1.3 Long term evaluation ... 26
2.1.4 Parameters influence on thermal comfort ... 27
2.2. Cost assessment ... 32
2.2.1 Basis of economic evaluations ... 32
2.2.2 Cost optimal level ... 34
2.2.3 Application example ... 37
2.2.4 Cost saving strategies ... 39
3. Low cost passive strategies description ... 42
3.1. Low flow showerheads ... 44
3.1.1 Baseline scenario ... 45
3.1.2 New scenario ... 48
3.1.3 Sensitivity analysis ... 50
3.2. Building envelope ... 54
3.2.1 Straw prefabricated envelope ... 54
3.3. Natural ventilation ... 60
3.3.1 Ventilation and cooling ... 61
3.3.2 Natural ventilation strategies ... 66
3.3.3 Influencing parameters ... 68
3.3.4 Overview of calculation methodologies ... 69
3.3.5 Analytical method for airflow calculation ... 70
II
4.3. Building description ... 77
4.3.1 Construction overview ... 77
4.3.2 Services ... 80
4.3.3 Cost assessment ... 82
4.3.4 Building Energy Performance ... 85
4.4. Building energy modelling in Pleiades ... 86
4.4.1 Software overview ... 86
4.4.2 Simulation assumptions ... 87
4.5. nZEB results ... 100
5. Low cost passive strategies implementation ... 103
5.1. Low-flow showerhead ... 103
5.2. Building envelope ... 108
5.2.1 Initial comparison ... 108
5.2.2 Energy needs analysis ... 110
5.2.3 Construction cost ... 113
5.2.4 Embodied energy and carbon ... 115
5.3. Natural night ventilation ... 119
5.3.1 Feasibility study ... 119
5.3.2 Wind analysis ... 120
5.3.3 Ventilated zones description ... 122
5.3.4 Airflow calculation ... 130
5.3.5 Comfort analysis ... 134
5.4. Final comparison and improvements ... 148
5.4.1 Energy need for domestic hot water ... 148
5.4.2 Energy need for heating and cooling ... 148
5.4.3 Adaptive comfort ... 149 5.4.4 Construction cost ... 150 6. Conclusion ... 152 Annex 1... 154 Annex 2... 167 List of websites ... 174 Bibliography ... 175 Acknowledgements ... 175
III
Fig. 1: First autonomous house in Freiburg. Source: [3] ... 1
Fig. 2: schematic representation of the energy need for heating. Source: eERG ... 5
Fig. 3: schematic representation of the energy need for heating and delivered energy. Source: eERG ... 6
Fig. 4: schematic representation of the energy use for heating, delivered energy and primary energy. Source: eERG ... 7
Fig. 5: European cross- country situation for nZEB definition. Source: ZEBRA 2020. ... 8
Fig. 6: Project and reference building. Source: Anit Guide 2017 ... 9
Fig. 7: nZEB diffusion throughout Italy. Source: (MIP 2017) ... 13
Fig. 8: Percentage of buildings energy certification classes in 2016 and 2017 in Lombardia. Italy. Source: (MIP 2017) ... 14
Fig. 9: Extra cost of nZEB, compared to buildings that follow standards in force in 2016. Source: PANZEB 2016. ... 15
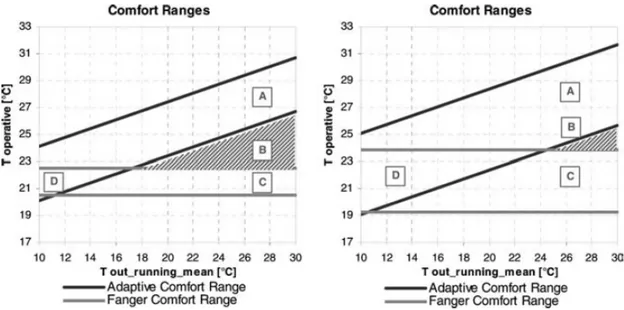
Fig. 10: Comfort temperature ranges for the three acceptance levels. Source: EN 15251:2007 . 24 Fig. 11: Comfort temperature ranges for adaptive and Fanger model, related to category I (left) and II (right). Source: (Pagliano and Zangheri, 2010) ... 25
Fig. 12: Comfort temperature ranges for different clothing levels. In the example: 26 °C operative temperature, 50 % R.H., 0,1 m/s air speed and 1,2 met (sedentary occupancy), 0,5 clo (left), 0,36 clo (right). Source: [5]. ... 27
Fig. 13: Comfort temperature ranges for different clothing levels (2). In the example: 27 °C operative temperature, 50 % R.H., 0,1 m/s air speed and 1,2 met (sedentary occupancy), 0,5 clo (left), 0,36 clo (right). Source: [5]. ... 28
Fig. 14: Comfort ranges for different metabolic rates. In the example: 26 °C operative temperature, 50 % R.H., 0,1 m/s air speed and 0,5 clo, 1,2 met (left), 1 met (right). Source: [5]. ... 28
Fig. 15: Comfort ranges for different relative humidity. In the example: 26 °C of operative temperature, 0,1 m/s air speed, 0,5 clo, 1,2 met, 30 % R.H (left), 60 % R.H (right). Source: [5]. . 29
Fig. 16: Relationship between air velocity and increase in the upper temperature limit. Source: EN 15251:2007. ... 30
Fig. 17: Comfort ranges for different air velocities in the adaptive model. In the example: air velocity 0,1 m/s (left), 0,5 m/s (right). Source: [5]. ... 30
Fig. 18: Comfort ranges for different air velocities with the Fanger model. In the example: operative temperature 30°C, 50 % R.H., 1,2 met, 0,5 clo, air velocity 0,1 m/s (left), 0,5 m/s (right). Source: [5]. ... 31
Fig. 19: economic optimum between building design solution. Source: (Di Giuseppe and D’Orazio 2015). ... 34
Fig. 20: global costs and primary energy for all the solutions. Source: (Pagliano, Pietrobon and Armani 2013) ... 37
Fig. 21: Comfort ranges associated to different active and passive strategies. Source: (Manzan-Agugliaro et. Al 2015) ... 43
Fig. 22: Low-flow showerhead. Source: [9] ... 45
Fig. 23: Output of the baseline shower scenarios ... 47
IV
Fig. 26: Calculation period influence in the internal rate of return ... 51
Fig. 27: Number of users influence on the internal rate of return ... 52
Fig. 28: future scenario influence in the internal rate of return ... 53
Fig. 29: internal side of Pablok. ... 56
Fig. 30: External side of Pablok with the wood board partially mounted ... 56
Fig. 31: Pablok panel example on site ... 57
Fig. 32: Pablok stratigraphy [10]. ... 58
Fig. 33: Pablok stored in site during construction ... 59
Fig. 34: CCP distribution in Europe [°C hr]. Source: (Artmann 2006) ... 63
Fig. 35: Heat map of the climate in Milan. Source: (Causone 2016) ... 64
Fig. 36: Expected Cooling requirement reduction for a primary school in different climates. Source: (Holzer 2018a) ... 66
Fig. 37: Wind driven and stack driven airflow. Source: Liddament 1996) ... 67
Fig. 38: Maximum depth for single and cross ventilation. Liddament 1996 ... 68
Fig. 39: Airflow path depending on window configuration. A. No cross-ventilation; B. Two large openings having same dimensions generate best ventilation; C. Small entering opening and large exit opening is sufficient for ventilation; D. Large entering opening and small exit opening undermines the ventilation ... 68
Fig. 40: Monthly average temperature in Milan (MI_Linate_1951-1970) ... 75
Fig. 41: Monthly global horizontal radiation in Milan (MI_Linate_1951-1970) ... 76
Fig. 42: 3D view of the school building from the inner courtyard. Source: Pleiades ... 77
Fig. 43: 3D view of the school building from the street. Source: Pleiades ... 78
Fig. 44: Main cost field distribution ... 82
Fig. 45: Main cost voices distribution ... 83
Fig. 46: opaque envelope cost distribution ... 84
Fig. 47: Transparent envelope cost distribution ... 84
Fig. 48: Primary energy per service ... 85
Fig. 49: Primary energy distribution ... 85
Fig. 50: Window with integrated shading system - groundfloor ... 88
Fig. 51: Window with integrated shading system - 1st floor (the 2nd floor is equal to the 1st, expect for the presence of the gym) ... 88
Fig. 52: Underground – thermal zones ... 90
Fig. 53: Groundfloor - thermal zones ... 91
Fig. 54: 1st floor - thermal zones ... 92
Fig. 55: 2nd floor - thermal zones ... 93
Fig. 56: Assumed occupation time schedules ... 95
Fig. 57: Comfort assessment for the gym. Source: [5] ... 99
Fig. 58: Energy need for heating and cooling - whole building ... 100
Fig. 59: Annual heating and cooling energy need for single thermal zones ... 101
Fig. 60: Sensitivity analysis for the base nZEB model ... 102
Fig. 61: Fixed low-flow showerhead. Source: [12] ... 103
Fig. 62: Energy saving for domestic hot water ... 106
Fig. 63: Color of the stoneware tiles ... 108
V
Fig. 66: Energy need for heating and cooling comparison – envelope alternatives ... 111
Fig. 67: Hourly average operative temperature (June) in the gym - envelope solutions ... 112
Fig. 68: Construction cost comparison - envelope alternatives ... 115
Fig. 69: Embodied energy comparison – envelope alternatives ... 118
Fig. 70: Night cooling potential in Milan. Source: Ventilative cooling tool ... 119
Fig. 71: Frequency of wind speed range during May ... 120
Fig. 72: Frequency of wind speed range during June ... 121
Fig. 73: Frequency of wind speed range during September ... 121
Fig. 74: ventilation zone VZ1 (north/south branch) ... 123
Fig. 75: Ventilazione zone VZ2 ... 123
Fig. 76: Ventilation zone VZ3 ... 123
Fig. 77: Scheme for the evaluation of nearby obstacles to wind. Source: EN 16798-8:2017 ... 127
Fig. 78: Schematic representation of the surrounding ... 128
Fig. 79: Air change rate dependence on wind speed and temperature difference ... 129
Fig. 80: Monthly air change rate in VZ1 according to the scenario S1 and S2 ... 131
Fig. 81: Monthly air change rate in VZ2 according to the scenario S1 and S2 (the hatched bar represents the dominance of the stack effect) ... 132
Fig. 82: Monthly air change rate in VZ3 according to the scenario S1 and S2 (the hatched bar represents the dominance of the stack effect) ... 133
Fig. 83: stopping and starting condition for the scenarios S1a - S2a ... 135
Fig. 84: Occupied hours for every month ... 135
Fig. 85: Percentage discomfort hours - building envelope ... 136
Fig. 86: Hourly operative temperature - single classroom_South -S0 ... 137
Fig. 87: Hourly operative temperature – Classroom_south -S1 ... 137
Fig. 88: Hourly operative temperature – Classroom_south -S2b ... 138
Fig. 89: Monthly discomfort hours - Classroom_south ... 139
Fig. 90: Hourly operative temperature – Classroom_east -S0 ... 140
Fig. 91: Hourly operative temperature – Classroom_east -S1a ... 140
Fig. 92: Hourly operative temperature – Classroom_east -S2b ... 141
Fig. 93: Monthly discomfort hours - Classroom_east ... 142
Fig. 94: Hourly operative temperature – Teachers room -S0 ... 142
Fig. 95: Hourly operative temperature – Teachers room -S1a ... 143
Fig. 96: Hourly operative temperature – Teachers room -S0 ... 144
Fig. 97: Monthly discomfort hours – Teachers’ room ... 145
Fig. 98: Increase in the upper limit of comfort temperature range due to medium and high fan speed setting ... 146
Fig. 99: Percentage of discomfort hours with the improving in the shading factor ... 147
Fig. 100: Cooling energy need in the teachers’ room ... 147
Fig. 101: Energy saving of DHW in the gym only and for the whole school ... 148
Fig. 102: Final comparison for heating and cooling energy need. W1 and W1_B are referred to the envelope solutions for nZEB and AZEB (paragraph 5.2), while S1b, S2b and S3 are referred to the ventilation scenarios (paragraph 5.3.5) ... 149
Fig. 103: Final comparison for discomfort hours in the classrooms ... 150
VII
Tab. 1: Example of application of energy requirements for nZEB rating. Source: EN ISO
52000-2:2017 (Annex H) ... 3
Tab. 2: Primary energy factors. Source: (Regione Lombardia 2017) ... 7
Tab. 3: status of nZEB definition in South Europe countries. Source: Attia et al. 2017 ... 9
Tab. 4: building parameters used in DM26/06/2015. ... 10
Tab. 5: nZEB requirements. Source: DM26/06/2015 ... 10
Tab. 6: nZEB requirements for renewable energy production. Source: Legislative Decree 3 March 2011 ... 11
Tab. 7: Performance and economical difference between standard building and nZEB. Source EER 2017 ... 16
Tab. 8: Comfort category definition. Source: EN 15251:2007 ... 22
Tab. 9: Temperatures ranges for some building categories in the Fanger Model. Source: EN 15251:2007 ... 22
Tab. 10: Temperatures ranges for some building categories in the Fanger Model. Source: EN 15251 ... 23
Tab. 11: nZEB vs CO solution. Source: Pagliano, Pietrobon and Armani. 2013 ... 38
Tab. 12: percentage difference between nZEB and CO solution with the reference case. Source: Pagliano, Pietrobon and Armani. 2014 ... 39
Tab. 13: Calculation assumption for shower ... 46
Tab. 14: Composition of water price, methane price and electricity price ... 46
Tab. 15: Market overview of low-flow showerheads ... 48
Tab. 16: Categories of low-flow showerheads ... 49
Tab. 17: thermal transmittance of building components. Source: ... 79
Tab. 18: Global heat transfer coefficient depending on the emissivity and wind exposure ... 87
Tab. 19: Thermal bridges of the initial solution ... 87
Tab. 20: Thermal zone description - heated spaces ... 89
Tab. 21: Number of thermal zone per floor ... 90
Tab. 22: Heat production by people ... 94
Tab. 23: People occupation and assumed schedule ... 95
Tab. 24: Internal gain by equipment ... 96
Tab. 25: Internal gain for artificial lighting ... 97
Tab. 26: Air change rate and time schedule of ventilation ... 98
Tab. 27: Heating and cooling set point temperature and time schedule ... 99
Tab. 28: Daily water consumption according to UNI TS 11300-2 ... 104
Tab. 29: Monthly energy need for domestic hot water – nZEB scenario ... 105
Tab. 30: Energy need for domestic hot water - AZEB scenario ... 106
Tab. 31: Initial comparison between the envelope solutions ... 109
Tab. 32: Dimension and thermal transmittance of the prefabricated panels ... 110
Tab. 33: Unitary cost of the adopted solution W1 (nZEB scenario) ... 113
Tab. 34: Unitary cost of alternative solution W1_A (AZEB scenario) ... 114
Tab. 35: Unitary cost of alternative solution W1_B (AZEB scenario) ... 114
Tab. 36: Calculation of EE and EC of W1 ... 116
VIII
Tab. 39: Internal gain in two thermal zones ... 119
Tab. 40: Average wind evaluated in the most frequent range, for every orientation... 122
Tab. 41: Description of the dimension and window opening area for every ventilation zone .... 124
Tab. 42: Default values for airflow calculation ... 125
Tab. 43: Reference angles for the equivalent area for cross ventilation ... 125
Tab. 44: calculation of the equivalent window area for cross ventilation ... 126
Tab. 45: Criteria for shielding class assumption. Source: EN 16798-8:2017 ... 127
Tab. 46: Difference in the pressure coefficient for every orientation ... 128
Tab. 47: Daily temperature difference between inside and outside ... 130
Tab. 48: Minimum monthly temperature difference and corresponding air density ... 131
Tab. 49: Output of the analytical method in terms of air change per hour ... 134
Tab. 50: Discomfort hours during the whole season - Classroom_south ... 139
IX
The terminology used in this thesis, as suggested by the Energy Performance of Buildings Directive (EPBD), is compliant with the standard EN ISO 52000-1:2017(E) and the ISO 9836:2017(E), regarding building, energy and area. The terminology about thermal comfort is compliant to the EN 15251:2007 and ASHRAE Standard 55:2017. The terminology regarding economical evaluations are referred to the EN 15459-1:2017 and BS ISO 15686-5:2017. The terms, which have a specific definition in EN-ISO are in italics underlined in this text. The definitions of the terms are presented in the following.
Building
Building fabric: all physical elements of a building, excluding technical building systems. Thermally conditioned space: heated or cooled space.
Thermal envelope area: total area of all elements of a building that enclose thermally conditioned spaces through which thermal energy is transferred, directly or indirectly, to or from the external environment. Note 1: the thermal envelope area depends on whether internal, overall internal or external dimensions are being used. Note 2: the thermal envelope area does not include the area to adjacent buildings; see ISO 13789. Note 3: the thermal envelope area may play a role in the ways to express the overall and partial energy performance and energy performance requirements and comparison against benchmarks.
Useful floor area: <for EPB assessment> area of the floor of a building needed as parameter to quantify specific conditions of use that are expressed per unit of floor area and for the application of the simplifications and the zoning and (re-)allocation rules.
Energy
Assessment boundary: limit where the delivered and exported energy are measured or calculated Delivered energy: energy, expressed per energy carrier, supplied to the technical building systems through the assessment boundary, to satisfy the uses taken into account or to produce the exported energy.
Distant: <to the building site> not on-site nor nearby.
Energy from renewable sources or renewable energy: energy from renewable non-fossil sources, namely wind, solar, aerothermal, geothermal, hydrothermal and ocean energy, hydropower, biomass, landfill gas, sewage treatment plant gas and biogases.
X
water to raise its temperature from the cold network temperature to the prefixed delivery temperature at the delivery point without the losses of the domestic hot water system.
Energy need for heating or cooling: heat to be delivered to or extracted from a thermally conditioned space to maintain the intended space temperature conditions during a given period of time.
Energy need for humidification or dehumidification: latent heat in the water vapour to be delivered to or extracted from a thermally conditioned space by a technical building system to maintain a specified minimum or maximum humidity within the space.
Energy use for lighting: electrical energy input to the lighting system.
Energy use for space heating or cooling or domestic hot water: energy input to the heating, cooling or domestic hot water system to satisfy the energy need for heating, cooling (including dehumidification) or domestic hot water respectively.
Energy use for ventilation: electric energy input to a ventilation system for air transport and heat recovery.
Exported energy: energy, expressed per energy carrier, supplied by the technical building systems through the assessment boundary.
Nearby: <the building site> on local or district level (e.g., district heating or cooling).
Non-renewable energy: energy taken from a source, which is depleted by extraction (e.g. fossil fuels). Note 1 to entry: resource that exists in a finite amount that cannot be replenished on a human time scale.
Non-renewable primary energy factor: non-renewable primary energy for a given energy carrier, including the delivered energy and the considered energy overheads of delivery to the points of use, divided by the delivered energy.
On-site: the premises and the parcel of land on which the building(s) is located and the building itself. Note that on-site defines a strong link between the energy source (localisation and interaction) and the building.
Primary energy: energy that has not been subjected to any conversion or transformation process. Note that Primary energy includes non-renewable energy and renewable energy. If both are taken into account it can be called total primary energy.
Renewable primary energy factor: renewable primary energy for a given distant or nearby energy carrier, including the delivered energy and the considered energy overheads of delivery to the points of use, divided by the delivered energy.
Total primary energy factor: sum of renewable and non-renewable primary energy factors for a given energy carrier.
XI for heating.
Comfort
Adaptation: physiological, psychological or behavioural adjustment of building occupants to the interior thermal environment in order to avoid discomfort.
Adaptive model: a model that relates indoor design temperatures or acceptable temperature ranges to outdoor meteorological or climatological parameters.
Occupied hours: occupied hours of the building are those when the majority of the building is in its intended use.
Temperature, operative: the uniform temperature of an imaginary black enclosure, and the air within it, in which an occupant would exchange the same amount of heat by radiation plus convection as in the actual nonuniform environment.
Cost
Annual costs: costs that represent the sum of running costs and periodic costs or replacement costs paid in a certain year.
Cost of greenhouse gas emissions: monetary value of environmental damage caused by CO2 emissions related to the energy consumption in buildings.
Discount factor: multiplicative number which is used to convert a cash flow occurring at a given point in time (year i) to its equivalent value at the starting point and which is derived from the discount rate.
Discount rate: definite value for comparison of the value of money at different times expressed in real terms.
Disposal cost: cost for deconstruction at the end of life of a building or building element and
include deconstruction, removal of building elements that have not yet come to the end of their lifetime, transport and recycling.
Energy cost: cost and fixed and peak charges for energy including national taxes.
Global cost: sum of the present value of the initial investments costs, annual running costs and replacement costs (referred to the starting year) as well as disposal costs if applicable.
Initial investment cost: cost incurred up to the point when the building (or the building element) is delivered to the customer, ready to use.
XII
benefits over the period of analysis, makes costs equal to benefits when cash flows are reinvested at a specified interest rate.
Life span: economic lifetime expectancy for a component j (or system) normally specified in years.
Maintenance cost: cost for measures for preserving and restoring the desired quality of the
building, building element or installation.
Net present value: sum of the discounted future cash flows.
Operational cost: cost linked to the operation of the building, including annual costs for insurance, utility charges and other standing charges and taxes.
Periodic costs of year i:substitute investment that is necessary for age reasons; that corresponds to cost replacement of all components (or system) according to their lifespan that occur on year-i.
Price development rate: development over time of prices of energy, products, building systems, services, labour, maintenance and other costs that can be different from the inflation rate; the subscript xx corresponds to the cost category.
Replacement cost for component or system: substitute investment for a building element,
according to the estimated economic lifecycle during the calculation period.
Running cost: cost including maintenance cost, operational cost and energy cost for the time step considered.
Starting year: year on which any calculation is based and from which the calculation period is
XIII
The thesis has been developed in the context of the EU project AZEB (Affordable Zero Energy Buildings), which aims to achieve significant construction and lifecycle cost reductions of new nearly Zero Energy Buildings (nZEBs) through integral process optimization in all construction phases.
In the first part, the theme of the definition of nZEB according to European standards has been addressed, with a focus on the Italian situation and the national energy requirements. The literature review about the current barriers to the diffusion of nZEBs has highlighted the importance of economic feasibility and the necessity to identify cost-effective strategies and solutions to reduce the costs while obtaining performance optimization. Comfort assessments and cost saving approaches are analysed.
In the second part, the thesis investigates three affordable strategies for nZEBs: the use of low flow showerheads, focusing on the market overview and the cost saving potential, a new prefabricated technology with straw insulation for the building envelope and the natural night ventilation, assessed through feasibility study and calculation method for the airflow rate, according to European standards.
In the last part, the selected solutions are evaluated through the virtual application in a real school building, which has been chosen as case study. The use of analytical methods and the dynamic energy model of the school, realized with the French software Pleiades, has allowed estimating the energy, cost and comfort potential of the different measures. The results underline the effectiveness of simple and low cost technologies for the rational use of water, the advantages of choosing sustainable envelope solutions and the benefits of natural ventilation for indoor thermal comfort.
Keywords: nZEB; cost effective strategies; energy need; thermal comfort; dynamic energy simulation
XV
La tesi è stata sviluppata nel contesto del progetto Europeo AZEB (Affordable Zero Energy Building), che ha lo scopo di raggiungere importanti riduzioni dei costi di costruzione e del ciclo di vita di edifici a energia quasi zero (nZEB) attraverso l’ottimizzazione del processo in tutte le fasi di costruzione.
Nella prima parte è stato analizzato il tema della definizione di edificio nZEB in base alle normative Europee, con particolare attenzione alla situazione italiana e ai requisiti energetici nazionali. Un’analisi di letteratura delle barriere esistenti alla diffusione di edifici nZEB ha sottolineato l’importanza della fattibilità economica e la necessità di identificare strategie economiche ed efficaci, per ridurre i costi e ottimizzare le prestazioni.
Sono stati analizzati i principali metodi di valutazione del comfort termico e alcuni approcci per il risparmio dei costi.
Nella seconda parte, l’elaborato analizza tre strategie per edifici a energia quasi zero: l’utilizzo di docce a basso flusso, concentrandosi sulla panoramica di mercato e la potenzialità di risparmio economico, una nuova tecnologia prefabbricata con isolamento in paglia per l’involucro edilizio e la ventilazione naturale notturna, valutata attraverso uno studio di fattibilità e un metodo di calcolo per i ricambi d’aria, in accordo con le normative Europee.
Nell’ultima parte, le soluzioni selezionate sono state analizzate attraverso l’applicazione in un edificio scolastico reale, che è stato scelto come caso di studio. L’utilizzo di metodi analitici e del modello energetico dinamico, realizzato con il software francese Pleiades, ha permesso di stimare la prestazione energetica, i costi e il comfort delle varie strategie. I risultati sottolineano l’efficacia di dispositivi semplici ed economici per l’uso razionale dell’acqua, i vantaggi della scelta di soluzioni sostenibili per l’involucro edilizio e i benefici della ventilazione naturale per il comfort termico indoor.
Parole chiave: nZEB; strategie a basso costo; fabbisogno energetico; comfort termico; simulazione energetica dinamica
1
1. Definition and diffusion of nearly Zero Energy Buildings
1.1. Introduction
The concept of Zero Energy Building began to be used during the 70th (Ionescu et al. 2015). The oil crisis in 1973 induced a growing interest in building energy efficiency, due to the increase of the energy cost. During this period, the architects Brenda and Robert Vale defined new concepts like self-sufficient house, autonomous house and green house; in 1975 they published “The Autonomous House”, a specialist guide for building designers with energy efficiency solutions. The sustainable principles began to be adopted, leading the design towards landscape integration and community acceptance.
In 1973 the “DTH zero energy house”, designed by the Technical University of Denmark, was built in Copenhagen. It was designed to achieve zero energy objective, but once the solar active system became defective, its performance was closer to the low energy house [1], characterised by an annual heating demand lower than 70 kWh/m2 yr [2].
In those years, the increase in the scientific data about global warming induced a growing political debate, in order to consider as priority the reduction of greenhouse gas emission and the use of renewable sources; during the Nineties, the topics regarding energy efficiency and sustainability gained attention because of the political debate concerning climate change.
As a main example, in 1992 the first energy autonomous house was built in Freiburg (Germany), designed by the Fraunhofer Institute for Solar Energy (Fig.1); the house covered its own needs without the help of external energy sources thanks to the integration of photovoltaic solar thermal collectors and seasonal energy storage together with a highly insulated envelope.
2
The European Union policymakers, which are among the strongest promoters of the Kyoto Protocol (1997), have long recognized the importance of energy efficiency in buildings to mitigate climate change. In 2007 the European Council set the Climate-Energy Framework 2020, a binding legislation to reach its climate and energy targets for the year 2020 (EU 2010; Attia et al. 2017). The package sets three key targets:
- 20 % cut in greenhouse gas emission, compared to 1990 levels; - 20 % increase in EU renewable energy;
- 20 % improvement in energy efficiency.
Since the building sector is the major energy consumer in Europe, accounting around 40 % of the total final energy consumption and 55 % - 60 % of electricity (calculated in 2012), the European Union set up the Energy Performance of Buildings Directive (EPBD) whose purpose is the reduction of building energy consumption (Gynther, Lappillone, and Pollier 2015; Part 2010; EU 2010). In the Directive, the concept of nearly Zero Energy Building (nZEB) is mentioned for the first time.
The article 9 of the Directive 2010/31/EU states that all member States shall guarantee: - “by 31 December 2020, all new buildings are nearly zero energy buildings;
- after 31 December 2018, new buildings occupied and owned by public authorities are nearly zero energy buildings”.
1.2. nZEB European definition
The first step to approach correctly the theme of nZEB is to clarify its definition, describing the energy flows boundaries with the appropriate nomenclature, compliant with EN standards. According to the Article 2 of the Directive 2010/31/EU of the European Parliament, the nZEB is defined as “a building that has a very high energy performance, as determined in accordance with Annex I. The nearly zero or very low amount of energy required should be covered to a very significant extent by energy from renewable sources, including energy from renewable sources produced on-site or nearby (…). The energy performance of a building means the calculated or measured amount of energy needed to meet the energy demand associated with a typical use of the building, which includes, inter alia, energy used for heating, cooling, ventilation, hot water and lighting”.
The European Standard EN ISO 52000-2-2017 points out that the energy performance should take into account:
3
- Thermal characteristics of the building, building elements having a significant impact on the energy performance of the building envelope;
- HVAC installation, hot water supply, built-in lighting installation, optimizing the energy use of technical building systems;
- Active solar systems and other systems based on energy from renewable sources; - District or block heating and cooling systems.”
Annex H of the same standard proposes a list of four requirements that must be fulfilled in order to reach the goal of nZEB; in each requirement the calculated value must be lower than the specified one (Tab.1). This procedure, described below, is not binding but represents a methodological proposal.
Tab. 1: Example of application of energy requirements for nZEB rating. Source: EN ISO 52000-2:2017 (Annex H)
Building fabric (energy need)
The first requirement evaluates the quality of the building fabric through the energy needs, calculated with ISO 52016-1:2017.The energy needs reflect the design quality of the building envelope, the bioclimatic design (e.g. solar gains, natural lighting), the inertia, the zoning and the need to guarantee adequate indoor climatic conditions to avoid poor indoor air quality or hygrothermal problems; the aim is the promotion of heat losses reduction through the envelope and by ventilation.
4
Total primary energy use
The second requirement considers the performance of the technical building systems, working with renewable or non-renewable sources. Since different building systems may work with different types of energy carriers, the total primary energy is used to evaluate them together coherently.
The calculation considers the delivered energy through the assessment boundary either nearby and/or distant to the building site; the aim is the promotion of the reduction in the use of inefficient systems.
Non-renewable primary energy use without compensation between energy carriers
The third requirement evaluates just the amount of primary energy that is coming from non-renewable source. It does not consider neither the compensation between different energy carriers neither the effect of exported energy.
Final nZEB rating: numerical indicator of non-renewable primary energy use with compensation
The last requirement again is related to the non-renewable primary energy, but it considers both the compensation between different energy carriers and also the effect of exported energy. Compensation can vary from 0 to 100% via the parameter kexp. At national level various choices have been taken: in the Italian legislation compensation is not possible between different energy carriers and between different months (e.g. RES excess energy exported to the grid in July cannot compensate for overconsumption in December).
1.3. Energy boundaries
The sequence of the four requirements described in the previous paragraph, represents the philosophy behind the nZEB design. The aim is to reduce the energy need through a performing envelope and secondly to cover a high amount of it through the implementation of renewable sources (Hermelink 2013). The direction of the calculation from need to source may be identified with three different balance boundaries. For simplicity, the procedure is referred just to the heating process, but it can be applied to any other service.
Thermal zone boundary (boundary of the heated zone)
As mentioned above, the energy need for heating is the amount of energy provided to the heated zone, whose limits are the boundaries considered for the calculation (Fig.2). The energy need for
5
heating is calculated as the difference between the transmission and ventilation losses and the useful heat gains.
Inside the losses group, the ones for transmission are connected to the heat flow due to conduction, convection and radiation throughout the envelope, driven by the temperature difference between indoor and outdoor condition; the ventilation losses instead are caused by the injection of outdoor fresh air into the ambient zone, either intentional or spontaneous (infiltration).
On the other hand, the useful solar gain is the heat provided by solar radiation entering directly or indirectly (after absorption in the building elements) through the envelope; the useful internal gains are generated by internal heat source, such as people, equipment or lighting (EN ISO 52000-1).
Fig. 2: schematic representation of the energy need for heating. Source: eERG Assessment boundary
(Fig.3 presents the case of the heating service).
The calculation proceeds from the energy needs to the energy uses to delivered energy and finally to primary energy, as described e.g. in the EN ISO 52000:2017.
6
The energy use for heating is covered through the delivered energy, produced by nearby or distant sources, comprehending the renewable on-site production.
Fig. 3: schematic representation of the energy need for heating and delivered energy. Source: eERG System boundary
In the system boundary, the calculation is referred to the primary energy (Fig.4).
The primary energy is evaluated dividing every energy carrier by its own primary energy factor, defined at national level; it is expressed as non-renewable (fP,nren) renewable (fP,ren) and total (fP,tot) primary energy factor (Tab.1).
The primary energy factor reflects the energy consumed during all the fuel’s phase life cycle, as well as national energy policies (Kurnitski 2013).
7
Tab. 2: Primary energy factors. Source: (Regione Lombardia 2017)
It’ worth notice that the renewable on-site generation is considered outside the assessment boundary; thus, the renewable energy produced on-site is considered as part of the delivered energy. The amount of energy that overcomes the services’ energy use is the exported energy, which can be counted to compensate the delivered energy (the compensation calculation is usually defined at national level).
Fig. 4: schematic representation of the energy use for heating, delivered energy and primary energy. Source: eERG
Energy carrier fP,nren fP,ren fP,tot
Natural gas 1,05 0,00 1,05
GPL 1,05 0,00 1,05
Diesel and combustible oil 1,07 0,00 1,07
Coal 1,10 0,00 1,10
Solid biomass 0,20 0,80 1,00
Liquid or gaseous biomass 0,40 0,60 1,00
Electrical energy from grid 1,95 0,47 2,42
District heating 1,50 0,00 1,50
District cooling 0,50 0,00 0,50
Thermal energy from solar collectors 0,00 1,00 1,00 Electrical energy from photovoltaic, mini-eolic and mini hydraulic 0,00 1,00 1,00 Thermal energy from the external environment - free cooling 0,00 1,00 1,00 Thermal energy from the external environment - heat pump 0,00 1,00 1,00
8
1.4. European situation
At the moment there is not a cross-Europe common understanding and agreement regarding the national implementation of the definition given by EPBD (Attia et al. 2017).
In the mentioned standard, there is a lot of space for national interpretation due to the lack of numeric thresholds. Member states are so allowed to define nZEB according to the specific climatic condition, calculation methodologies as well as construction practise (Bointner 2016; Paoletti et al. 2017). In addition, not all the member states had an official national definition of nZEB at the status in May 2016 (Fig.5).
Fig. 5: European cross- country situation for nZEB definition. Source: ZEBRA 2020.
In some European countries, like France and Austria, the nZEB requirements set limit values for the primary energy; for example the French standard fixes 110 kWh/m2 yr for office buildings, while Austria sets 170 kWh/m2 yr for non-residential buildings (Paoletti et al. 2017).
The Passivhaus standard instead fixes the maximum value for both heating and cooling energy need below 15 kWh/m2 yr.
In South Europe, the high solar radiation together with the high outdoor temperature and the heat island effect in cities, can make it difficult to ensure the energy need for cooling below the Passivhaus threshold (Attia et al. 2017), as shown in Tab.3. The different climates partially justify the disparity in the nZEB minimum requirements; however, the different terminology and definitions used at national level makes the comparison quite hard.
9
Tab. 3: status of nZEB definition in South Europe countries. Source: Attia et al. 2017
1.5. Italian Situation
1.5.1 Energy efficiency requirements in Italy
Italy is one of the countries that has already developed an official national definition of nZEB. The European directive 2010/31/UE has been implemented through Legislative Decree 4 June 2013, in which the qualitative definition of nZEB is reported, as described earlier. In addition, DM26/06/ 2015 describes exhaustively all the performance requirements that must be met to achieve the goal of nZEB. In particular, the nZEB must fulfil four requirements together with the ones regarding renewable on-site production defined in the Legislative Decree 3 March 2011.
The performance indicators of the building under study must be compared to the ones of the reference (virtual) building, which is an identical construction in terms of geometry, window/wall ratio, orientation, location and intended use; the thermal characteristics of the reference building are defined according to the climate zone in the tables in Appendix A of the DM26/06/2015(Fig.6).
10
Italy is divided in 8 climate zones, according to the degree-days, from A to F; the class A has the lowest values of degree days and is characterised by a hot weather, while class F includes the area with the most rigid climate (DPR 412/1993). The efficiencies, parameters and indexes of energy performance taken into account are described in Tab.4, Tab.5 and Tab.6.
Tab. 4: building parameters used in DM26/06/2015.
Tab. 5: nZEB requirements. Source: DM26/06/2015
Code Unit Description
H't [W/m2K] Transmission heat transfer coefficient per unit of thermal envelope area
Asol,est / Asup,utile [-] Equivalent summer solar area per unit of useful floor area
EPH,nd [kWh/m2] Energy need for heating
ηH [-] Average seasonal efficiency of the winter air conditioning system
EPH,tot [kWh] Total primary energy for winter air conditioning
EPW,nd [kWh/m2] Energy need for DHW
ηW [-] Average seasonal efficiency of the DHW system
EPW,tot [kWh] Total primary energy for DHW
EPV,tot [kWh] Total primary energy for ventilation EPC,nd [kWh/m2] Energy need for cooling
ηC [-] Average seasonal efficiency of the summer air conditioning system (including the moisture control) EPC,tot [kWh] Total primary energy for cooling
EPL,tot [kWh] Total primary energy for artificial lighting
EPT [kWh] Primary energy for transportation of people and things
EPgl,tot [kWh] Total global primary energy
BUILDING PARAMETERS
Number Description
i H'T < H'T,max
ii Asol,est / Asup,useful < (Asol,est / Asup,useful)max
iii EPH,nd < EPH,nd,limit EPC,nd < EPC,nd,limit EPgl,tot < Epgl,tot,limit iiii ηH > ηH,limit ηW > ηw,limit ηC > ηC,limit
11
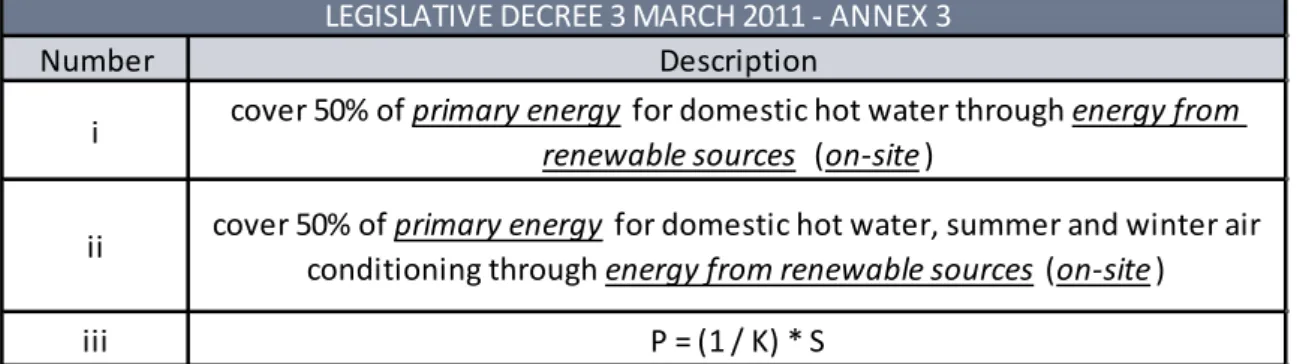
Tab. 6: nZEB requirements for renewable energy production. Source: Legislative Decree 3 March 2011 The four requirements represented in Tab.5are explained as follows.
i) The transmission heat transfer coefficient per unit of thermal envelope area is a parameter to control the quality of the building envelope in terms of transmission losses. It is calculated as:
𝐻𝐻′𝑇𝑇 = 𝐻𝐻𝑡𝑡𝑡𝑡,𝑎𝑎𝑎𝑎𝑎𝑎/ � 𝐴𝐴𝑘𝑘 [𝑚𝑚𝑊𝑊2𝐾𝐾] 𝑘𝑘
Where:
- Htr,adj [W/K] is the transmission heat transfer coefficient of the envelope calculated through ISO 14683:2007(E) and UNI/TS 11300-1;
- Ak is the area of the k-th component (opaque or transparent) of the envelope [m2]. ii) The equivalent summer solar area per unit of useful floor area is calculated as:
𝐴𝐴𝑠𝑠𝑠𝑠𝑠𝑠,𝑒𝑒𝑠𝑠𝑡𝑡
𝐴𝐴𝑠𝑠𝑠𝑠𝑠𝑠,𝑠𝑠𝑡𝑡𝑢𝑢𝑠𝑠𝑒𝑒
Where:
𝐴𝐴𝑠𝑠𝑠𝑠𝑠𝑠,𝑒𝑒𝑠𝑠𝑡𝑡= ∑ 𝐹𝐹𝑘𝑘 𝑠𝑠ℎ,𝑠𝑠𝑜𝑜∗ 𝑔𝑔𝑔𝑔𝑠𝑠+𝑠𝑠ℎ∗ (1 − 𝐹𝐹𝐹𝐹) ∗ 𝐴𝐴𝑤𝑤,𝑠𝑠∗ 𝐹𝐹𝑠𝑠𝑠𝑠𝑠𝑠,𝑒𝑒𝑠𝑠𝑡𝑡 [m2]
and:
- Fsh,ob [-] is the shading reduction factor for external elements for the area of actual solar capture of the k-th glass surface, reported in July;
- Ggl+sh [-] is the total solar energy transmittance of the window calculated in July when the solar shading system is used;
- FF [-] is the fraction of the area relative to the frame, the ratio between the projected area of the frame and the projected total area of the window component;
- Aw,p [m2] is the total projected area of the glazing component (window transparent area); - Fsol,est [-] is the correction factor for the incident irradiation, obtained as a ratio between the
average irradiance in July, location and exposure considered, and the average annual irradiance of Rome on a horizontal scale.
Number Description
i cover 50% of primary energy for domestic hot water through energy from renewable sources (on-site) ii cover 50% of primary energy for domestic hot water, summer and winter air conditioning through energy from renewable sources (on-site)
iii P = (1 / K) * S
12 iii) The total primary energy EPgl,tot is calculated as:
𝐸𝐸𝐸𝐸𝑔𝑔𝑠𝑠,𝑡𝑡𝑠𝑠𝑡𝑡=𝐸𝐸𝑃𝑃𝑔𝑔𝑠𝑠,𝑡𝑡𝑠𝑠𝑡𝑡𝐴𝐴 =𝐸𝐸𝑃𝑃𝑃𝑃,𝑡𝑡𝑠𝑠𝑡𝑡+ 𝐸𝐸𝑃𝑃𝑃𝑃,𝑡𝑡𝑠𝑠𝑡𝑡+ 𝐸𝐸𝑃𝑃𝑃𝑃,𝑡𝑡𝑠𝑠𝑡𝑡𝐴𝐴+ 𝐸𝐸𝑃𝑃𝑃𝑃,𝑡𝑡𝑠𝑠𝑡𝑡+ 𝐸𝐸𝑃𝑃𝑃𝑃,𝑡𝑡𝑠𝑠𝑡𝑡+ 𝐸𝐸𝑃𝑃𝑇𝑇,𝑡𝑡𝑠𝑠𝑡𝑡
Where:
- A is the useful floor area of the building [m2]
- EPi,tot is referred to the i-service and it is described in Tab. 4.
As per the three requirements represented in Tab.6, the power of the renewable service (P) is calculated according to the equation expressed in the Legislative Decree 3 March 2011, where: - K is equal to 50 m2/kW;
- S [m2] is the building surface at ground level.
The mentioned decree specifies that the obligations cannot be fulfilled with the only presence of renewable service for electric energy production.
The DM26/06/2015 (annex 1) clarifies also that the renewable on-site production can be counted: - Just to contribute to the same energy carrier (i.e. electricity with electricity);
- as long as the total corresponding monthly energy demand is covered. The overproduction of one month, produced on-site and exported, cannot be used to contribute to the energy performance of the building.
In summary, the Italian standards follows the same philosophy of the European Building Directive 2015. The approach states that the reduction of the energy need comes first and only then renewable sources come into play (Hermelink 2013). In Italy, a fixed maximum value of primary energy demand is not specified, but through the use of the reference building the threshold value is calculated every time accordingly to the location, geometry and intended use.
1.5.2 nZEB diffusion in Italy
A recent survey published by MIP Politecnico di Milano (MIP 2017) reports the number of nZEB in Italy, which has been estimated using different energy certification schemes, such as CasaClima, Passivhaus and LEED. Among all the classes of these energy certifications, the study considers just those coherent with the European definition of nearly Zero Energy Building. For instance, regarding the certification CasaClima, only the classes A and Gold are considered as nZEB.
The data coming from the mentioned energy certifications were crossed-referenced with the data related to the APE (“Attestato di Prestazione Energetica”) that is the mandatory energy
13
performance certificate. APE has been introduced by the DM26/06/2015 and provides a classification according to the global non-renewable primary energy; for the purpose of the study, the classes A2, A3 and A4 have been considered as nZEB.
Through the union of the two data sources (CasaClima, Passivhaus and LEED with APE), the number of nZEBs throughout the different Italian regions was evaluated between 650 and 850 units, of which 93 % are residential buildings.
Fig. 7: nZEB diffusion throughout Italy. Source: (MIP 2017)
The diffusion of nZEB in Italy is uneven from the geographical point of view: Lombardia and Trentino Alto Adige counts alone around half of the total number of nZEBs (Fig.7). This situation is a clear consequence of the different development policies followed by the Italian regions. Lombardia has anticipated the obligation to ensure the nZEB standard for new construction since 2016; Piemonte and Umbria prepared Good Practice Guide for building energy efficiency and detailed description of the work done, to share experience in this field. Trentino Alto-Adige established the obligation to reach CasaClima A since 2017 (ENEA 2016).
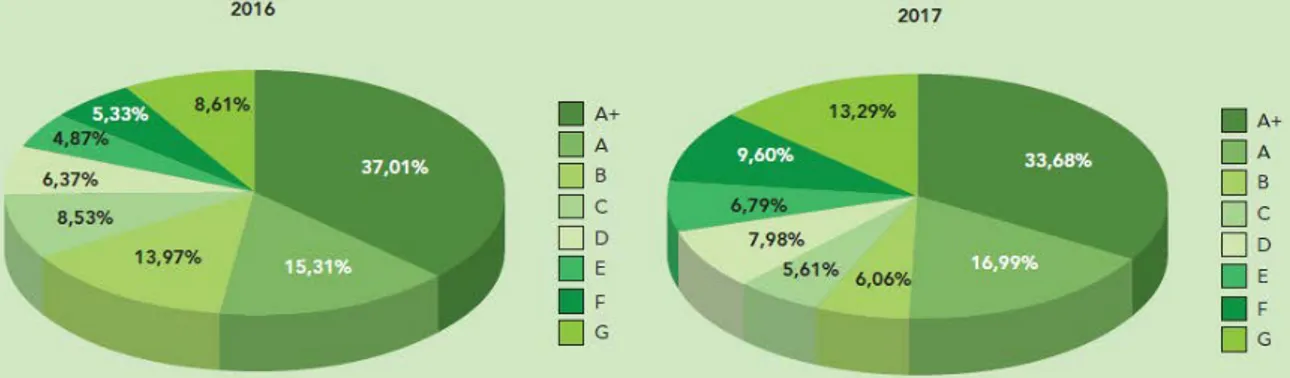
The case of Lombardia is interesting because, although the obligation to follow the nZEB standard has been anticipated to the 1st January 2016, the number of nZEBs built since this date represents only 3 % of the total and in addition the trend appears decreasing respect to the previous year. (Fig.8).
14
Fig. 8: Percentage of buildings energy certification classes in 2016 and 2017 in Lombardia. Italy. Source: (MIP 2017) In fact,in 2017 the percentage of A+ buildings (comparable to nZEB) is lower than the previous year (33.68 % versus 37.01 %), while the percentage of buildings in class F, G has increased (i.e. buildings in class G increased from 8,61 % to 13,29 %). The probable reason for this trend is due to the lack of definition of “built”, so this might include buildings completed after 2016, but whose building permit has been issued before 2016, hence before the entering into force of the nZEB obligation.
1.5.3 nZEB Barriers in Italy
In Italy, the construction of nZEBs can still be considered a niche market, due to their limited number and their position concentrated in few regions. The barriers to the diffusion of nZEBs deals with several fields such as economic feasibility, legal or social features, and also technical aspects. The main barriers to the diffusion of nZEBs in Italy are described as follows.
Economic feasibility
The strict energy performance required to a nZEB leads to high construction cost (ENEA 2016). The National Action Plan for nZEB (PANZEB), published in December 2016, identifies three main aspects:
- Improvement in the opaque envelope performance
Due to the first requirement regarding the transmission heat transfer coefficient per unit of thermal envelope area, the opaque envelope must guarantee very strict values in the thermal transmittance. Among all the possible solutions, the most adopted one is the increase in the thickness of the insulation layer. Considering common insulation material, such as EPS or XPS, usually an increase of 3 cm in its thickness it’s necessary, even though this value may be lower for the hot climatic area. Typically, the additional cost for this insulation improvement is around (1,5 - 3) €/cm per unit of opaque surface.
15
- Improvement in the transparent envelope performance
The need to improve the glazing surface performance is caused again by the first requirements of nZEB, because H’T is calculated through all the envelope components. In this case, there are many technical solutions and they depend strongly on the climatic condition. The average increase in the window’s cost is around 40 € per unit of glazing surface, but it may arrive up to 70 €/m2. - Improvement in the systems
The percentage of primary energy (for heating, cooling and domestic hot water) covered by renewable on-site production is higher compared to the building constructed before 2017. The Legislative Decree 3 March 2011 set the percentage at 20 % until the end of 2015 and 35 % until the end of 2016. Since 1 January 2017, all new building, including nZEB, must satisfy 50 % of renewable cover. In addition, the thermal system efficiency must be greater than the correspondent values calculated for the reference building (4th requirements for nZEB of DM26/06/2015).
As an example, the extra-cost between nZEBs and buildings following the standard in force in 2016, has been evaluated for a single-family house, an office building and a multi-family building, located in climatic area B or E, as shown in Fig.9(in 2016 the nZEB goal was not mandatory). The increase in the cost varies from 35 €/m2 for an office building located in area B up to 91 €/m2 for a multi-family building located in area E. For the residential sector (both multifamily or single-family house), most part of the cost rise is due to the services, while for the office building the increase is quite balanced between services and envelope, because the glazing part plays an important role.
16
In the Energy Efficiency Report 2017 there is another comparison between building in class A and nZEB with the same building category division (Tab.7).
This comparison provides a very simplified economic analysis through the payback time that is defined as the time it takes to cover investment costs (ISO 15686-5:2017).
The single house building has the highest range of percentage extra cost, varying between 15 % and 30 %. The balance between the construction cost and the cost saving due to energy efficiency of nZEB requires a lot of time, bringing the payback time to a period higher than the useful life of the building (considered equal to 50 years).
The multi-family building instead has a shorter range of possible extra cost, varying between 20 % and 25 %, but also in this case the payback time is higher than the useful life of the building. The office building instead is the only category whose payback time is lower than the useful life, ranging between 30 to 40 years.
Tab. 7: Performance and economical difference between standard building and nZEB. Source EER 2017 For these reasons, the additional annual energy/cost saving of a nZEB compared to the one of a standard building, hardly guarantees a short payback time (MIP 2017). The high initial investment is a feature regarding most part of nZEBs and the first challenge is finding alternative affordable solutions, mainly turned to the designers.
Anyway, it’s worth noting that the cost analysis should be performed with adequate indicators, like the internal return rate described in detailed in the 2 Chapter; the oversimplified terms, such as the simple payback time shouldn’t be used alone because they don’t consider the variable value of money in time. In fact, the typical nZEBs are characterised by long time in payback time, even though the internal rate or return is usually high (Isaac, Tronca, and Gajsak 2016).
Standard building [€/m2] Extra cost of nZEB [-]
Building type Construction cost Payback time of nZEB
COMPARISON BETWEEN STANDARD BUILDING AND nZEB
Single family
house 1200 – 1600 15 % - 30 % > Useful life
Office 800 - 1200 15 % - 25 % 30 – 40 years
Multi-family
17
Lack of knowledge
The second barrier is related to the lack of knowledge and experience about correct alternatives to adopt. There is never a unique solution to reach the goal of nearly zero energy, but the available choices must be carefully evaluated and combined in relation to the climatic and social conditions.
The lack of knowledge is referred to technological expertise towards innovation as well as passive strategies understanding. The knowledge of the multiple alternatives is the first step to reach the most performant solution that must be an adequate choice for the specific climate; for example, the use of natural night ventilation for residential buildings in urban areas might be possible only if acoustic and pollution issues are taken into account during the design phase. In addition the experience in highly energy efficient buildings, regarding both the designers and the constructors, can led to lower costs due to the “learning by doing effect” (Isaac, Tronca, and Gajsak 2016). For these reasons the project of nZEBs requires high qualifications for the designers in the building field (Bointner 2016), considering also that they should guarantee the building energy efficiency as well as the indoor comfort conditions.
For instance, the risk of overheating can be a problem in case the energy concept of nZEB is directly borrowed from northern countries throughout Italy (Attia et al. 2017). In Germany and other northern countries, the winter is the dominant season as a matter of energy demand while in Italy the building envelope must be designed according to its behaviour both during the winter and summer season.
Methodological approach
To ensure the expected energetic performance of the building, the methodological approach of the design is a key aspect. Most designers in Southern Europe rely on steady-state simulation tools, based on the EN standard, although this procedure does not represent the real expected building performance.
The static or quasi-static calculation are often used with high confidence, without any critical estimation of the uncertainty of the results and also the input values, such as the weather file, the building material properties and the effect of occupant behaviour.
Lack of regional plans
The lack of regional plans is another significant problem because according to PANZEB 2016 just few regions promote programs to encourage the diffusion of nZEBs. Usually the local authorities are not in contact with the local research centre to understand the meaning of nZEBs (Attia et al.
18
2017). Because of the different climatic conditions throughout the Italian regions, it’s very important to set local guidelines to achieve nZEB. The involvement of local authorities in pilot projects can be a good starting point to speed up the development of innovative projects (Bointner 2016).
Management of data
The inadequate management of territorial data is another important feature. The data collected by different subjects e.g. tax deductions, energy performance certificates, thermal plant efficiencies, etc. should be made more easily accessible to local authorities to measure effectiveness of the policies (ENEA 2016). Furthermore, the continuous monitoring of the performances and the costs can help demonstrate the functioning of the strategies adopted, as well as find possible improvements.
Financial incentives
In Italy, there are some financial incentives to promote nZEBs, but they mainly deal with buildings renovations. They are:
- “Fondo nazionale per l’efficienza energetica”, addressed only to the public sector; - “Fondo Kyoto”, addressed only to the public sector for school buildings;
- “Conto Termico”, addressed mainly for public sector but also for private customers. The public adimistrations can make use of this incentive both for envelope and service renovation, while private individuals have benefits just for small renewable energy service renovation. This bonus may be addressed also to new building, but it’s limited to specific interventions, such as solar thermal panels [4].
Users
Another barrier is related directly to the end users of the buildings. Due to the low awareness about the energy efficiency, the lack of interest towards the nZEB solution may lead to the so-called “rebound effect”.
Among all the definitions, the rebound effect can be expressed as the ratio of the “lost energy savings on the assessed energy savings” (Santamouris 2016) or “the behavioural or other systemic response to a measure taken to reduce environmental impacts that offsets the effect of the measure” (Bourrelle 2014).
In the building sector the rebound effect is split into the microeconomic effects that take place at the household level, and the macroeconomic effects that are wider economy implications.
19
In particular, the microeconomic effect related to the user’s behaviour may influence the predicted energy performance of the building. Since the energy efficiency reduces the cost of energy service, the users may choose to improve the comfort condition with respect to the standard one (i.e. the temperature set point of the heating system), and to increase the period of use. Thus, the behaviour of the users may reduce significantly the predicted energy savings, with consequences both from the energy and economy point of view.
Improvement in the user education and awareness may decrease the rebound effect and narrow the difference between the actual and the expected building performance.
20
2. Building design objectives
The present chapter deals with other objectives that must be considered during the design process, together with the energy performance (e.g. visual and acoustic comfort, IAQ, aesthetics and functionality). The focus regards thermal comfort and costs.
2.1. Thermal Comfort
The ASHRAE 55:2017 defines the thermal comfort as “the condition of mind that expresses satisfaction with the thermal environment and is assessed by subjective evaluation.”
The energy consumption of a building strongly depends on the criteria set for the indoor comfort condition(Olesen 2012). The discomfort leads the occupants to take actions to reach a state of comfort, such as increasing the cooling power in a mechanical ventilated building; these actions may have energy implications.
In addition, several researches state that a good environmental quality improves productivity and learning performance of the dwellers (Olesen 2007; Rupp, Vásquez, and Lamberts 2015), even though the dispersion of data is quite large in some of these analysis.
Consequently, the thermal comfort assessment has a key role in the design process and must be considered together with the energy performance during the assessment of energy-saving measures.
The assessment of thermal comfort is explained at the European level through the EN 15251:2007, where the comfort criteria for the thermal environment are set differently for buildings with and without mechanical cooling. The main variables taken into account are the ventilation rate of the outside air and the operative temperature.
The ventilation rate is specified in the standard according to the occupancy level and the floor area of the space (Olesen 2012). The purpose of the air exchange is the preservation of good air quality, through the compensation of the emission coming from the people and their activity as well as building components; in the standard there are different methods for the calculation of the required ventilation rate, whose common criteria depends on the pollution level of the building.
As the driving force of the thermal comfort, the models for the temperature assessment are deeply investigated in the present paragraph, distinguishing between buildings with and without mechanical system.
21
2.1.1 Buildings with mechanical heating/cooling system
In buildings equipped with mechanical cooling, the Fanger model is used to assess the thermal comfort. Based on as steady-state approach, the model developed by Fanger in the 1970s aims at predicting the mean thermal sensation of a group of people and their respective percentage of dissatisfaction with the thermal environments, through the PMV and PPD indexes (Rupp, Vásquez, and Lamberts 2015).
“The PMV (predicted mean vote) is an index that predicts the mean value of the votes of a large group of persons on the 7-point thermal sensation scale, based on the heat balance of the human body” (ISO 7730:2005).
The PPD (predicted person dissatisfied) is another index expressing the prediction of the percentage of people thermally dissatisfied; it is calculated through the PMV, assuming that 5 % of people dissatisfaction can be expected under thermal neutrality condition.
Depending on the human expectations, every building type is divided in 4 categories (Tab.8). Every category is associated to a specific comfort range, written through PMV, PPD or operative temperature that represents the main design criterion.
The building under study is considered inside a specific comfort category if the parameters represent 95 % of the occupied space (Pagliano and Zangheri 2010).
The standard allows the designers choosing between two possible procedures.
PMV-PPD criteria
The direct calculation of the PMV requires the values of 4 environmental parameters as air temperature, mean radiant temperature, air velocity and humidity plus 2 personal parameters as activity and clothing (Romana et al. 2014).
The cited environmental parameters are related to building features, such as the heating and cooling systems or the building envelope; the personal parameters instead are harder to estimate, and they are assumed depending on the season and space function.
Once the 6 mentioned values are known, the PMV and PPD indexes can be calculated through the formulas present in ISO 7730:2005; in the last step the results are compared to the range of the target category (Tab.9). If the range is not always fulfilled, the procedure continues with the estimation of the frequency of the discomfort condition through long term evaluation methods (EN 15251:2007), which are detailed described in the paragraph 2.1.3.
22
Tab. 8: Comfort category definition. Source: EN 15251:2007
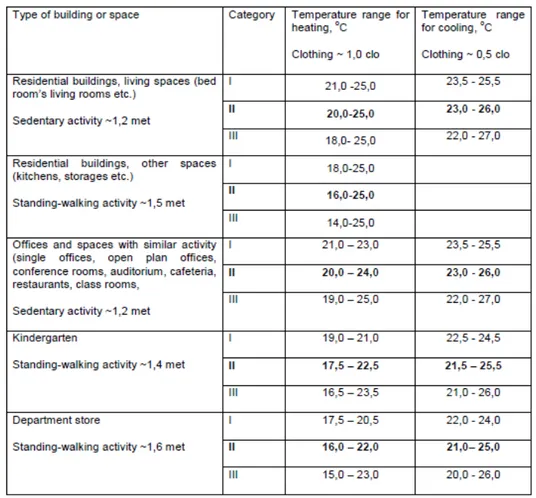
Tab. 9: Temperatures ranges for some building categories in the Fanger Model. Source: EN 15251:2007 Temperature criteria
The second method does not include any calculation regarding the cited indexes because the design criteria are set through temperature ranges. The standard provides comfort ranges of operative temperature corresponding to specific PMV ranges (Tab.10), thanks to the assumption about type of clothing and activity of occupants, together with 50 % of relative humidity. The temperature range is specified for each season (winter and summer) since it’ based on different clothing level hypothesis.
The upper values of the comfort range must be used to design the cooling system and to calculate the corresponding energy demand while the lower values are the references for the heating system.
23
Tab. 10: Temperatures ranges for some building categories in the Fanger Model. Source: EN 15251
2.1.2 Buildings without mechanical cooling
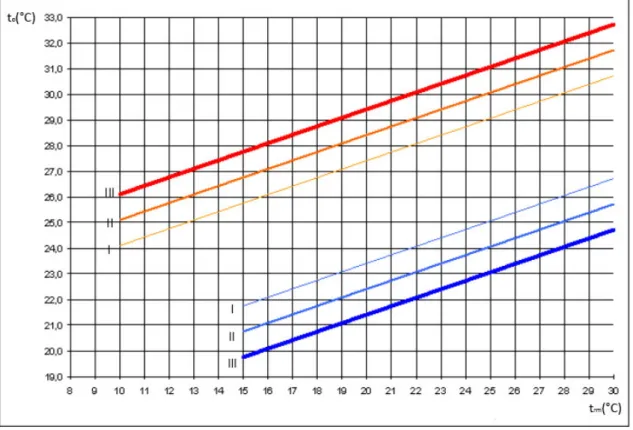
If the building is not provided by mechanical cooling, the criteria for the thermal environment may be specified through the Fanger model, already described, or through the adaptive model. The adaptive model is based on the different expectation of the users (between buildings with and without mechanical cooling) and the strong link between their adaptation and the outdoor climatic conditions (Olesen 2007); in fact, the acceptable indoor operative temperature is evaluated according to the external one. The comfort reference is expressed through the running mean external temperature that is “the exponentially weighted running mean of the daily external air temperature” (EN 15251:2007). The simplified formula for its calculation is the following:
𝑡𝑡𝑡𝑡𝑚𝑚=(𝑡𝑡𝑒𝑒𝑎𝑎−1+ 0,8 × 𝑡𝑡𝑒𝑒𝑎𝑎−2+ 0,6 × 𝑡𝑡𝑒𝑒𝑎𝑎−3+ 0,5 × 𝑡𝑡𝑒𝑒𝑎𝑎−43.8 + 0,4 × 𝑡𝑡𝑒𝑒𝑎𝑎−5+ 0,3 × 𝑡𝑡𝑒𝑒𝑎𝑎−6+ 0,2 × 𝑡𝑡𝑒𝑒𝑎𝑎−7) Where:
- trm [°C] is the running mean temperature for today.