POLITECNICO DI MILANO
School of Industrial and Information Engineering
Department of Electronics, Information and
Bioengineering
Master of Science in Computer Engineering
BehViz: A Smart House Monitoring
System
Supervisor: Prof. Sara Comai
Co-Supervisor: Dr. Andrea Masciadri
Candidate:
Mahsa Sedghi
Matr. 842111
Academic Year 2020-2021Acknowledgement
I wish to show my deep appreciation to the ones who helped me finalize my thesis.
I would like to express my gratitude to my supervisor, Prof. Sara Comai, whose valuable advices, supports, and guidance made me capable of doing this thesis, and also my assistant supervisor, Dr. Andrea Masciadri.
I wish to extend my special thanks to, my family and friends who supported me and offered deep insight into the study.
Ringraziamenti
Desidero mostrare il mia profondo apprezzamento a coloro che mi hanno aiutato a finalizzare la mia tesi.
Vorrei esprimere la mia gratitudine al mia supervisore, il Prof. Sara Comai, i cui preziosi consigli, supporti e indicazioni mi hanno reso capace di fare questa tesi, e anche il mia assistente relatore, il Dr. Andrea Masciadri. Desidero estendere i miei ringraziamenti speciali alla mia famiglia e ai miei amici che mi hanno supportato e offerto una visione profonda dello studio.
Contents
Abstract X Sommario XI 1 Introduction 1 2 Background 3 2.1 Smart Systems . . . 3 2.2 Data . . . 4 2.2.1 Data missing . . . 4 2.2.2 Data cleaning . . . 5 2.3 Data Visualization . . . 6 2.4 Smart environment . . . 72.4.1 Smart home demo . . . 9
2.5 BRIDGe platform . . . 9
2.6 The BRIDGe architecture . . . 11
2.7 Sensors in BRIDGe . . . 12 2.8 QT framework and QML . . . 13 3 Related Works 14 3.1 Dynamic Graphs . . . 14 3.2 Bar Graphs . . . 15 3.3 CASAS project . . . 15
4 The visualization methodology 18 4.1 Visualization dimensions . . . 18
4.1.1 Duration-based dimension . . . 19
4.1.2 Frequency-based dimension . . . 19
4.1.3 Sequence-based dimension . . . 20
4.2 Time windows . . . 20
4.3 The proposed tool . . . 21
4.3.1 Architecture . . . 21
4.3.2 Demonstration . . . 23
5 Validation 27 5.1 Preprocessing of the Case Study Data . . . 27
5.2 Case study Data . . . 28
5.3 Procedure . . . 30 5.4 Experimental Results . . . 31 5.4.1 Duration Dimension . . . 32 5.4.2 Frequency Dimension . . . 33 5.4.3 Sequence Dimension . . . 34 6 Conclusions 39 Bibliography 40
List of Abbreviations
WHO World Health Organization BehViz Behavioral Visualizer CPS Cyber-physical systems CPSS Cyber-physical-social systems MCAR Missing Completely At Random
MAR Missing At Random
NMAR Not Missing At Random ADLs Activities of Daily Livings
BRIDGe Behavioral Drift compensation for autonomous and InDependent livinG AmI Ambient Intelligence Systems
IOT Internet of Things
IR Infra-Red
PIR Passive Infra-Red
RFID Radio Frequency Identification ATG Assistive Technology Group AAL Ambient Assisted Living
CRAiS Resource Center for Autonomy and Social Inclusion VCI Vocal Command Interface
RF Radio-Frequency
IHL Indoor Human Localization BFS breadth-first search
List of Figures
2.1 Types of data missing. . . 5
2.2 Akoff’s definition of data, information, and knowledge. . . 7
2.3 Map of the smart home demo. . . 10
2.4 The BRIDGe Architecture. . . 11
3.1 Number of publications yearly. . . 14
3.2 Hierarchical taxonomy of dynamic graph. . . 15
3.3 Test instances of activities. . . 16
3.4 CASAS activity trend for a smart home inhabitant. . . 17
4.1 Component diagram of the proposed system. . . 22
4.2 Class diagram of the Behavioral Visualizer (BehViz). . . 22
4.3 Duration of staying in each room using a donut chart in work-ing/weekend time frame. . . 24
4.4 The number of visited each room using a bar chart in work-ing/weekend time frame. . . 25
4.5 The sequence of transitions inside the home. . . 26
5.1 An example of the textual representation of data. . . 29
5.2 An example of data cleaning. . . 29
5.3 An example of recovered missed records using data cleaning module. . . 32
5.4 Duration of staying in each room in working day/weekend time frame during one week. . . 33
5.5 duration of staying in each room in parts of the day time frame during one week. . . 34
5.6 Duration of staying in each room in daily time frame during one week. . . 35
5.7 Number of visited each room in working day/weekend time frame during one week. . . 36 5.8 Number of visited each room in parts of day time frame during
one week. . . 37 5.9 Number of visited each room in daily time frame during one
week. . . 37 5.10 Sequences of transitions during one week . . . 38
List of Tables
5.1 Incompatibility between manual data and sensor data . . . 28 5.2 Adjacency-matrix for the rooms. . . 30
Abstract
Since population aging is increasing enormously, paying attention to elderly health becomes challenging these days. Health is an important factor that should be considered for protecting people. Since they prefer to stay at home even if they do not feel well, it is vital to create a system to monitor their behaviors to provide them security and health.
Most smart homes are equipped with sensors that generate a stream of data that indicates the inhabitant’s presence in the smart home. In such a context, our work provides a solution to convey perceptual and simplified information in a visual form: Behavioral visualizer (BehViz) aims to monitor the inhabitant to determine any changes in behavior.
Since data visualization is a technique that manages data representation, BehViz is a system that visualizes data through appropriate representations able the user of the system to monitor the inhabitant’s behavior and gain knowledge from the represented data. In particular, our system provides plots with information related to visualizing behavior at different time granularities: duration spent in each room, frequency of visiting each room, and sequences entering each room of the smart house. As a result, the system improves the monitoring of the information obtained from the sensor states.
Sommario
Poich´e l’invecchiamento della popolazione sta aumentando enormemente, prestare attenzione alla salute degli anziani diventa oggigiorno una sfida. La salute `e un fat-tore importante che dovrebbe essere considerato per proteggere le persone. Poich´e preferiscono rimanere a casa anche se non si sentono bene, `e fondamentale creare un sistema per monitorare i loro comportamenti per fornire loro sicurezza e salute. La maggior parte delle case intelligenti `e dotata di sensori che generano un flusso di dati che indica la presenza dell’abitante nella casa intelligente. In un tale contesto, il nostro lavoro fornisce una soluzione per trasmettere informazioni percettive e semplificate in forma visiva: il visualizzatore comportamentale (BehViz) mira a monitorare l’abitante per determinare eventuali cambiamenti nel comportamento. Poich´e la visualizzazione dei dati `e una tecnica che gestisce la rappresentazione dei dati, BehViz `e un sistema che visualizza i dati attraverso rappresentazioni appro-priate in grado l’utente del sistema di monitorare il comportamento dell’abitante e acquisire conoscenza dai dati rappresentati. In particolare, il nostro sistema for-nisce grafici con informazioni relative alla visualizzazione del comportamento in diverse granularit`a temporali: durata trascorsa in ogni stanza, frequenza di visita in ogni stanza e sequenze che entrano in ogni stanza della casa intelligente. Di conseguenza, il sistema migliora il monitoraggio delle informazioni ottenute dagli stati del sensore.
Chapter 1
Introduction
More recently, considerable population growth is an important issue that results in the continuously growing number of elderly is one of the motiva-tions for smart home research. According to the World Health Organization (WHO), the world’s elderly population (defined as people aged 60 and older) has increased drastically in the past decades and will reach about 2 billion in 2050 [1].
In every person’s life, old age defines a new phase, as they face issues, pre-cisely health issues. A majority of the elderly may suffer from age-related conditions such as Parkinson’s disease, diabetes disease, Alzheimer’s disease, and physical function limitations. Health is an essential factor that has a direct effect on a person’s behavior. So, we decide to monitor the inhabi-tant’s behavioral pattern to identify any anomaly in behavior that ensures the safety of the inhabitant in performing a daily activity. Moreover, it can prevent certain medical conditions.
This work presents an approach that allows the system’s user to monitor an inhabitant effectively inside a smart home. We design and implement a system that helps to visualize the inhabitant’s behavioral pattern, which is discussed in Chapter 4, as it can provide valuable information about the inhabitant to the user of the system and it can result in early identification of behavioral changes in the inhabitant of the smart home which can prevent medical conditions. We visualize the anomalies and changes in behavioral
patterns such as missing data points by using the information of the order of the sensor events, the number of events, and time slots. We evaluate the proposed approach using an available smart home data set. The data used in our work are from unobtrusive sensors as Passive Infra-Red (PIR) sensors or contact sensors; the former generates a binary value that indicates the inhabitant’s presence in the specific area the latter detects the entrance and exit of the inhabitant. The results demonstrate its effectiveness in visualizing regular and anomalous behaviors.
Chapter 2
Background
This chapter provides the background information needed to understand bet-ter the topics discussed in this work. The research of the papers and con-tents aims at learning if this kind of problem has already been addressed and eventually how it has been solved. In the beginning, we depict the context-awareness, an abstract of smart systems then we have a description of data. Next, we explain the potential drift, data visualization, smart environment, sensors, and finally, we describe the QT framework and QML.
2.1
Smart Systems
The “smart” keyword was recently used to define the existence of artificial intelligence algorithms in different technological systems. This feature can obtain knowledge based on the information obtained from the environment and the ability to learn and represent the systems that operate [5].
Availability of a large amount of data has a direct relationship with the advent and rapid growth of intelligent technologies, recently revolution in in-formation technology, and even in the entire society with the fourth industrial revolution, also known as industry 4.0 at the center of digital transformation. Cyber-physical systems (CPS) constitute the main innovative element within this framework: for monitoring, control the purposes, and stimulated pur-poses, these systems visualize the collaboration between physical systems and
computer systems at different levels [12]. To describe more in-depth Cyber-physical-social systems (CPSS) construct services for the entire society which are eco-friendly and suitable for individuals requirements to consider the in-teraction of additional social component.
2.2
Data
Data is the raw information that should reshape into the form to be useful for processing and movement. Qualitative and quantitative variables are a set of values which represent the concept of data.
2.2.1
Data missing
(MCAR) missing completely at random: Refer to the data, which missing mechanism does not depend on any variable observed in the data set. In fact, data is collected, missed, and observed randomly.
(MAR) missing at random: This means missing but at random and condi-tional on other variables observed in the data set.
(NMAR) not missing at random: This one is the most challenging condition to model. NMAR occurs when the missing mechanism is depending on the actual value of the missing data [8].
Data missing types are represented in Figure 2.1: Solution
• Case deletion: Depends on the analysis, and the cases that contain missing data are deleted. This can be done list-wise or pair-wise avail-able cases.
• Single imputation: This can include group means, medians, or modes that depend on the data. However, end-users mostly need a single complete data set. Other examples are single imputations are regression imputation, stochastic regression imputation, etc.
• Multiple imputations: However, multiple imputations are always better than two previous ones but may be avoided by the end-user.
Figure 2.1: Types of data missing.
• Minimize bias
• Regular software & techniques • Standard analysis
Disadvantages of imputation:
• Imputation allowed to be affected by data.
• Imputed data is not real data, and variance estimation reflects this uncertainty.
• Single imputation nearly gives reduced variance estimates, so do not reflect uncertainty because of imputation.
2.2.2
Data cleaning
Data cleaning is not about removing or ignoring information but about an-alyzing data to make some corrections needed. It also manages the data. It is a benefit for some information which needed to be updated [13].
For example, every five years, some information may change, so data cleaning manages them by changes the data which is missing or incorrect, etc. Thus, this cleanup is needed to be done regularly but not so often.
Data cleansing focuses more on update information to make sure that the system is as effective as possible.
The other advantage of data cleansing is organized the data. In this way, we can reach the critical and recent data easily and as fast as possible.
A short recap on the advantages of data cleaning:
• How to deal with data and the errors that happen in different data sources.
• Gain precise information as fast as possible to improve performance in business.
• Achieve useful data.
• Causes reduce mistakes in data. • Trace data easily.
2.3
Data Visualization
Visualization is a technique for communicating a message by using images, animations, and diagrams. Also, it is a beneficial technique in computer science. It represents information and data graphically. Data visualization tools help to see and understand trends, outliers, and patterns in data. In the case of big data, data visualization tools analyze information and make data-driven decisions.
Union of research areas such as computer science, information design, and human perception provide strong inspiration for data visualization.
Data visualization behaves like a visual communication that is able to visu-alize the information in a graphical representation [20]. Data visualization’s primary goal is to convey information clearly and efficiently by using statis-tical graphs, bars, and information graphics through quantitative messages, which can be helpful for ordinary people to have access to understandable and usable data easily. So, numerical data can be represented by using dots, lines, and bars. Two types of primary information that should be displayed are divided into tables, charts, or graphs. The first one provides a specific measurement for users. The second one (charts, graphs) contains various
types that represent patterns and relationships in data in the case of one or more variables.
Data visualization follows three basic patterns: providing a piece of record-ing information, processrecord-ing information, and communicatrecord-ing the information across an audience [4]. The information extracted from data and conveyed to users should be based on the quality to let the human brain can extract and understand it.
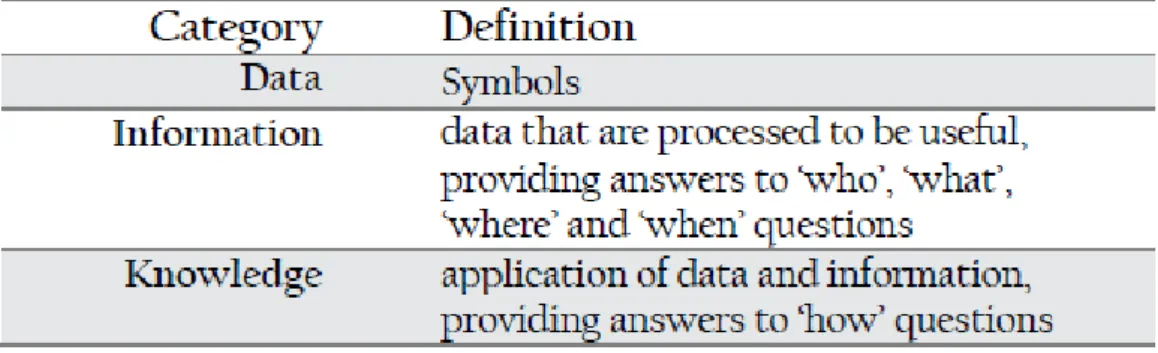
Figure 2.2 represents three terms in data visualization, which is categorized into data, information, and knowledge. Figure 2.2 defines the terms as Ack-off’s point of view, which refers to the conceptual and cognitive space [9].
Figure 2.2: Akoff’s definition of data, information, and knowledge.
Because of the way the human brain processes information, it is better to use charts to visualize a large amount of data instead of using spreadsheets or reports. Data visualization is capable of communicating concepts quickly that can be caught universally.
2.4
Smart environment
As studied in [15] we want to monitor a person in his/her house with respect to keep the privacy, security, and moral aspects. On the other side, we need to focus on the practical problems related to the systems we can use to minimize the disturbance affected by monitored persons.
Based on the previous BRIDGe (Behavioral Drift compensation for autonomous and inDependent LivinG ) project, which we explain in this chapter in de-tail, we decide to focus on monitoring the environment through commercial wireless sensors (e.g., motion sensors, contact switches, etc.)
Smart home technologies are exploited by many projects such as [3], which provides health care systems supporting brittle people at home. The ability to recognize the behavioral changes in elderly people, specifically when they live alone, is still a challenge for assistive technology. A vital factor to monitor and look into the home events is activity recognition from environmental sensor data.
Home automation devices and Ambient Intelligence Systems (AmI) are the equipment installed in an environment such as a smart home. The home automation term represents the automation systems used to monitor and control the devices installed in the house remotely, while “smart” consists of the interactive technologies that make the home smart, which is also studied in [11].
Recently, because of the smart home’s ability to solve many issues in various fields, we can see that people are interested more in smart environments. We will focus on health care systems which have the intention to support elderly people to be independent in their home [6]. With IoT (Internet of Things), which is also explained in this chapter, we can connect, monitor, learn, control, and search for information and objects remotely.
Some of the most used environmental sensors as studied in [15] are including:
• Active or Passive Infrared Motion (AIR/PIR) and ultrasonic: can de-tect people and object movements;
• Smoke, Gas, Humidity, Temperature, and Luminance: can check the rooms and places features;
• Smart tiles: can measure pressure on the floors;
• Radio Frequency Identification (RFID): can identify and track infor-mation from objects with RFID tags
• Force and pressure: can detect the person’s presence; • Magnetic switches: can detect movement of doors;
• Electrical power consumption: can detect home appliance operations; • Camera and Microphone: can record videos and environment sounds
2.4.1
Smart home demo
According to Andrea et al. [ [15], adopting the demo environment has been done by adopting ready technology. The hardware part has been retrieved from the market [16]. The devices installed are including one home center to receive data from the wireless sensors and transmit them to a central server, one PIR sensor for each room and corridor, one Electrical power consumption sensor for each house appliance and one Magnetic switch for each door, window and closet. We have represented the tested house which is represented in Figure 2.3 which is composed of seven rooms: a kitchen, a living room, a corridor, two bathrooms, and three bedrooms. The central server was hosted on the datacenter made available by our university. This server is responsible for receiving data from the houses, saving them, and making them available to the authorized users via the web interface.
2.5
BRIDGe platform
Smart sensors which are using BRIDGe platform installed in a domestic environment which is also executed in our algorithm [14].
Behavior dRift compensation for autonomous and InDependent living (BRIDGe) is an ambitious platform that is implemented by ATG (Assistive Technology Group). It is about developing an AAL (Ambient Assisted Living) system based on wireless sensors that connect via a monitoring structure. The target is elderly people who have physical or cognitive disabilities, but we want to keep their independence while supervising them [10].
Another advantage of BRIDGe is the allowance of installing a system inside the user’s residence (elderly people), which is a non-invasive and economical wireless sensor that lets us track daily behavior of the person’s activity and evaluate health conditions by remote monitoring. Hence, it can interfere if unexpected behavior or something against routine occurs.
Assistive Technology Group (ATG) is a multidisciplinary working group that aims at helping elderly, disabled people, and people come across difficulties by identifying, forecasting, implementing, and applying innovative methods and techniques to improve feasible solutions. This group’s other intention is to guarantee the recovery of functionality, social integration, equality in opportunities, health, self-determination, and quality of life, which can also
Figure 2.3: Map of the smart home demo.
be acknowledged by digital inclusion in essential aspects.
CRAiS (Resource Center for Autonomy and Social Inclusion) is a worthwhile project to develop an autonomy route and let people with fragility and social vulnerability take part so their family and caregivers will be supported. As a result, CRAiS’s recommendation is services and tools customized, and a multidisciplinary team with social, educational, and technological skills can manage them.
2.6
The BRIDGe architecture
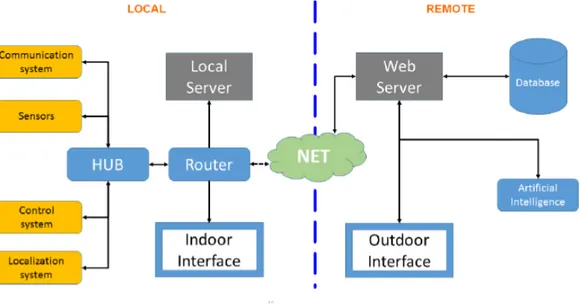
According to [10], BRIDGe structure divides into two subsystems which are shown in (Figure 2.4) a local system and a remote one. The former is includ-ing home automation devices, sensors, and local server; it connects smart home components which are autonomous to enable them swap information and provide means of monitoring the whole house.
Figure 2.4: The BRIDGe Architecture.
On the other side, the remote subsystem makes sure that the long-term data stored in the local subsystem is detected and used for later analysis over a long time.
Furthermore, it makes sure to remote home monitoring for different users and provides relevant information for relatives and caregivers of the residence. This subsystem consists of three main layers: the User Authorization and Profiling, the User Interface, and Remote Service Provider. The latter has a long-term data storage used for the analysis of behavior and visualizing aggregated information. The comparison of real-time data and historically recorded data is determining by potential behavioral drifts.
In the following the explanation of BRIDGe services comes in four categories: • Home Control: generate information about the house by installed
sensors, e.g., humidity, temperature, opening/closing doors, etc.; chang-ing the status of devices in the house by installed actuators, e.g., shut-ters rolling, lights switching, etc.;
• Social Media Notification: in case of necessity, BRIDGe uses Twit-ter as a messaging system to submit notifications or warnings,
• Vocal Interaction: BRIDGe uses VCI (Vocal Command Interface) to allow vocal commands from the user, e.g., switch off the light; • Indoor Localization: present the current position of a specific person
in the house as mention in [18]; a Radio-Frequency (RF) based IHL (Indoor Human Localization) system can identify the person who is standing, walking, laying, or falling. Generation of a set of coordinates on the map and a range of confidence is done by position data.
2.7
Sensors in BRIDGe
Selecting suitable sensors is an essential factor that has some typical con-straints among BRIDGe developers. These concon-straints are including the to-tal cost of applied sensors along with the non-invasiveness type of the same. Therefore wearable devices such as microphones and cameras also have in-trusive nature, ignored from the project as studied in [10].
In the following, there is a list of sensors installed in smart home: • Consumption sensors (light and energy):
Consumption sensors are the sensors that keep track of each consumed quantity in each measure. The electrical power sensors install between the plug and the power to detect when the appliance is turned on or monitoring overall energy consumption.
• PIR (Passive Infra-Red):
PIR sensors are the sensors that measure from objects the radiation from the infrared (IR) lights in their field of view. Infra-Red usually uses to detect people in motion without using any camera. The output of this sensor is a sequence of zero and one that indicates the inhabi-tant’s presence.
• Ambient sensors:
Ambient sensors are the sensors that inspect the temperature, humid-ity, luminoshumid-ity, or smoke. Using these sensors, the accurate measure-ment of temperature or humidity would be difficult because they in-clude a certain level of errors during readings.
• Distance sensors:
Distance sensors can keep track of the inhabitant’s presence while he moves towards the objects.
• Contact sensors:
Contact sensors are the sensors that measure the movement of the door when it is opening or closing. The sensor sends a signal when two components get in touch.
2.8
QT framework and QML
Qt is a C++ cross-platform framework that can be used to develop a graphi-cal interface. It can be used to develop the user interface for various platforms such as Linux, OS X, Windows, VxWorks, QNX, Android, iOS, BlackBerry, Sailfish OS, and others. One of the main advantages is to write less code and deploy it everywhere. It also provides a huge number of modules that facilitate the development process for various platforms. Out there, some important applications are written using the Qt framework, such as Maya, Sailfish OS, CryEngine, and so on.
QML is a declarative language that is used to develop a front-end interface by providing a JSON-like syntax. It also supports imperative JavaScript ex-pression. QML is written in C++ and incorporates the GPU for acceleration calculation.
Chapter 3
Related Works
In this chapter we provide some of the relevant state-of-the-art methodologies for graphical representation of the smart home data.
3.1
Dynamic Graphs
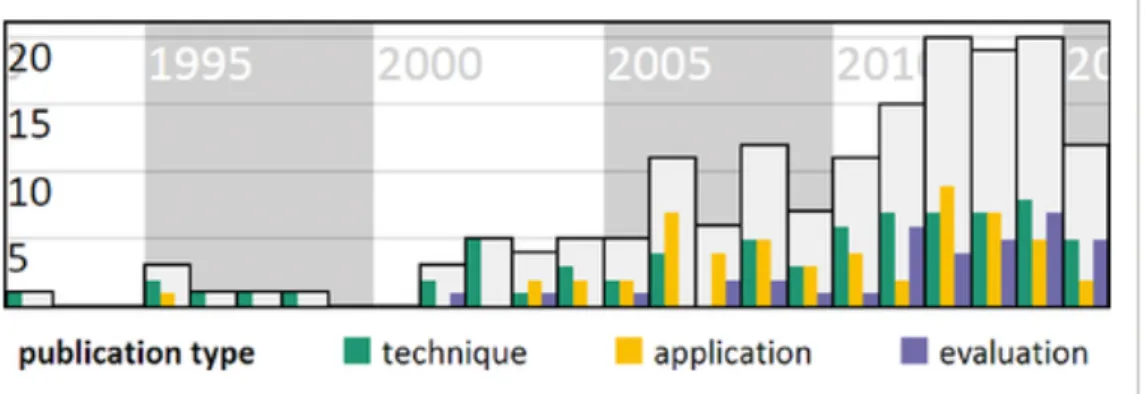
According to [2], visualization of dynamic graphs is presented as active and diverse research in different communities.
Figure 3.1 shows the variety of publications yearly on dynamic graph visu-alization. The light grey bar indicates the total number of publications and different types showed in the colored bar.
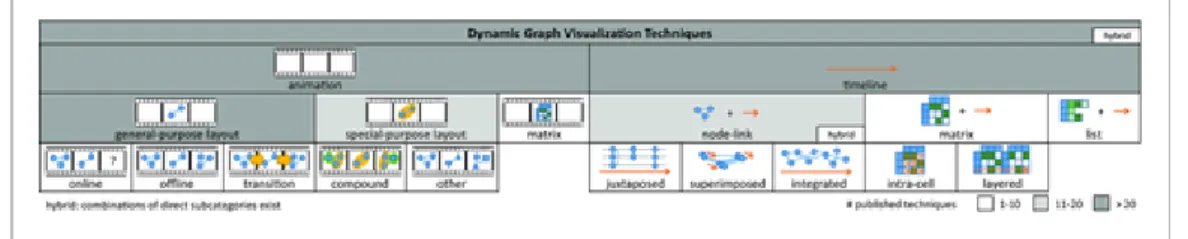
Based on a systematic literature search and categorization, they build a hierarchical taxonomy of dynamic graph visualization. This technique is indicated in Figure 3.2.
Figure 3.2: Hierarchical taxonomy of dynamic graph.
3.2
Bar Graphs
Since the sequence of sensor reading collection is valuable in a smart envi-ronment, representation of these activities sequences is challenging.
They are designing the algorithm that identifies the activity probabilisti-cally which it is being performed and identifies steps that are missing. The Markov model states can represent the events of the sensor or abstractions of information of sensors.
The bar graph shows the results of using the Markov model in identifying the activities (without using any timing information) also in the table next to the graph, each activity is presented in each column and test instances in two color including predicted incorrectly in purple and predicted correctly in blue which is indicated in Figure 3.3 [19].
3.3
CASAS project
This journal’s concentration [7] is mostly on activities in the smart home since activity recognition is at the core of intelligent systems. These sys-tems require information about human activities to focus on human needs. Smart home sensors generate events including a date, time, identifier and message. Activity recognition makes a map of sequences of sensor data to corresponding activity label.
Figure 3.3: Test instances of activities.
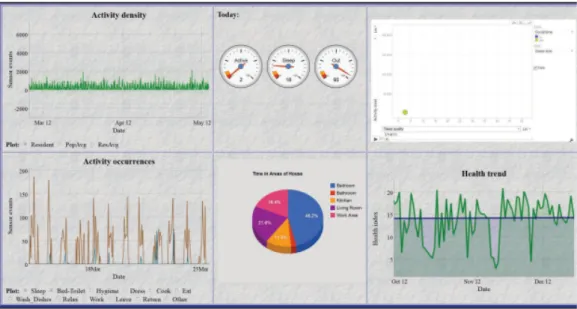
As Figure 3.4 shows, parameters are monitoring activity trends for a smart-home inhabitant, which is categorized into six graphs:
Top-left: number of the sensor events over the time.
Top-middle: daily indicators for activity level, sleep quality, time out of the home.
Top-right: comparison of socialization and sleep quality for some time. Bottom-left: occurrence of tracked activities.
Bottom-middle: time spent in different areas of the home.
Bottom-right: health trend over a period calculated as a function of activity level, sleep quality, and socialization.
Figure 3.4: CASAS activity trend for a smart home inhabitant.
Chapter 4
The visualization methodology
Visualization is a process of mapping raw data into graphical elements such as charts, graphs, and maps. As mentioned in Chapter 2.7, the PIR sensor is a sequence of events that represent the inhabitant’s activity inside the home. Just by looking at this sequence, one cannot obtain enough information about the inhabitant’s behavior inside the home as it is an infinite sequence of zero and one. Turning the raw sensor events into graphical elements allows a user to monitor the inhabitant inside the home as our eye can easily capture trends, patterns, and outliers from graphical elements. This chapter presents three visualization dimensions that allow a user of the system to monitor an inhabitant effectively inside a smart home. Then we preset the proposed tool, which includes these three dimensions and its architecture. Finally, we provide a demonstration of this tool.
4.1
Visualization dimensions
In this section, we present three visualization dimensions, and we believe they can help obtain helpful information about the inhabitant’s behavior to monitor the inhabitant inside the home. These three dimensions are as follows.
4.1.1
Duration-based dimension
This dimension allows a user of the system to monitor each room’s spending time for a given period of time. This dimension is extensively used in dif-ferent research for activity recognition and anomaly detection as it is a key factor to obtain detailed information about the behavioral pattern. For in-stance, as studied in [17], they perform a clustering algorithm to classify the duration of staying for each room at times of day, and they are able to detect different types of anomalies such as unusual long inactivity, not present in an area when it should be, unusual presence and changes in daily routines. According to [21], the duration (time dimension) is used to learn activities in a smart home. They consider duration an important aspect for learning an inhabitant’s daily activities inside a smart home environment and propose a probabilistic learning mechanism that employs duration to recognize daily activities. We use this dimension along with the frequency and sequence dimensions, which are discussed in the following, as it can provide valuable information about the inhabitant to the user of the system and it can result in early identification of behavioral changes in the inhabitant of the smart home which can prevent medically conditioned. For example, when the dura-tion of staying in a locadura-tion is long for a specific time, there is an anomaly or when an inhabitant spends more time in a location other than the bedroom during the night, which can be considered a behavior change.
4.1.2
Frequency-based dimension
This dimension allows a user of the system to monitor the number of times a room is visited for a given period. This dimension does not usually provide valuable information without incorporating the duration of staying in each room, but using this dimension along with the duration of staying in each room can provide detailed information about an inhabitant’s behavioral pat-terns. It is likely that the duration of staying in a location is normal and does not reflect an anomaly or change in behavioral patterns, but the frequency of visiting the exact location is high in a given period of time. For example, an inhabitant can have a normal spending time in the toilet for a period of time, while the frequent trip to the toilet is high for the same period of the time, and this emits a signal that there might be a medical condition, and early identification can help to prevent a serious problem. Studying the frequency of visiting a room and staying in a room can reveal more detailed information
about the inhabitant to a user of the system. An irregular number of visiting a room might sign a serious problem such as Alzheimer.
4.1.3
Sequence-based dimension
This dimension allows a user of the system to monitor the order in which a set of activities are performed as a sequence of preference in a given period of time. Usually, the sequence of sensor events that forms an activity varies between different inhabitants. In other words, the order of sensor events for a specific activity can be variable for a specific activity among different inhabitant and not every inhabitant follow the same order. Thus, monitoring the chain of an inhabitant’s activities can enable a user of the system to monitor the inhabitant effectively. Incorporating this dimension and duration dimension can even enable a user of the system to identify early anomalies and changes in behavioral patterns. This dimension is used extensively in different research for anomaly detection and activity recognition. As studied in [30] proposes an anomaly detection approach that uses the number of events and the duration of performing an anomaly detection activity. They were able to classify the activity instances into four categories: regular events & normal duration, irregular events & normal duration, regular events & unusual duration, and irregular events & unusual duration to identify the anomaly. They consider only activities that have both regular events and normal duration as normal activities without anomaly.
4.2
Time windows
Monitoring an inhabitant inside a smart home using different time granular-ity helps the system user understand what is happening inside the home. As such, we decide to provide multiple time windows for monitoring an inhabi-tant. They are listed below.
Working day/Weekend: Selecting this time granularity enables the user of the system to monitor the inhabitant on working days (from Monday to Friday) and weekend (Saturday and Sunday)
Parts of the day: Selecting this time granularity enables the user of the system to monitor the inhabitant in the morning (8:00-12:00), afternoon (12:00 – 20:00), and night (20:00 – 8:00).
Days of the week: Selecting this time granularity enables the user of the system to monitor the inhabitant on the days of the week (Monday, Tuesday, Wednesday, Thursday, Friday, Saturday, and Sunday).
These time granularities are selected because one or two of these time gran-ularities are used in most approaches discussed earlier. We also believe that monitoring the inhabitant in various time windows is a key factor inappropri-ately monitoring the activities as they are highly dependent on the habitant’s routines. For instance, eating breakfast is performed only in the morning.
4.3
The proposed tool
In the previous sections, we discussed visualization dimensions and the im-portance of each dimension. We also described how each dimension could help to increase the user’s capability to learn and study the inhabitant’s behavioral patterns. As a result, we designed and developed a tool that in-cludes all the aforementioned dimensions, and it enables a user of the system to monitor the inhabitant in different time granularities. This tool is devel-oped using C++ and Qt/QML, which refer to QT/QML in Section 2.7 and is called Behavioral Visualizer (BehViz).
4.3.1
Architecture
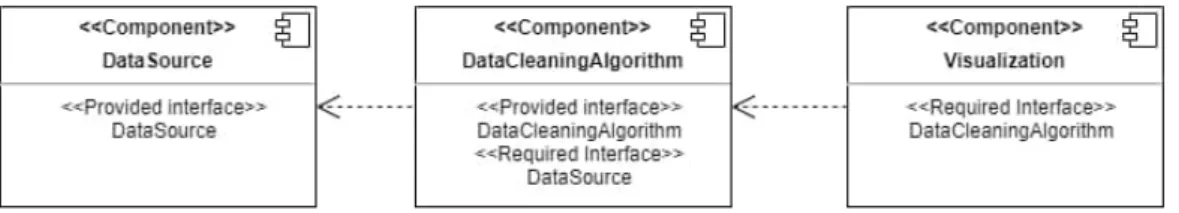
Behavioral Visualizer (BehViz) has three main components and is as follow: • Data Source represents any source of information and encapsulates the functionalities required to connect, read/write, and so on to/from a source of information.
• Data Cleaning detects and corrects corrupted, missing, and false records. As described in (section data cleaning), sensors generate an in-finite sequence of events, and there might be missing events, corrupted events, and false events. Thus, this component is designed to encapsu-late the functionalities which are required to remove false events, insert missing events, and fix the corrupted events.
• Visualization includes different visual elements to present data graph-ically. This component encapsulates the functionalities which are re-quired to turn a sequence of sensors event into different graphical
ments such as donut pie charts, bar charts and textual representation of inhabitant’s transition inside a smart home.
Figure 4.1: Component diagram of the proposed system.
The Behavioral Visualizer (BehViz) is developed in C++ and QT framework, the component diagram is presented in Figure 4.1 and the class diagram provided in Figure 4.2.
Figure 4.2: Class diagram of the Behavioral Visualizer (BehViz).
This tool is designed to retrieve sensors events from a source of sensor streams, clean data, and turn the cleaned sensor data into graphical ele-ments such as donut pie chart, bar charts, and textual representation of in-habitant’s transition inside the smart home to monitor an inhabitant inside a smart home. As it can be seen from the class diagram, two main interfaces are exposed to the client, the DataSource interface and DataCleaningAlgo-rithm. The former can be implemented to obtain sensor events from a source of information. The latter allows a client of the interface to plug in different algorithms, which can be used to detect and correct corrupted sensor events
records at runtime. SequenceDimension, DurationDimension, and Frequen-cyDimension modules provide a textual representation of inhabitant’s inside the smart home, plotting the duration of staying in each room and the num-ber of times a room is visited in different time granularity (refer to time section granularity), respectively.
Since the tool is developed using C++ and Qt/QML, it is a cross-platform application. As explained in Section 2.8 (QT/QML) Qt is a C++ framework that allows the software which is developed to run on various platforms such as Windows, Linux, Mac, and Android so that the Behviz can be run on these platforms. The only requirement is to compile the code for each platform, the so-called write once, and compile it anywhere.
4.3.2
Demonstration
In this section, a description of the Behviz and how it can be used to turn a sequence of sensor events into graphical elements is provided. The main win-dow shows two text edit which is used to indicate period (start date and end date) for graphical representation. Three buttons allow a user of the system to plot the sensor events in different time granularities: Working/Weekend, Parts of day, and daily.
There are three views, and each represents a graphical element, and a user of the system can plot them in different time granularities using the buttons on the top of the page. They are listed below.
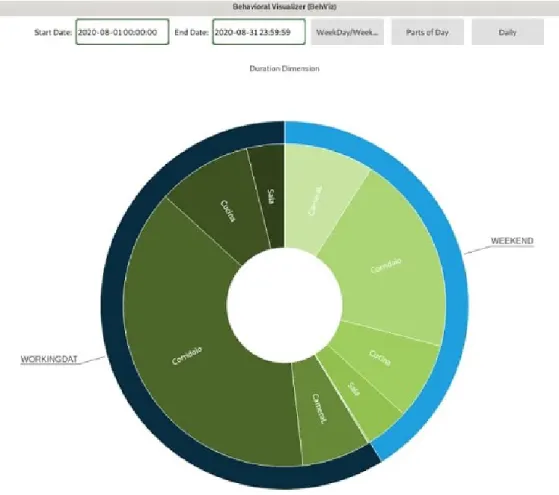
Duration Dimension
Duration Dimension a donut pie chart is used to represent the duration of staying in each room. Outer rings represent the time granularity and the inner rings represent the rooms with the percentage of time spent in each. A user of the system can select the time granularity for outer rings by using the buttons on top of the page. Figure 4.3 shows plotted duration dimension in different time granularities using a donut pie chart.
Frequency Dimension
A bar chart is used to represent the number of times a room is visited. The bars represent the number of times a room is visited, and the x-axis represents
Figure 4.3: Duration of staying in each room using a donut chart in working/weekend time frame.
room categories. Figure 4.4 Show plotted frequency dimension in different time granularities using a bar chart.
Sequence Dimension
Sequence Dimension tokens, which are the name of rooms, and arrows are used to represent the transition of the inhabitant inside the home. Some but-tons allow a user of the system to remove/insert the specific room form/into the transition sequence at the bottom of the page. When a room is removed from the sequence of transition, the button color is changed to green which means that room is removed from the sequence, and when a room is added to the sequence, the button’s color is changed to red, which means that room is added to the sequence. Figure 4.5 shows an example of the sequence
di-Figure 4.4: The number of visited each room using a bar chart in working/weekend time frame.
mension for the selected period. Please note that the time granularity is not applied to the plotted sequence.
Chapter 5
Validation
This chapter presents the result of experiment done using the proposed tool.
5.1
Preprocessing of the Case Study Data
As we described, the smart home is equipped with the PIR sensors installed for each room which detect the inhabitant’s presence, and contact sensors installed on the main entrance room and detect if the inhabitant enters/exits the house.
The inhabitant who is present at home has annotated all the times spent at home manually for one week to have the ground truth. To determine how much the data is accurate and relevant, we compare the ground truth with the sensors’ data. After comparing and analyzing manually, we came across some issues concerning the alignment of the data annotated by the resident and the data recorded by the sensors. The issues include the incompatibility of times between the manually annotated data and the missing data as a result of incorrect detection of sensors. In Table 5.1, some issues are indicated: the first row shows the different time has been recorded by the inhabitant, the second row shows the different time which is wrongly recorded, and the third one shows the correspondence with no difference. Some possible reasons can be the difference between the resident’s watch and the sensor’s time; while the resident is in a room, the sensor detects other times, etc.
Table 5.1: Incompatibility between manual data and sensor data
EventId Sensor Room Sensor Home Date Date Correspondent
Id Value Id Sensor Manual
1530320 5 Sala 0 2 8/8/2020 8/8/2020 differentTime 10:59AM 10:58AM 1530392 5 Sala 0 2 8/8/2020 8/8/2020 MissingData 11:11AM 11:09AM 1532465 79 CameraL 0 2 8/8/2020 8/8/2020 Correspondent 6:36PM 6:36PM
Then we decide to solve this issue by cleaning the data obtained from sensors and apply breadth-first search (BFS) algorithm. In the rest of this chapter, we describe the data in detail and the applied algorithm.
5.2
Case study Data
After analyzing the data set, we realize that sensors miss the resident’s pres-ence. In our case, the contact sensor is detecting the entrance and exist of the inhabitant, and PIR (Passive Infra-Red) sensors generate a stream of zero and one, which indicates the inhabitant’s presence in a specific area. Although the advantage of PIR sensors is the monitoring of the inhabitant inside the home is performed passively, which keeps the privacy of the in-habitant, the main drawback of PIR sensors is that it is likely to have often misdetection of the presence of the inhabitant, especially when there are over-laps between the areas that the sensors cover. This problem occurs when the inhabitant passes through these areas (transits between rooms), and his/her presence is not detected by the sensor and (not registered in the dataset). As illustrated in Table 5.2, the rooms’ adjacency matrixes are in this order: the kitchen is next to the living room, the living room is next to the corridor then the corridor is next to the other rooms and bathrooms. As an example: when the inhabitant transits from the kitchen to the corridor, he/she has to pass from the living room, and the sensor must detect the living room otherwise, the misdetection has happened. This example is showed in Figure 5.1 following textual representation of data:
Figure 5.1: An example of the textual representation of data.
which the above table represents the sensor data before applying the data cleaning method. This table missed the corridor, which must detect after a small bathroom.
Figure 5.2 represents the room (corridor) that must detect after the small bathroom, and the other rooms are listed in order.
Figure 5.2: An example of data cleaning.
To have a smooth visualization, we present an algorithm to solve this issue which we will point out in the next section.
5.3
Procedure
As we discussed in the before, one of PIR sensors’ main problems is that they often miss the detection of the inhabitant’s presence inside the home, which causes the analysis of the inhabitant’s behavior to face the problem. So we develop an algorithm to find the missing data points and insert them into the dataset.
The algorithm comes into the following three steps:
In the first step, we define an adjacency-matrix from the rooms in which PIR sensors are installed. Each cell of the adjacency-matrix indicates if there is a path from the source room to the destination room.
In the second step, a window of size 2 is slide over the data for every two data points. We check if they are adjacent using the adjacent matrix; if not, we find the shortest path from the source room to the destination room using the breadth-first search (BFS) algorithm.
Finally, if there are any missing rooms between the source room and desti-nation room they are inserted into the dataset.
The adjacency matrix of the rooms is indicated in the table below:
cucina sala corridoio bagnoP cameraSF cameraL cameraA bagnoG
Cucina 1 1 0 0 0 0 0 0 Sala 1 1 1 0 0 0 0 0 corridoio 0 1 1 1 1 1 1 1 bagnoP 0 0 1 1 0 0 0 0 cameraSF 0 0 1 0 1 0 0 0 cameraL 0 0 1 0 0 1 0 0 cameraA 0 0 1 0 0 0 1 0 bagnoG 0 0 1 0 0 0 0 1
Table 5.2: Adjacency-matrix for the rooms.
Algorithm 1 details the main steps involved in the data cleaning phase of the experiment.
Algorithm 1 cleaningSensorData
1: procedure cleaningSensorData 2: Declare adjacency-matrix for the rooms 3: Declare cleanedDataset as an array (n) 4: Declare window as an array (2) 5: For each X (data point) in dataset 6: If window is empty 7: window ← X 8: cleanedDataset ← X 9: Continue 10: End If 11: window ← X 12: datapoint1 ← window[1] 13: datapoint2 ← window[2]
14: If datapoint1 and datapoint2 are not adjacent
15: 1.5 Declare missingDataPoints ← find the shortest path between Datapoint1 and Datapoint2 using BFS
16: Declare differenceInTime ← datapoint2.timestamp – datapoint1.timestamp 17: Declare averageTime ← differenceInTime / (missingDataPoints.size + 1) 18: Declare dummy ← averageTime
19: For I = 1 to missingDataPoints.size
20: missingDataPoints.timestamp = datapoint1.timestamp + dummy 21: dummy ← dummy + averageTime
22: End for
23: cleanedDataset ← missingDataPoints 24: End if
25: cleanedDataset ← datapoint2 26: Drop first data point from window 27: End for
28: end procedure
5.4
Experimental Results
As we explained in Chapter 4.3.2, we define a data source interface which can be implemented to read sensor stream from any data source. In our case, the sensors data stream is a csv file so that we implement this in-terface to read sensors data from a csv file. Each record of this csv file provides EVENT ID, SENSOR ID,ROOM, SENSOR VALUE, HOME ID, DATE UTC, DATE Milan. These data might contain corrupt, missed and false records (data cleaning). Thus, we need to clean data using the method which is explained in data cleaning section. We pass the read data to data cleaning component (see Section 4.3.1), where we can incorporate an appro-priate algorithm in order to clean data. To do such, we just need to implement AlgorithmInterface interface, Figure 4.2 in order to clean the data. Since at
this moment, we would like to recover the missing records in the data we use a data cleaning procedure (see Algorithm 1) which can be detected the missed records and insert them properly in the data. After cleaning, we also insert the data in database to keep them for future analysis. Figure 5.3 represents an example of the recovered missed records.
Figure 5.3: An example of recovered missed records using data cleaning module.
When the data is cleaned, it is passed to the visualization component (see Section 4.3.1) to map the raw sensors stream into graphical elements.
5.4.1
Duration Dimension
As shown in Section 4.1.1 duration dimension refers to the amount of time that the inhabitant spent in each room. The behavioral analysis (BehViz) allows us to visualize this dimension in different time frames (see Section 4.2) using a donut pie chart. To compute the duration of staying in each room we simply sum the amount of time that is spent in each room for the given time frame. Figure 5.4, Figure 5.5, and Figure 5.6 represent the duration of staying in each room from date 2020-08-08 00:00:00 to 2020-08-15 23:59:59 in working day/weekend, parts of the day and daily time frame, respectively.
Figure 5.4: Duration of staying in each room in working day/weekend time frame during one week.
5.4.2
Frequency Dimension
As described in Section 4.1.2 frequency refers to the number of times a room is visited for a period of the time. BehViz allows us to visualize this dimension using bar chart in different time frames (see Section 4.2). In order to compute the frequency of we simply count the number of times that the sensor detects the inhabitant inside in the area. Figure 5.7, Figure 5.8, and Figure 5.9 represent the number of visited each room from date 2020-08-08 00:00:00 to 2020-08-15 23:59:59 in working day/weekend, parts of the day and daily time frame, respectively.
Figure 5.5: duration of staying in each room in parts of the day time frame during one week.
5.4.3
Sequence Dimension
As described in Section 5.10 sequence dimension refers to the textual visual-ization representation of transition between rooms. We just simply visualize the transition from a source room to a destination room using token, which represents room name, and an arrow. Figure 5.10 represents the sequence dimension from date 2020-08-08 00:00:00 to 2020-08-15 23:59:59.
Here, we explain the results we obtained by using the Behavioral Visualizer (BehViz) tool. We visualize the sequences of sensor stream for one week by using three dimensions in different time frames which are explained in
Figure 5.6: Duration of staying in each room in daily time frame during one week.
Chapter 4. We want to monitor the inhabitant’s behavior inside the house in different time frames which are indicated in three granularities of working day/weekend, parts of the day, and days of the week. We represent three dimensions of duration, frequency, and sequence in time granularities by us-ing a donut chart, bar chart, and textual representations. If we had mature data, we would be able to improve our work to implement the algorithm to monitor the inhabitant’s behavior by detecting behavioral drift. As repre-sented in Figure 5.4, Figure 5.5, and Figure 5.6 the duration of staying in each room from date 2020-08-08 00:00:00 to 2020-08-15 23:59:59 in working day/weekend, parts of the day and daily time frame, respectively. The user of the system can monitor the transitions to each room separately. For
Figure 5.7: Number of visited each room in working day/weekend time frame during one week.
ample the duration of staying in kitchen is mostly occurs during the working day at night, and considering daily mostly in Monday and Tuesday which is the first days of the week. It seems that the inhabitant usually uses the kitchen after coming back from work for doing the activities such as cook-ing, having a meal, and mostly spends time in the kitchen during the week compare to the weekends and mostly the starting of the weeks which shows that the inhabitant prepares the food at the start of the week for the whole week to save the time for the whole week. So it can represent the healthy condition of the inhabitant.
Figure 5.8: Number of visited each room in parts of day time frame during one week.
Figure 5.9: Number of visited each room in daily time frame during one week.
Chapter 6
Conclusions
This work’s main objective is to enable the user of the system to monitor an inhabitant effectively inside a smart home by creating a conceptual vi-sualization tool that would allow easy access to information gathered from the smart home. For this purpose, we design a tool (behViz) to monitor the inhabitant’s behavior in a smart home. In this case, we try to represent a stream of data to be more understandable and convey perceptual information in a visual form. Behavioral visualizer (BehViz) is a tool for monitoring the inhabitant’s behavior by using three dimensions of the duration of staying, frequency of entering each room, and sequences of entering each room in different time frames of weekend/working day, parts of the day, and days of the week. We plot the data for one week to visualize the behavioral pattern of the inhabitant.
Concerning the possible extensions of this work, BehViz tool can be extended to an online monitoring system, which different users can access. This system allows us to clean and plot the data with the lowest delay in parallel. More-over, our work can grow in detecting behavioral drift, which needs mature data. To detect any behavioral changes of inhabitants, we need to analyze human activity to predict any changes and control disease in any medical condition.
Bibliography
[1] Tomi Akinyemiju, Kemi Ogunsina, Swati Sakhuja, Valentine Ogbhodo, and Dejana Braithwaite. Life-course socioeconomic status and breast and cervical cancer screening: analysis of the who’s study on global ageing and adult health (sage). BMJ open, 6(11):e012753, 2016.
[2] Fabian Beck, Michael Burch, Stephan Diehl, and Daniel Weiskopf. A taxonomy and survey of dynamic graph visualization. In Computer Graphics Forum, volume 36, pages 133–159. Wiley Online Library, 2017. [3] Martin Becker, Ewoud Werkman, Michalis Anastasopoulos, and Thomas Kleinberger. Approaching ambient intelligent home care systems. In 2006 Pervasive Health Conference and Workshops, pages 1–10. IEEE, 2006.
[4] Jacques Bertin. Semiology of graphics; diagrams networks maps. Tech-nical report, 1983.
[5] M Brambilla, A Javadian Sabet, and A Masciadri. Data-driven user pro-filing for smart ecosystems. In Smart Living between Cultures and Prac-tices. A design oriented perspective - ISBN: 978-88-7461-496-7, pages 84–98. Mandragora, 2019.
[6] Marie Chan, Eric Campo, Daniel Est`eve, and Jean-Yves Fourniols. Smart homes—current features and future perspectives. Maturitas, 64(2):90–97, 2009.
[7] Diane J Cook, Aaron S Crandall, Brian L Thomas, and Narayanan C Krishnan. Casas: A smart home in a box. Computer, 46(7):62–69, 2012.
[8] Pascal Croiseau, Emmanuelle G´enin, and Heather J Cordell. Dealing with missing data in family-based association studies: a multiple impu-tation approach. Human heredity, 63(3-4):229–238, 2007.
[9] Stephen Few. Data visualization for human perception. The Encyclope-dia of Human-Computer Interaction, 2nd Ed., 2013.
[10] CHANDNEE GOPAUL. Bridgeviz: A data visualization web applica-tion for monitoring elderly behaviour in aal systems. 2017.
[11] Richard Harper. Inside the smart home. Springer Science & Business Media, 2006.
[12] Xiao Hua Liu, He Zheng, Li Zhong, Shan Huang, Khim Karki, Li Qiang Zhang, Yang Liu, Akihiro Kushima, Wen Tao Liang, Jiang Wei Wang, et al. Anisotropic swelling and fracture of silicon nanowires during lithi-ation. Nano letters, 11(8):3312–3318, 2011.
[13] D Lomet et al. Bulletin of the technical committee on data engineering. Special Issue on Materialized Views and Data Warehousing, 18, 2001. [14] Simone Mangano, Hassan Saidinejad, Fabio Veronese, Sara Comai,
Mat-teo Matteucci, and Fabio Salice. Bridge: Mutual reassurance for au-tonomous and independent living. IEEE Intelligent Systems, 30(4):31– 38, 2015.
[15] ANDREA MASCIADRI. Heterogeneous data collection and analysis for wellness assessment. 2020.
[16] Krishan M Monzer, Younes M Tariq, and AT Farouq. New design of socket modules for smart home applications. Instrum Mesure Metrol, 18(1):43–48, 2019.
[17] Marek Nov´ak, Miroslav Biˇnas, and Frantiˇsek Jakab. Unobtrusive anomaly detection in presence of elderly in a smart-home environment. In 2012 ELEKTRO, pages 341–344. IEEE, 2012.
[18] Alessandro Redondi, Marco Chirico, Luca Borsani, Matteo Cesana, and Marco Tagliasacchi. An integrated system based on wireless sensor net-works for patient monitoring, localization and tracking. Ad Hoc Net-works, 11(1):39–53, 2013.
[19] Geetika Singla, Diane J Cook, and Maureen Schmitter-Edgecombe. In-corporating temporal reasoning into activity recognition for smart home residents. In Proceedings of the AAAI workshop on spatial and temporal reasoning, pages 53–61, 2008.
[20] Matthew O Ward, Georges Grinstein, and Daniel Keim. Interactive data visualization: foundations, techniques, and applications. CRC Press, 2010.
[21] Shuai Zhang, Sally McClean, Bryan Scotney, Priyanka Chaurasia, and Chris Nugent. Using duration to learn activities of daily living in a smart home environment. In 2010 4th International Conference on Pervasive Computing Technologies for Healthcare, pages 1–8. IEEE, 2010.