POLITECNICO DI MILANO
Scuola di Ingegneria Edile Architettura Corso di Laurea Magistrale in Gestione del Costruito
TESI DI LAUREA MAGISTRALE
A Cross-comparison analysis of the UK and Italian pension
funds: the real estate asset class in the portfolio investment
Relatore: Prof.ssa Marzia Morena
Correlatori: Senior Lecturer Hannah Furness
Dott. Tommaso Truppi
Candidato:
Antonio Vincenzo GIANNICO Matricola 802112
1
ABSTRACT
Pension funds could be considered as institutional investors who have particular goal for those people retiring. Albeit with different weights, they play an important role in the pension system of many western countries both in terms of reaching financial sustainability and social security. As OECD reports, in 2013, pension funds confirmed their growing importance amongst institutional investors. With different features UK and Italians pension funds fit itself into this scenario, representing in 2013, respectively, 105,78% and 6,14% asset-to-GDP ratios. Amid the asset class in portfolio of pension funds, the real estate asset is the most important alternative as demonstrated by numerous scientific publications.
With this is mind, this work aims to highlight and show differences that incur between two samples of pension funds in the UK and Italy, in the allocation of real estate asset class of their portfolio. Particular attention has been given to the space of real estate asset class, the different instruments and location and type of property investments in both samples.
In order to achieve these objectives, two samples have been analysed, preceded by a brief explanation of the different pension system current in UK and Italy. For the first sample, this study analysed the top 20 biggest pension funds in UK, while the second sample comprises 10 pre-existing pension funds in Italy. Data is collected from annual reports available on pension funds website and refers to five years, 2009-2013.
Among the first evidence emerged, there is certainly the general asset evolution common to the two samples, albeit with obvious differences in terms of absolute growth and portfolio diversification. Then, it is possible to see the different allocation of property asset in the portfolio investments, with a greater propensity to historical real estate asset class and a recent reduction of properties for the Italian sample compared to UK, where there is a substantial unchanged over the years. Finally, after having seen a growing trend of investment in real estate funds in both cases, it can also be observed that there is a common propensity to invest exclusively in the national territory and specifically in commercial buildings.
2
SINTESI
I fondi pensione possono essere considerati all’interno della categoria degli investitori istituzionali che hanno una determinata finalità previdenziale, grazie alla loro capacità di raccogliere ed investire fondi su base collettiva per il successivo rimborso ai contribuenti sotto forma di pensione. Anche se con pesi e caratteristiche diversi, essi svolgono un ruolo importante nel sistema pensionistico di molti paesi occidentali, sia in termini di sostenibilità finanziaria che di previdenza sociale. Come riporta l'OCSE, nel 2013, i fondi pensione hanno confermato la loro crescente importanza tra gli investitori istituzionali, con una quota del 26,7% in termini di totale attivo. Con peculiarità e connotazioni differenti, i fondi pensione del Regno Unito ed italiani, rientrano pienamente in questo scenario, rappresentando nel 2013, rispettivamente, il 105,78% e il 6,14% del rapporto attivo/PIL. Tra gli asset
class presenti nei portafogli detenuti dai fondi pensione, l'attività immobiliare è da considerarsi l’alternativa di investimento più importante, come dimostrato da numerose pubblicazioni scientifiche. Come documentato da Andonov et al., (2012) per esempio, circa il 75% dei fondi pensione presenti in un campione di 884 tra fondi statunitensi, canadesi, europei e neo zelandesi, investe nel settore immobiliare – l'asset class più importante dopo azioni e obbligazioni - rappresentando, in media, il 5,36% del patrimonio totale.
Sul contesto delineato, questo lavoro si pone l’obiettivo di evidenziare e mostrare le differenze che incorrono tra due campioni di fondi pensione nel Regno Unito e in Italia, riservando una particolare analisi al ruolo giocato dall’investimento immobiliare, quale componente alternativa principale all’interno dei portafogli dei fondi pensione. In modo specifico, è stata data attenzione allo spazio che
l’asset class real estate occupa nei portafogli dei fondi pensione, i vari strumenti d’investimento e la localizzazione geografica e caratterizzazione tipologica degli immobili.
Al fine di raggiungere questi obiettivi, sono stati analizzati due campioni, entrambi preceduti da una breve introduzione dei diversi contesti previdenziali presenti nel Regno Unito e in Italia. Per il primo campione, questo studio ha analizzato i primi 20 fondi pensione per grandezza nel Regno Unito, mentre il secondo campione ha compreso 10 fondi pensione preesistenti in Italia. I dati sono stati estrapolati dagli annual report and account disponibili dai siti web dei fondi pensione e fanno riferimento ad un periodo di cinque anni, dal 2009 al 2013. Inoltre, a causa delle molte differenze presenti negli annual report and account, le voci sono state debitamente riclassificate e raggruppate. Le macro-voci considerate sono quindi: Fixed income, Equity, Cash and Other, Alternative e
Property. Infine, le voci che facevano riferimento a veicoli di investimento collettivo sono state scorporate a seconda delle diverse tipologie di investimento, e riclassificate nelle macro-voci indicate precedentemente.
3 Successivamente, prima di arrivare al confronto finale tra i due campioni, è stato analizzato singolarmente ogni fondo pensione, sia nelle voci che compongono gli stati patrimoniali e sia nella sua evoluzione nel periodo preso in considerazione.
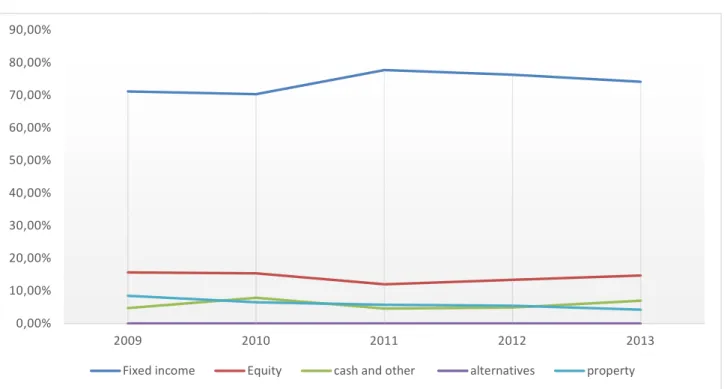
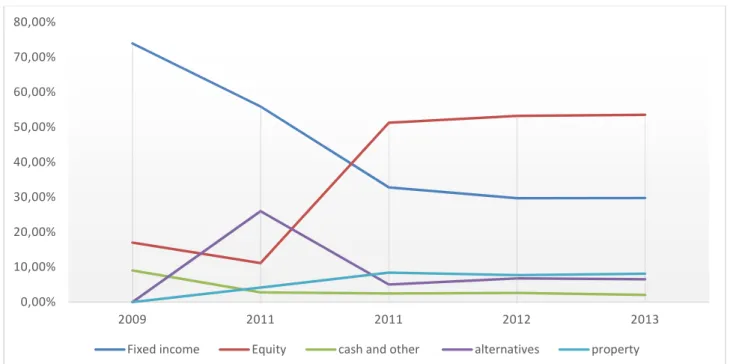
Passando alla comparazione dei due campioni, tra la prime evidenze emerse dallo studio, vi è certamente l'evoluzione generale comune dell’attivo patrimoniale, pur considerando ovvie differenze sia in termini di valore assoluto che di diversificazione del portafoglio. Infatti, per quanto riguarda quest’ultima variabile, si può facilmente notare come in entrambi i campioni la componente mobiliare sia di gran lunga superiore a quella immobiliare, anche se ci sono forti differenze percentuali che mostrano come i fondi pensione italiani abbiano una maggiore propensione storica agli investimenti di tipo immobiliari rispetto ai fondi pensione del Regno Unito. Tuttavia, i dati hanno permesso di evidenziare la graduale diminuzione della componente immobiliare nei fondi pensione italiani a favore di quella mobiliare, motivo da attribuire sicuramente alle imposizioni normative che si sono susseguite nel corso degli anni. Diversa invece è la situazione per il campione del Regno Unito, dove si può osservare una sostanziale invarianza della componente immobiliare in termini percentuali nel periodo considerato.
Per quanto riguarda l'analisi della componente immobiliare si sono verificate differenze sostanziali tra i due campioni. Infatti, come accennato, la prima tendenza rilevata è stata una massiccia riduzione del patrimonio immobiliare da parte del campione italiano. Inoltre si è osservato come in entrambi i campioni, l’investimento immobiliare viene effettuato maggiormente in modo diretto. Tuttavia, si sono constatate due tendenze differenti nei campioni. Per quanto riguarda quello del Regno Unito, si è verificata una crescita congiunta in valore assoluto degli investimenti diretti e indiretti, con una maggiore crescita percentuale per quelli indiretti; nel campione italiano, invece, si è osservata una diminuzione generale in termini assoluti, guidata maggiormente da massive alienazioni, e un aumento - al contrario - degli investimenti indiretti, sia in termini assoluti che percentuali. Inoltre, tra gli investimenti indiretti si è verificato come tra i due campioni, quelli in fondi immobiliari rappresentino una quota consistente con un trend di crescita nel periodo considerato.
Per quanto riguarda la localizzazione geografica degli immobili detenuti direttamente, si può affermare che in entrambi i casi esista una forte propensione ad investire esclusivamente nel territorio nazionale. Infatti, gli investimenti si muovono preferenzialmente verso i centri urbani nazionali densamente popolati. Questo vale per il campione del Regno Unito, con Londra e il sud in generale e con notevoli investimenti anche nel nord-est; e si applica anche al campione italiano con un volume rilevante nel Nord e Milano in particolare, ma con ingenti investimenti anche nella capitale, Roma.
4 Infine, rispetto alla variabile tipologica, si è verificato come gli edifici commerciali rappresentino la categoria più scelta da entrambi i campioni, con una forte preferenza per gli immobili destinati ad uffici. Nel Regno Unito, il retail è il secondo tipo di investimento, ma sono presenti anche investimenti in immobili di tipo industrial. In Italia, al contrario, agli investimenti commerciali seguono quelli residenziali (seppur molto ridotti negli ultimi anni).
Prima di raggiungere le considerazioni finali, inoltre, il penultimo capitolo di questo lavoro ha mostrato una digressione sulle opportunità di crescita per i fondi pensione nello spazio del sistema pensionistico italiano, nonché un'occasione di sviluppo anche per il mercato immobiliare in generale. Infatti, nonostante le numerose riforme che si sono susseguite in Italia nel sistema pensionistico, la sostenibilità finanziaria a lungo termine sembra essere ancora incerta, aggravata anche dall’impatto demografico che caratterizzerà il contesto italiano nei prossimi decenni. Infine, se si considerano i tassi di sostituzione e il rapporto pensionati/lavoratori che si presenteranno nello scenario futuro italiano, la prospettiva di garantire un'adeguata protezione sociale per le generazioni future sembra avere ancora incertezze significative.
5
ACKNOWLEDGMENTS
"O frati", dissi "che per cento milia perigli siete giunti a l’occidente, a questa tanto picciola vigilia d’i nostri sensi ch’è del rimanente, non vogliate negar l’esperienza, di retro al sol, del mondo sanza gente. Considerate la vostra semenza: fatti non foste a viver come bruti, ma per seguir virtute e canoscenza”.
Dante, Inferno, canto XXVI, 112-120
Alla mia mamma Lucia e al mio papà Marco, per avermi dato sempre il massimo e senza i cui sacrifici non avrei mai potuto concludere i miei studi.
Ad Eliana, che mi è stata sempre affianco in questa avventura e senza la quale probabilmente non sarei andato troppo lontano.
Ad Umberto, fratello sempre presente, nei sogni e nei momenti più duri, a sua moglie Veronica che lo s(u)pporta e al piccolo Marco, a cui auguro un giorno di realizzare i suoi desideri, così come io ho potuto realizzare i miei.
Ai miei coinquilini, in ordine di arrivo: Johnny, Francesco e Seba con cui ho condiviso tutta la bellezza di essere uno studente a Milano.
Ai miei compagni di studi “Don’t”, Artu, Barry, Bundi, Cocci, Ila, Lamp, Mary, Paola, Paul, Pisci. Non potevo desiderare di meglio di un gruppo meravigliosamente pazzo come questo.
Ai tanti troppi amici, di Milano, di Lanciano e ovunque. Citandone solo alcuni, il Dottore, Mattia, Vitto, Zucca, Jack, Adri, Greg, Conte, Fraca, Tommasi, intendo ringraziarli tutti.
Alla splendida famiglia di SvoltaStudenti, l’esperienza più bella del Polimi e con la quale ho realizzato molte conquiste e tante avventure. A Fabio mio mentore e big brother milanese e a Roberto a cui va il merito di avermi buttato nella mischia della rappresentanza. A tutti voi, inarrestabili sognatori: Alex, Vale, Andre, Cori, Cece, Nando, Conti, Corrado, Scarpello, Scorza, Cosimo, Benny, Daniel, Loi, Piervito, Giovanni, Laura, Federica e tantissimi altri. A quelli che mi hanno preceduto e a quelli che verranno.
Alla grande famiglia di Unilab che ho contribuito a creare. A Luca, senza la cui intuizione non sarebbe mai nata. Ad Angelo mio compagno di avventura al CNSU. A Ste, Zocca, Giulia, Francesca, Antonio, Rugge, Fabrizio, Caff, Sasa, Valerio, Marco e tutti quelli che quotidianamente rendono grande il Network Unilab SvoltaStudenti.
Ai miei amici di Newcastle con cui ho condiviso più di un semplice Erasmus: Ganni, Stefano, Tanguy, Tomas, Julius, Clemence, Cris, Alyssa, Andrew, Joost, Bram, Elias, Ignacio.
6 Ai tanti amici de l’Aquila, che nonostante quella notte, in cielo o in terra, non hanno mai smesso di sognare.
Vorrei poi esprimere la mia gratitudine alla Prof.ssa Marzia Morena, relatrice di questo lavoro ed il Dott. Tommasi Truppi correlatore, per la loro estrema disponibilità mostratami. Desidero inoltre esprimere riconoscenza alla Senior Lecturer Hannah Furness per aver dedicato il suo prezioso tempo alla mia tesi, accogliendomi a braccia aperte presso la Northumbria University. Intendo inoltre ringraziare il Senato Accademico del Politecnico di Milano: è stato un onore aver potuto collaborare con esso come rappresentante degli studenti e con gli altri rappresentanti degli studenti con cui, pur avendo avuto idee ed approcci diversi, abbiamo sempre perseguito l'interesse comune sia degli studenti che dell'Ateneo.
Ringrazio il nostro Rettore, Giovanni Azzone, per la sua incessante voglia di innovazione, il Prof. Lozza che è stato un punto di riferimento e la Dott.ssa Visconti: chi la conosce sa bene quanto ami gli studenti.
Sono stato uno studente fortunato, ho avuto la possibilità di trascorrere la vita universitaria anche attraverso aspetti che andassero oltre le normali lezioni, gli esami. Ho veramente amato questo ateneo ed ho fatto di tutto per dare il mio contributo nel migliorarlo.
Posso affermare di essere orgoglioso del Politecnico di Milano, delle persone che lo compongono e della loro ricerca inarrestabile per il sapere.
7
CONTENENTS
FIGURE INDEX ... 9
TABLE INDEX ... 12
1. INTRODUCTION ... 15
2. PENSION FUNDS IN THE FINANCIAL SYSTEM ... 17
2.1. Pension funds as an institutional investors ... 17
2.2. An overview of pension asset fund in the world... 19
3 PENSION FUNDS AND REAL ESTATE ... 28
4 RESEARCH OBJECTIVES AND METHODOLOGY ... 31
5 UK PENSION FUNDS AND REAL ESTATE ... 34
5.1 A brief overview of the UK pension system: the second-tier and Pension funds ... 34
5.2 Five years 2009-2013 analysis of the biggest 20 pension funds in UK and real estate asset class 36 5.2.1 Universities Superannaution Scheme ... 36
5.2.2 BT Pension Scheme ... 38
5.2.3 Lloyds TSB Group Colleague Pension ... 40
5.2.4 Royal Bank of Scotland Group Pension Fund ... 42
5.2.5 Barclays Bank UK Retirement Fund ... 44
5.2.6 Railways Pensions Trustee ... 46
5.2.7 British Petroleum Pension Scheme ... 48
5.2.8 HSCB UK life... 50
5.2.9 British Airways Pension Scheme ... 52
5.2.10 BAE Systems Pension ... 54
5.2.11 National Grid Pensions ... 56
5.2.12 Shell Contributory Pension Fund ... 58
5.2.13 Strathclyde Pension Fund ... 60
5.2.14 Greater Manchester Pension Fund ... 62
5.2.15 British Steel Pension scheme ... 65
5.2.16 Mineworkers' Pension Scheme ... 67
5.2.17 Aviva Pension Funds ... 69
5.2.18 GlaxoSmithKline Pension Fund ... 71
5.2.19 British Broadcasting Corporation Pension Scheme ... 73
5.2.20 West Yorkshire Pension Fund ... 75
8
6.1. A brief overview of the Italian UK pension system: the second-tier and Pension funds ... 77
6.2. Five years 2009-2013 analysis of 10 existing pension funds in Italy and real estate asset class 81 6.2.1. Fondo pensione per il personale Cariplo ... 81
6.2.2. Fondo pensioni per il personale BNL ... 84
6.2.3. Fondo pensione per gli agenti di assicurazione ... 86
6.2.4. Fondo pensione di previdenza Bipiemme ... 88
6.2.5. Fondo Pensione Nazionale per il personale delle Banche di Credito Coperativo e Casse Rurali e Artigiane ... 90
6.2.6. Cassa di previdenza integrativa per il personale dell’Istituto Bancario San Paolo di Torino 92 6.2.7. Fondo di previdenza per i dirigenti di aziende commerciali e di spedizione e trasporto “Mario Negri” ... 94
6.2.8. Fondo pensione per il personale della Banca di Roma ... 96
6.2.9. Fondo pensione per il personale delle aziende del Gruppo Unicredit ... 99
6.2.10. Cassa di previdenza del personale della Cassa Risparmio di Parma e Rovigo ... 101
7 CONFRONTING THE ITALIAN AND UK PENSION FUNDS INVESTMENT IN REAL ESTATE ... 103
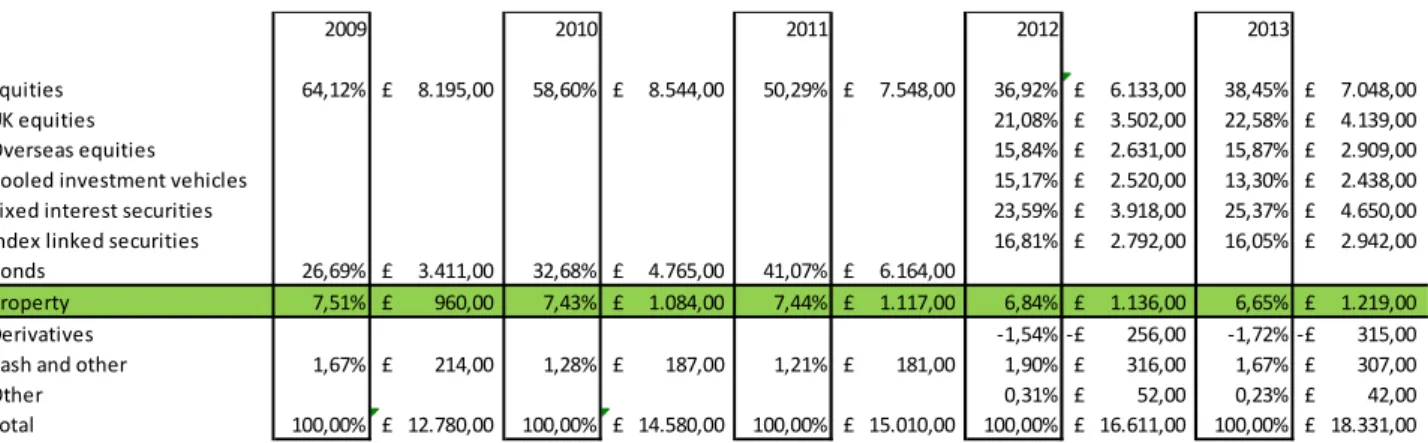
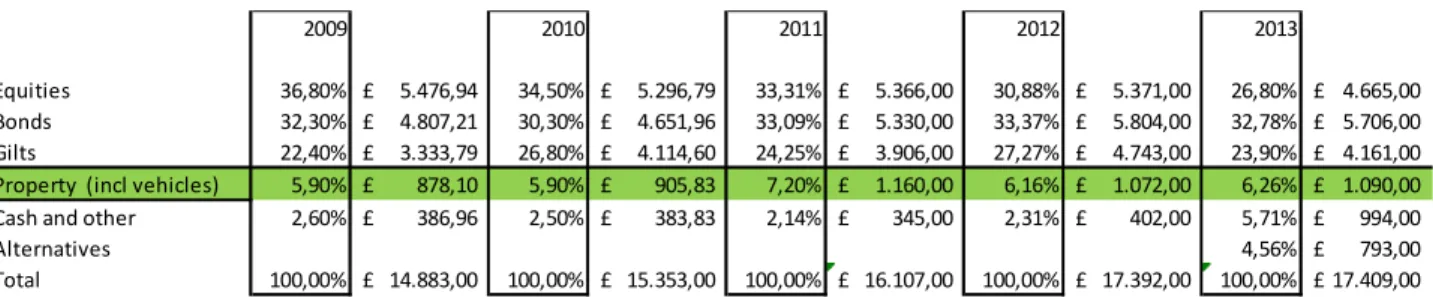
7.1 Real estate asset allocation in pension funds’ portfolio investment ... 103
7.2 Property asset class evolution: Direct, indirect and other investment ... 110
7.3 Typological and geographical differences in real estate investments ... 114
8 A BRIEF LOOK ON THE FUTURE: AN OPPORTUNITY FOR THE ITALIAN PENSION FUNDS MARKET ... 118
9 SUMMARY CONCLUSION ... 122
9
FIGURE INDEX
Figure 1. Total assets by type of institutional investors in the OECD, 2001-2013 in USD trillion. Source OECD, Pension Markets in Focus, 2014. ... 19 Figure 2. Private pension assets by type of financing vehicle in the OECD, 2013 as a percentage of GDP and in absolute terms (USD billion). Source OECD, Pension Markets in Focus, 2014. ... 20 Figure 3. Importance of pension funds relative to the size of the economy in the OECD, 2003 as a
percentage of GDP. Source: self-elaboration from OECD data. ... 21 Figure 4. Importance of pension funds relative to the size of the economy in the OECD 2013 as a percentage of GDP. Source: Self-elaboration from OECD data. ... 22 Figure 5. Geographical distribution of pension fund assets in the OECD, 2003, 2007 and 2013. Source: OECD, Pension Markets in Focus 2014. ... 24 Figure 6.Pension fund asset allocation for selected investment categories in selected OECD countries, 2013. Source: Pension Markets in Focus 2014. ... 25 Figure 7. Variations in equities allocations between 2007 and 2013 in selected OECD countries. Source: Pension Markets in Focus 2014. ... 26 Figure 8. Variations in Government and Corporate bonds allocations between 2007 and 2013 in selected OECD countries. Source: Pension Markets in Focus 2014. ... 27 Figure 9. Universities Superannaution Scheme's Portfolio Asset 2009-2013. Self-elaboration from USS reports. ... 37 Figure 10. BT Pension Scheme's Portfolio Asset 2009-2013. Self-elaboration from BT reports. ... 39 Figure 11.Lloyds Banking Group Colleague Pensions' Portfolio Asset 2009-2013. Self-elaboration from Lloyds reports. ... 41 Figure 12.Royal Bank Scotland Group Pension Fund's Portfolio Asset 2009-2013. Self-elaboration from RBS reports. ... 43 Figure 13.Barclays Bank UK Retirement Fund's Portfolio Asset 2009-2013. Self-elaboration from Barclays reports. ... 45 Figure 14. Railways Pensions Trustee's Portfolio Asset 2009-2013. Self-elaboration from Railways reports. 47 Figure 15.British Petroleum Pension Scheme’s Portfolio Asset 2009-2013. Self-elaboration from BP reports. ... 49 Figure 16. HSCB UK life’s Portfolio Asset 2009-2013. Self-elaboration from HSCB reports. ... 50 Figure 17. British Airways Pension Scheme’s Portfolio Asset 2009-2013. Self-elaboration from British
Airways Pension reports. ... 53 Figure 18. BAE System Pension’s Portfolio Asset 2009-2013. Self-elaboration from BAE reports. ... 55 Figure 19. National Grid Pensions’ Portfolio Asset 2009-2013. Self-elaboration from National Grid reports.56 Figure 20. Shell Contributory Pension Fund’s Portfolio Asset 2009-2013. Self-elaboration from Shell reports. ... 59 Figure 21. Strathclyde Pension Fund’s Portfolio Asset 2009-2013. Self-elaboration from Strathclyde reports. ... 61 Figure 22. Greater Manchester Pension Fund’s Portfolio Asset 2009-2013. Self-elaboration from Greater Manchester reports. ... 63 Figure 23. GMPF property portfolio distribution by region at 31 March 2013. Source: GMFP annual report and account 2014. ... 64 Figure 24. British Steel Pension Scheme’s Portfolio Asset 2009-2013. Self-elaboration from British Steel reports. ... 66 Figure 25. Mineworkers Pension Scheme’s Portfolio Asset 2009-2013. Self-elaboration from Mineworkers reports. ... 68
10 Figure 26. Aviva Pension Funds’ Portfolio Asset 2009-2013. Self-elaboration from Aviva reports. ... 69 Figure 27. GlaxoSmithKline Pension Fund’s Portfolio Asset 2009-2013. Self-elaboration from
GlaxoSmithKline reports. ... 71 Figure 28. British Broadcasting Corporation Scheme’s Portfolio Asset 2009-2013. Self-elaboration from BBC reports. ... 74 Figure 29 West Yorkshire Pension Fund’s Portfolio Asset 2009-2013. Self-elaboration from West Yorkshire reports. ... 76 Figure 30. Cariplo Pension Fund’s Portfolio Asset 2009-2013. Self-elaboration from Cariplo reports. ... 82 Figure 31. BNL Pension Fund’s Portfolio Asset 2009-2013. Self-elaboration from BNL reports. ... 85 Figure 32. Agenti di Assicurazione Pension Fund’s Portfolio Asset 2009-2013. Self-elaboration from reports. ... 87 Figure 33. Bipiemme Pension Fund’s Portfolio Asset 2009-2013. Self-elaboration from Bipiemme reports. 89 Figure 34. BCC, Casse Rurali e Artigiane Pension Fund’s Portfolio Asset 2009-2013. Self-elaboration from reports. ... 91 Figure 35. Istituto Bancario San Paolo di Torino Pension Fund’s Portfolio Asset 2009-2013. Self-elaboration from reports. ... 93 Figure 36. “Mario Negri” Pension Fund’s Portfolio Asset 2009-2013. Self-elaboration from “Mario Negri” reports. ... 95 Figure 37. Banca di Roma Pension Fund’s Portfolio Asset 2009-2013. Self-elaboration from Banca di Roma reports. ... 97 Figure 38. Unicredit Pension Fund’s Portfolio Asset 2009-2013. Self-elaboration from Unicredit reports. . 100 Figure 39. Cariparo Pension Fund’s Portfolio Asset 2009-2013. Self-elaboration from Cariparo reports. ... 101 Figure 40. UK Pension Funds asset evolution in 2009-2013 in millions pounds. Self-elaboration from reports. ... 104 Figure 41. Italian Pension Funds asset evolution in 2009-2013 in millions euro. Self-elaboration from
reports. ... 105 Figure 42. UK Pension Funds’ Portfolio Asset 2009-2013. Self-elaboration from reports. ... 106 Figure 43. Italian Pension Funds’ Portfolio Asset 2009-2013. Self-elaboration from reports. ... 108 Figure 44. UK Property asset class evolution 2009-2013 in millions pounds. Self-elaboration from reports. ... 110 Figure 45. UK Indirect property investments during 2009-2013. Self-elaboration from reports. ... 111 Figure 46. Italian Property asset class evolution 2009-2013 in millions euro. Self-elaboration from reports ... 112 Figure 47. Italian Indirect property investments during 2009-2013. Self-elaboration from reports. ... 113 Figure 48. Italian buildings geographical distribution held by existing pension funds 2009-2013.
Self-elaboration from reports. ... 115 Figure 49. Properties location in Italy held by existing pension funds 2013. Self-elaboration from reports by PowerMap. ... 116 Figure 50. Properties location in Milan area held by existing pension funds 2013. Self-elaboration from reports by PowerMap. ... 116 Figure 51. Properties location in Milan area held by existing pension funds 2013. Self-elaboration from reports by PowerMap. ... 117 Figure 52. Total pension expenditure/GDP its decomposition. Source self-elaboration from Ragioneria Generale dello Stato, 2014. ... 118 Figure 53. Gross replacement rates of the public pension system under the national baseline scenario: base case, 40 years. Source self-elaboration from Ragioneria Generale dello Stato, 2014. ... 119
11 Figure 54. Closed-end funds, Open-end funds and Severance indemnity yields 2005 -2013 in percentage. Source COVIP annual report, 2013. ... 120
12
TABLE INDEX
Table 1. Pension's fund asset in billion US dollars, 2008-2013. Source: self-elaboration from OECD database.
... 23
Table 3. Macro entries and relative items. ... 32
Table 4. Property economical-financial items. ... 33
Table 5. Universities Superannaution Scheme Statement of Assets. Self-elaboration from USS reports. ... 36
Table 6. Universities Superannaution Scheme's Portfolio Asset distribution 2009-2013. Self-elaboration from USS reports. ... 37
Table 7. BT Pension Scheme Statement of Assets. Self-elaboration from BT reports ... 38
Table 8. BT Pension Scheme's Portfolio Asset distribution 2009-2013. Self-elaboration from BT reports. ... 39
Table 9.Lloyds Banking Group Colleague Pensions’ Statement of Assets. Self-elaboration from Loyds reports. ... 40
Table 10.Lloyds Banking Group Colleague Pensions' Portfolio Asset distribution 2009-2013. Self-elaboration from Lloyds reports. ... 41
Table 11.Royal Bank Scotland Group Pension Fund's Statement of Assets. Self-elaboration from RBS reports. ... 42
Table 12. Royal Bank Scotland Group Pension Fund's Portfolio Asset distribution 2009-2013. Self-elaboration from BBS reports. ... 43
Table 13. Barclays Bank UK Retirement Fund's Statement of Assets. Self-elaboration from Barclays reports. ... 44
Table 14. Barclays Bank UK Retirement Fund's Portfolio Asset distribution 2009-2013. Self-elaboration from Barclays reports. ... 45
Table 15.Railways Pensions Trustee's Statement of Assets. Self-elaboration from Railways reports. ... 46
Table 16. Railways Pensions Trustee's Portfolio Asset distribution 2009-2013. Self-elaboration from Railways reports. ... 47
Table 17.British Petroleum Pension Scheme’s Statement of Assets. Self-elaboration from BP reports. ... 48
Table 18.British Petroleum Pension Scheme’s Asset distribution 2009-2013. Self-elaboration from BP reports. ... 49
Table 19. HSCB UK life’s Statement of Assets. Self-elaboration from HSCB reports. ... 50
Table 20. HSCB UK life’s Asset distribution 2009-2013. Self-elaboration from HSCB reports. ... 51
Table 21. British Airways Pension Scheme’s Statement of Assets. Self-elaboration from British Airways Pension reports. ... 52
Table 22. British Airways Pension Scheme’s Asset distribution 2009-2013. Self-elaboration from British Airways Pension reports. ... 53
Table 23. BAE System Pension’s Statement of Assets. Self-elaboration from BAE reports. ... 54
Table 24. BAE System Pension’s Asset distribution 2009-2013. Self-elaboration from BAE reports. ... 55
Table 25. National Grid Pensions’ Statement of Assets. Self-elaboration from National Grid reports. ... 56
Table 26. National Grid Pensions’ Asset distribution 2009-2013. Self-elaboration from National Grid reports. ... 57
Table 27. Shell Contributory Pension Fund’s Statement of Assets. Self-elaboration from Shell reports. ... 58
Table 28. Shell Contributory Pension Fund’s Asset distribution 2009-2013. Self-elaboration from Shell reports. ... 59
Table 29. Strathclyde Pension Fund’s Statement of Assets. Self-elaboration from Strathclyde reports. ... 60
Table 30. Strathclyde Pension Fund’s Asset distribution 2009-2013. Self-elaboration from Strathclyde reports. ... 61
13 Table 31. Greater Manchester Pension Fund’s Statement of Assets. Self-elaboration from Greater
Manchester reports. ... 62 Table 32. Greater Manchester Pension Fund’s Asset distribution 2009-2013. Self-elaboration from Greater Manchester reports. ... 64 Table 33. British Steel Pension Scheme’s Statement of Assets. Self-elaboration from British Steel reports. 65 Table 34. British Steel Pension Scheme’s Asset distribution 2009-2013. Self-elaboration from British Steel reports. ... 66 Table 35. Mineworkers Pension Scheme’s Statement of Assets. Self-elaboration from Mineworkers reports. ... 67 Table 36. Mineworkers Pension Scheme’s Asset distribution 2009-2013. Self-elaboration from Mineworkers reports. ... 68 Table 37. Aviva Pension Funds’ Statement of Assets. Self-elaboration from Aviva reports. ... 69 Table 38. Aviva Pension Funds’ Asset distribution 2009-2013. Self-elaboration from Aviva reports. ... 70 Table 39. GlaxoSmithKline Pension Fund’s Statement of Assets. Self-elaboration from GlaxoSmithKline reports. ... 71 Table 40. GlaxoSmithKline Pension Fund’s Asset distribution 2009-2013. Self-elaboration from
GlaxoSmithKline reports. ... 72 Table 41. British Broadcasting Corporation Scheme’s Statement of Assets. Self-elaboration from BBC
reports. ... 73 Table 42. British Broadcasting Corporation Scheme’s Asset distribution 2009-2013. Self-elaboration from BBC reports. ... 74 Table 43. West Yorkshire Pension Fund’s Statement of Assets. Self-elaboration from West Yorkshire reports. ... 75 Table 44. West Yorkshire Pension Fund’s Asset distribution 2009-2013. Self-elaboration from West
Yorkshire reports. ... 76 Table 45. Cariplo Pension Fund’s Statement of Assets. Self-elaboration from Cariplo reports. ... 81 Table 46. Cariplo Pension Fund’s Portfolio Asset distribution 2009-2013. Self-elaboration from Cariplo reports. ... 82 Table 47. Cariplo Pension Fund’s Properties by typology. Self-elaboration from Cariplo reports. ... 82 Table 48. Cariplo Pension Fund’s Geographical property distribution. Self-elaboration from Cariplo reports. ... 83 Table 49. BNL Pension Fund’s Statement of Assets. Self-elaboration from BNL reports. ... 84 Table 50. BNL Pension Fund’s Portfolio Asset distribution 2009-2013. Self-elaboration from BNL reports. . 85 Table 51. BNL Pension Fund’s properties by typology. Self-elaboration from BNL reports. ... 85 Table 52. BNL Pension Fund’s geographical property distribution. Self-elaboration from BNL reports. ... 85 Table 53. Agenti di Assicurazione Pension Fund’s Statement of Assets. Self-elaboration from reports. ... 86 Table 54. Agenti di Assicurazione Pension Fund’s Portfolio Asset distribution 2009-2013. Self-elaboration from reports. ... 87 Table 55. Bipiemme Pension Fund’s Statement of Assets. Self-elaboration from Bipiemme reports. ... 88 Table 56. Bipiemme Pension Fund’s Portfolio Asset distribution 2009-2013. Self-elaboration from Bipiemme reports. ... 89 Table 57. BCC, Casse Rurali e Artigiane Pension Fund’s Statement of Assets. Self-elaboration from reports. ... 90 Table 58. BCC, Casse Rurali e Artigiane Pension Fund’s Portfolio Asset distribution 2009-2013.
14 Table 59. Istituto Bancario San Paolo di Torino Pension Fund’s Statement of Assets. Self-elaboration from reports. ... 92 Table 60. Istituto Bancario San Paolo di Torino Pension Fund’s Portfolio Asset distribution 2009-2013. Self-elaboration from reports. ... 93 Table 61. “Mario Negri” Pension Fund’s Statement of Assets. Self-elaboration from “Mario Negri” reports. ... 94 Table 62. “Mario Negri” Pension Fund’s Portfolio Asset distribution 2009-2013. Self-elaboration from “Mario Negri” reports. ... 95 Table 63. “Mario Negri” Pension Fund’s Geographical property distribution. Self-elaboration from “Mario Negri” reports. ... 95 Table 64. Banca di Roma Pension Fund’s Statement of Assets. Self-elaboration from Banca di Roma reports. ... 96 Table 65. Banca di Roma Pension Fund’s Portfolio Asset distribution 2009-2013. Self-elaboration from Banca di Roma reports. ... 97 Table 66. Banca di Roma Pension Fund’s Properties by typology. Self-elaboration from Banca di Roma reports. ... 98 Table 67. Banca di Roma Pension Fund’s Geographical property distribution. Self-elaboration from Banca di Roma reports. ... 98 Table 68. Unicredit Pension Fund’s Statement of Assets. Self-elaboration from Unicredit reports... 99 Table 69. Unicredit Pension Fund’s Portfolio Asset distribution 2009-2013. Self-elaboration from Unicredit reports. ... 100 Table 70. Unicredit Pension Fund’s Properties by typology. Self-elaboration from Unicredit reports. ... 100 Table 71. Unicredit Pension Fund’s Geographical property distribution. Self-elaboration from Unicredit reports. ... 100 Table 72. Cariparo Pension Fund’s Statement of Assets. Self-elaboration from Cariparo reports. ... 101 Table 73. Cariparo Pension Fund’s Portfolio Asset distribution 2009-2013. Self-elaboration from Cariparo reports. ... 102 Table 74. Cariparo Pension Fund’s Geographical property distribution. Self-elaboration from Cariparo reports. ... 102
15
1. INTRODUCTION
Pension funds could be considered “financial intermediaries” which collect, pool, and invest funds contributed by sponsors and employees to provide for the future pension entitlements of beneficiaries. Albeit with different weights, they play an important role in the pension system of many western countries both in terms of financial sustainability and social security. As OECD reports, in 2013, pension funds confirmed their growing importance amongst institutional investors, with a share of 26,7% in terms of total assets held by institutional investors. With this in mind and with features, weights and different volumes also fit the UK and Italians pension funds and which represented in 2013 respectively, 105,78% and 6,14% asset-to-GDP ratios.
In this scenario, the work aims to highlight and understand the differences and characteristics that exist between two samples of pension funds in the United Kingdom and Italy, in the allocation of real estate asset class of their investment portfolio. Particularly, it will analysed the space of real estate asset allocation in portfolio investment, the different instruments and the location and type of property investments in these two samples during 2009-2013.
In order to achieve the objectives described, this work is structured into eight chapters plus the introduction.
The second chapter aims to provide a general scenario of pension funds. Particularly it shows the role of pension funds in the financial system, as an institutional investor; then it offers an overview of pension funds in the world, especially their asset characteristics, weights and evolution in the OECD countries.
The third chapter shows the real estate asset as the most important alternative asset class in portfolio of pension funds, including a review of the literature about it.
The fourth chapter outlines the research objectives and methodology of this dissertations, including an explanation of the variables analysed and the composition of the samples subject of work. The fifth chapter, after a brief introduction of the UK pension system, comprises five years (2009-2013) analysis of the biggest 20 pension funds in UK; the work shows the composition of portfolio and asset class evolution through the period under subject with a main focus on real estate asset class.
The sixth chapter follows the lines of the previous chapter,but analyses the Italian sample, which
16 The seventh chapter is the main core of the research and answer to the objectives of this dissertation. Particularly, after an analysis of the asset class composition of the two samples, it identifies the different allocation of property asset in the portfolio investments of pension funds in the UK and in Italy. Then, with reference to the property asset class evolution, ii shows the different types of investment for both samples analysed with dissimilar evolutions through the period under account. The last paragraph, finally, provides evidences about the quality of the properties, with main indications about geographical location and typological information.
In the end, before reaching the final considerations, the eighth chapter of this work shows a digression of the growth opportunities for pension funds in the space of the Italian pension system as well as a development opportunity for the real estate market.
17
2. PENSION FUNDS IN THE FINANCIAL SYSTEM
2.1.Pension funds as an institutional investors
The financial system is central to the functioning of the economy and modern life.
As Merton argues (1991, p. 5) the core function of the financial system is to facilitate the allocation and deployment of economic resources, both spatially and across time, in an uncertain environment. This system includes the basic payment system through which virtually all transactions clear and the capital markets, which include the money, fixed-income, equity, futures and options markets and financial intermediaries.
This system handles millions of regular transactions every days, spending in the shops, paying bills, wages and savings. Financial institutions, such as banks, insurance companies, pension funds, hedge funds, investment advisors and mutual funds manage vast sums of money on behalf of individuals and businesses. In addition, the financial markets contribute to the business development minute-by-minute, facilitating trade across the world on every basis, including: from company shares and commodities like oil, to complex financial instruments and, of course, money itself.
Between the financial institutions, there are the “intermediary investors” and a number of authors (e.g. Wright & Quadrini, 2009) have defined it as an entity that acts as the middleman between two parties in a financial transaction. They offer a number of benefits to the average consumer including safety, liquidity and economies of scale.
Pension funds, from this perspective, may be considered “financial intermediaries” because they manage household savings to invest in assets, make interest and then redistribute back to them. Workers (or employer for their behalf) pay money into the pension fund, and then the fund distributes the money back to them.
In accordance with Onado (2012) financial intermediaries have in common four key features: • Assets and liabilities is the main component of their budget;
• Their costs and revenues derived from the production and exchange of financial assets and are thus represented by interest and fees;
• They are subject to a number of specific risks arising from financial assets and liabilities that are the subject of their business;
• They are subject to particular forms of regulation in order to pursue objectives of stability, transparency, fairness and competition.
18 As stated earlier, financial intermediaries - as financial institutions- represent an important driver of the whole financial market and among them there are institutional investors that are not easy to define. The common characteristic is that institutional investors are not physical persons, but they are organised as legal entities. The exact legal form, however, varies widely among institutional investors and covers everything from straightforward profit maximising joint stock companies (for example, closed-end investment companies) to limited liability partnerships (like private equity firms) and incorporation by special statute (for example, in the case of some sovereign wealth funds). Institutional investors may act independently, or be part of a larger company group or conglomerate (Çelik & Isaksson, 2013).
In accordance with another quote of Onado (2012), institutional investors have in common some features:
• The institutional investor generally has an obligation to return against savers (while the intermediaries a repayment obligation);
• the institutional investors specialize in the construction of financial portfolios, that is in the process of evaluation and selection of securities, mainly negotiable and the combination of which aims to exploit the financial benefits of diversification;
• in most cases there is an express delegation to the management of financial portfolios, which also provides guidelines and selection criteria to be observed by the operator;
• the portfolio management can be done on a collective or individual basis;
• the portfolio management can also be achieved on the basis of a mediation activity itself. Davis (1995) has defined pension funds as “forms of institutional investor, which collect, pool, and invest funds contributed by sponsors and beneficiaries to provide for the future pension entitlements of beneficiaries. Therefore, it is possible to consider pension funds as institutional investors who have particular goal for those people retiring.
Additionally, Blake (1995) includes pension funds fully into the category of institutional investors due to their ability to handle large masses of resources and the ability to choose jobs in the long term, being limited to the risk of having to face unexpected redemptions by the beneficiaries.
Finally, as Marinelli (2011) highlights, in addition to the connotations of a financial nature, pension funds, differently from what happens to other institutional traders of savings, have to face very similar problems related to their social function and about the substance of the sustainability of the promised social security in the longer period.
19
2.2.An overview of pension asset fund in the world
As showed in figure 1, institutional investors totalled USD 92,6 trillion in 2013, with USD 34,9 trillion coming from investment funds, USD 26,1 trillion from insurance companies, USD 24,7 trillion from pension funds, USD 5,1 trillion from public pension reserve funds and USD 1,8 trillion from other investors.
In 2013, pension funds confirmed their growing importance amongst institutional investors, with a share of 26,7% in terms of total assets held by institutional investors. Pension fund assets exhibited an average annual growth rate of 8,2% over the period 2009-2013. This average annual growth rate between 2009 and 2013 outperformed those observed for insurance companies, 4,1% over the same period, and investment funds with 6,7% for which assets slight declined between 2010 and 2011 (OECD, 2014).
Figure 1. Total assets by type of institutional investors in the OECD, 2001-2013 in USD trillion. Source OECD, Pension Markets in Focus, 2014. 0 5 10 15 20 25 30 35 2001 2002 2003 2004 2005 2006 2007 2008 2009 2010 2011 2012 2013 USD TRILLIONS
Investment funds Insurance companies
Pension funds public pension reserve funds
Other insitutional savings $34.9
$26.1 tn
$24.7 tn
$5.1 tn
20 As OECD (2013) reports, in 2013 pension funds remained the main financing vehicle for private pension plans, with USD 24,7 trillion of assets under management representing 68% of the total private pension assets. Bank or investment companies managed funds or other entities accounted for one fifth of the market with USD 7,1 trillion, followed by insurance companies having USD 4,2 trillion (12% of private pension assets) in the form of pension insurance contracts.
Pension insurance contracts account for the largest shares of aggregate private pension assets in Denmark, France, Korea and Sweden (see Figure 2). Denmark’s private pension system was the largest in relation to its economy at 193% of GDP. Private pension assets were larger than the size of their economy in four other countries; Iceland, Canada, the United States and Australia. Pension insurance contracts alone represent 126% of GDP in Denmark. In Sweden, most individual pension savings and occupational pensions are administered by life insurers (more than 80% of total private pension assets in 2013) and not by pension funds. The assets held in pension insurance contracts amounted to USD 330 billion in 2013, representing 58% of GDP.
Figure 2. Private pension assets by type of financing vehicle in the OECD, 2013 as a percentage of GDP and in absolute terms (USD billion). Source OECD, Pension Markets in Focus, 2014.
0 20 40 60 80 100 120 140 160 180 200 D E N M A R K I C E L A N D C A N A D A U N I T E D S T A T E S A U S T R A L I A S W E D E N C H I L E F I N L A N D I S R A E L J A P A N K O R E A P O L A N D M E X I C O S P A I N E S T O N I A S L O V A K R E P U B L I C P O R T U G A L F R A N C E C Z E C H R E P U B L I C I T A L Y S L O V E N I A A U S T R I A
21 The market value of assets accumulated relative to the size of the economy as measured by the GDP is a key indicator of the scale of pension funds’ activity.
As Figure 4 shows, in 2013, only five OECD countries reached asset-to-GDP ratios higher than 100% – the Netherlands (160,64%), Iceland (148,69%), Switzerland (119,4%), the United Kingdom (105,78%) and Australia (103,27%). In contrast, in 2003 only the Netherlands had asset-to-GDP ratio higher than 100%, followed by Switzerland (99,94%) and Iceland (98,26%) (Figure 3). The United Kingdom increased over 40 percentage points in the last decade, while Italy saw a minimal increase from 2,43% in 2003 to 6,14% in 2013.
In the 2013, pension fund assets were of varying importance relative to GDP in the other countries. Only thirteen out of thirty-three countries had assets-to-GDP ratios above 20%, which is considered the minimum in accordance with OECD’s definition of a “mature” pension fund market.
Figure 3. Importance of pension funds relative to the size of the economy in the OECD, 2003 as a percentage of GDP. Source: self-elaboration from OECD data.
101,19% 99,94% 98,26% 81,80% 71,78% 67,15% 62,66% 56,05% 54,01% 50,32% 46,60% 39,43% 28,48% 24,78% 11,70% 11,35% 11,09% 7,45% 6,47% 6,19% 5,33% 5,26% 5,22% 4,15% 3,90% 3,66% 2,98% 2,43% 1,60% 1,53% 0,00% 20,00% 40,00% 60,00% 80,00% 100,00% 120,00% Netherlands Switzerland Iceland Estonia United States Australia United Kingdom Chile Finland Canada Slovenia Ireland Denmark Israel New Zealand Portugal Japan Sweden Norway Spain Poland Hungary Mexico Austria Belgium Germany Czech Republic Italy Slovak Republic Korea
Pension Funds' Asset in OECD countries
% of GDP, 2003
22 In contrast, in 2003 countries with assets-to-GDP ratios above 20% were fourteen out of thirty and most of them changed rate during the last decade: Slovenia had 46,6 % in 2003 and decreased to 4,02% in 2013, Estonia from 81,8% to 9,61%. With the exception of Finland, which saw a decrease from 54,01% to 50,85%, all other countries have increased their rates. Israel (24,78% to 50,37%), Denmark (28,48% to 42,76%), Ireland ( 39,43% to 55,78%), Canada (50,32% to 71,27%), Chile (56,05% to 62,22%) and United States (71,78% to 83,02%).
Figure 4. Importance of pension funds relative to the size of the economy in the OECD 2013 as a percentage of GDP. Source: Self-elaboration from OECD data.
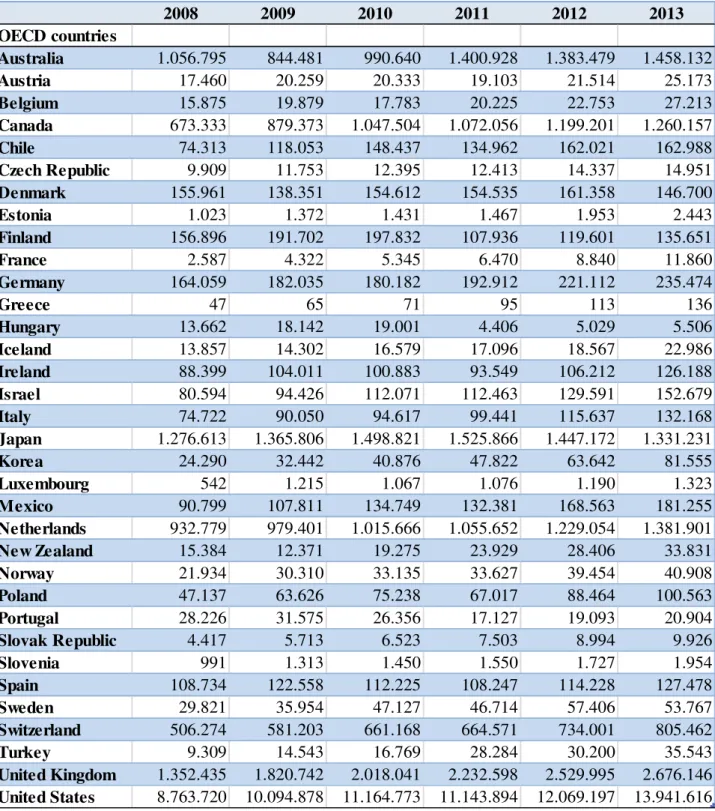
In absolute terms, since 2008, the United States still owned the majority of pension’s assets under management of all the OECD countries, with assets worth USD 13,9 trillion in 2013. It is followed by United Kingdom USD 2,6, Australia USD 1,4 and Netherlands USD 1,38. Italy placed
fourteenth with USD 132 billion (Table 1).
160,64% 148,69% 119,40% 105,78% 103,27% 83,02% 71,27% 62,22% 55,78% 50,85% 50,37% 42,76% 41,80% 19,10% 18,56% 14,77% 9,98% 9,61% 9,49% 9,15% 9,04% 8,26% 7,66% 6,52% 6,24% 6,14% 5,83% 5,40% 5,16% 4,86% 4,08% 4,02% 2,11% 0,00% 20,00% 40,00% 60,00% 80,00% 100,00% 120,00% 140,00% 160,00% Netherlands Iceland Switzerland United Kingdom Australia United States Canada Chile Ireland Finland Israel Denmark France New Zealand Poland Mexico Slovak Republic Estonia Sweden Portugal Spain Norway Czech Republic Korea Germany Italy Austria Greece Belgium Turkey Hungary Slovenia Luxembourg
Pension Funds' Asset in OECD countries
% of GDP, 2013
23
Table 1. Pension's fund asset in billion US dollars, 2008-2013. Source: self-elaboration from OECD database.
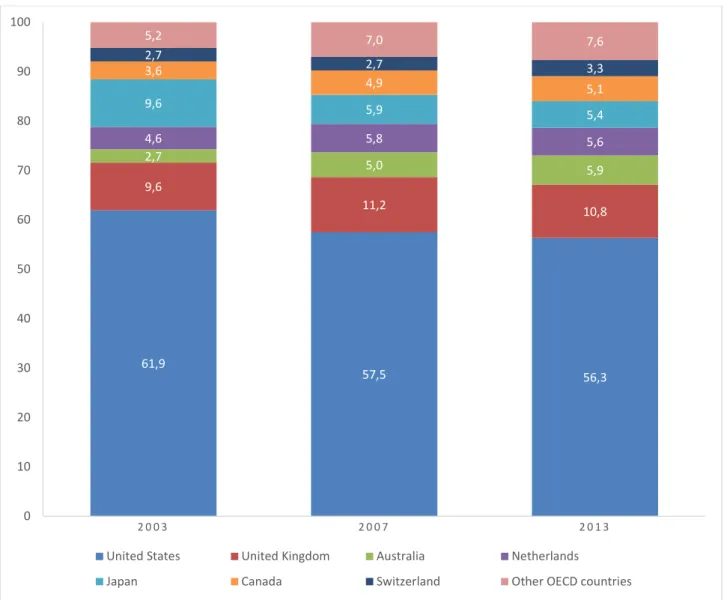
In relative terms however, the weight of assets held by pension funds in the United States has been gradually shrinking, from nearly 62% of total pension assets in the OECD in 2003 to 56% in 2013. The United Kingdom came in the second place in 2013, with 10,8% of OECD assets, followed by Australia (5,9%), the Netherlands and Japan (between 5% and 6% of the pension assets in the OECD each), Canada (5,1%) and Switzerland (3,3%). The share of assets held by pension funds in the other OECD countries increased progressively, from 5,2% in 2003 to 7,0% in 2007 and 7,6% in 2013 (OECD, 2014). 2008 2009 2010 2011 2012 2013 OECD countries Australia 1.056.795 844.481 990.640 1.400.928 1.383.479 1.458.132 Austria 17.460 20.259 20.333 19.103 21.514 25.173 Belgium 15.875 19.879 17.783 20.225 22.753 27.213 Canada 673.333 879.373 1.047.504 1.072.056 1.199.201 1.260.157 Chile 74.313 118.053 148.437 134.962 162.021 162.988 Czech Republic 9.909 11.753 12.395 12.413 14.337 14.951 Denmark 155.961 138.351 154.612 154.535 161.358 146.700 Estonia 1.023 1.372 1.431 1.467 1.953 2.443 Finland 156.896 191.702 197.832 107.936 119.601 135.651 France 2.587 4.322 5.345 6.470 8.840 11.860 Germany 164.059 182.035 180.182 192.912 221.112 235.474 Greece 47 65 71 95 113 136 Hungary 13.662 18.142 19.001 4.406 5.029 5.506 Iceland 13.857 14.302 16.579 17.096 18.567 22.986 Ireland 88.399 104.011 100.883 93.549 106.212 126.188 Israel 80.594 94.426 112.071 112.463 129.591 152.679 Italy 74.722 90.050 94.617 99.441 115.637 132.168 Japan 1.276.613 1.365.806 1.498.821 1.525.866 1.447.172 1.331.231 Korea 24.290 32.442 40.876 47.822 63.642 81.555 Luxembourg 542 1.215 1.067 1.076 1.190 1.323 Mexico 90.799 107.811 134.749 132.381 168.563 181.255 Netherlands 932.779 979.401 1.015.666 1.055.652 1.229.054 1.381.901 New Zealand 15.384 12.371 19.275 23.929 28.406 33.831 Norway 21.934 30.310 33.135 33.627 39.454 40.908 Poland 47.137 63.626 75.238 67.017 88.464 100.563 Portugal 28.226 31.575 26.356 17.127 19.093 20.904 Slovak Republic 4.417 5.713 6.523 7.503 8.994 9.926 Slovenia 991 1.313 1.450 1.550 1.727 1.954 Spain 108.734 122.558 112.225 108.247 114.228 127.478 Sweden 29.821 35.954 47.127 46.714 57.406 53.767 Switzerland 506.274 581.203 661.168 664.571 734.001 805.462 Turkey 9.309 14.543 16.769 28.284 30.200 35.543 United Kingdom 1.352.435 1.820.742 2.018.041 2.232.598 2.529.995 2.676.146 United States 8.763.720 10.094.878 11.164.773 11.143.894 12.069.197 13.941.616
24
Figure 5. Geographical distribution of pension fund assets in the OECD, 2003, 2007 and 2013. Source: OECD, Pension Markets in Focus 2014.
Twenty-one OECD countries invested more than 70% of their portfolio into equities and government and corporate bonds in the end of 2013 (see Figure 6). Equities were almost 50% in pension funds’ portfolios in two countries, United States and Australia. Chile and Poland followed with 42,1% and 41,5% respectively. In half of the OECD countries, pension funds invested more than 50% of their assets in bonds (both categories) in 2013. The proportion of bonds in pension fund portfolios was over 80% in two countries, namely the Czech Republic (86,5%) and Hungary (83,1%). Bills and bonds were more than 50% of the portfolio in 2013 in a further fifteen OECD countries: Chile, Denmark, Germany, Greece, Iceland, Israel, Luxembourg, Mexico, Norway, Poland, Slovak Republic, Slovenia, Spain, Sweden and Turkey.
With reference to the “other” investments category - which includes loans, land and buildings, unallocated insurance contracts, hedge funds, private equity funds, structured products, other mutual
61,9 57,5 56,3 9,6 11,2 10,8 2,7 5,0 5,9 4,6 5,8 5,6 9,6 5,9 5,4 3,6 4,9 5,1 2,7 2,7 3,3 5,2 7,0 7,6 0 10 20 30 40 50 60 70 80 90 100 2 0 0 3 2 0 0 7 2 0 1 3
United States United Kingdom Australia Netherlands
25 funds (i.e. not invested in cash, bills and bonds, or shares) and other investments- different countries have different asset allocation.
Particularly in Finland, the high value for the other category is driven mainly by land and buildings, which account to 13% of the total investment. Also, in Portugal land and buildings represent 18% of total other investment. In Switzerland and Canada, instead, the other category is driven by other investments of collective investment schemes (17% of total). Contrastingly, in Italy, where the high value for the other category is 22% of the total, it is led by unallocated insurance contracts. In Japan, outward investments in securities (21%) and accounts payable and receivable (19%) are the most important other investments.
Figure 6.Pension fund asset allocation for selected investment categories in selected OECD countries, 2013. Source: Pension Markets in Focus 2014. 49,5 49,1 42,1 41,5 39,0 38,2 37,5 35,5 34,4 33,8 31,7 29,2 24,1 23,6 22,7 21,5 20,2 19,2 15,4 15,3 14,0 11,2 10,4 6,3 6,2 5,4 4,4 1,3 1,2 0,3 0,0 20,8 8,4 56,7 51,8 42,0 31,1 42,9 57,2 48,1 48,6 34,6 33,6 30,7 75,1 52,8 68,7 44,0 48,0 75,2 66,4 69,0 37,1 63,3 73,7 83,1 68,4 51,8 74,8 78,1 86,5 9,0 0,9 17,7 0,3 6,0 3,9 4,0 3,3 2,3 12,8 17,4 3,5 8,2 3,3 0,9 7,6 5,0 12,0 3,6 3,6 0,5 0,0 5,5 15,0 5,0 8,0 24,6 3,7 23,1 17,2 10,6 56,5 28,9 24,8 0,9 0,8 15,1 26,7 16,3 4,9 4,7 0,1 30,1 29,0 41,9 0,3 17,0 4,8 23,7 29,2 5,8 17,8 17,0 46,1 11,3 15,0 2,6 1,6 40,0 0,8 3,5 2,6 34,6 U N I T E D S T A T E S A U S T R A L I A C H I L E P O L A N D B E L G I U M F I N L A N D N E T H E R L A N D S N O R W A Y A U S T R I A E S T O N I A C A N A D A S W I T Z E R L A N D U N I T E D K I N G D O M M E X I C O I C E L A N D L U X E M B O U R G P O R T U G A L I T A L Y S W E D E N D E N M A R K T U R K E Y J A P A N S P A I N I S R A E L H U N G A R Y G R E E C E G E R M A N Y S L O V A K R E P U B L I C S L O V E N I A C Z E C H R E P U B L I C K O R E A
26 In Germany on the other hand, other investments are mostly characterized by loans (16%) and other investments of collective investment schemes (16%). Finally, in Korea, unallocated insurance contracts are the biggest part of other investments category with 32% of the total.
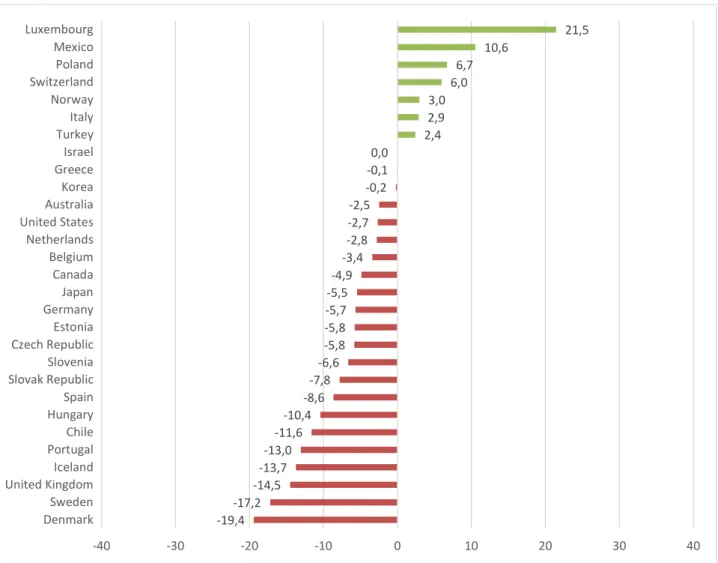
Figure 7. Variations in equities allocations between 2007 and 2013 in selected OECD countries. Source: Pension Markets in Focus 2014.
Between 2007 and 2013 most of the Pension funds in OECD countries reduced the equities allocation into their portfolios (Figure 7), returning to the pre-crisis level. They reallocated part of this share to government and corporate bonds (OECD, 2014).
As is possible to see, twenty-two OECD countries decreased the share invested equities with an inverse trend in some countries like Luxemburg (+21,5%), Mexico (+10,6%), Poland (+6,7%), Switzerland (+6%), Norway (+3%), Italy (2,9%) and Turkey (2,4%).
-19,4 -17,2 -14,5 -13,7 -13,0 -11,6 -10,4 -8,6 -7,8 -6,6 -5,8 -5,8 -5,7 -5,5 -4,9 -3,4 -2,8 -2,7 -2,5 -0,2 -0,1 0,0 2,4 2,9 3,0 6,0 6,7 10,6 21,5 -40 -30 -20 -10 0 10 20 30 40 Denmark Sweden United Kingdom Iceland Portugal Chile Hungary Spain Slovak Republic Slovenia Czech Republic Estonia Germany Japan Canada Belgium Netherlands United States Australia Korea Greece Israel Turkey Italy Norway Switzerland Poland Mexico Luxembourg
27
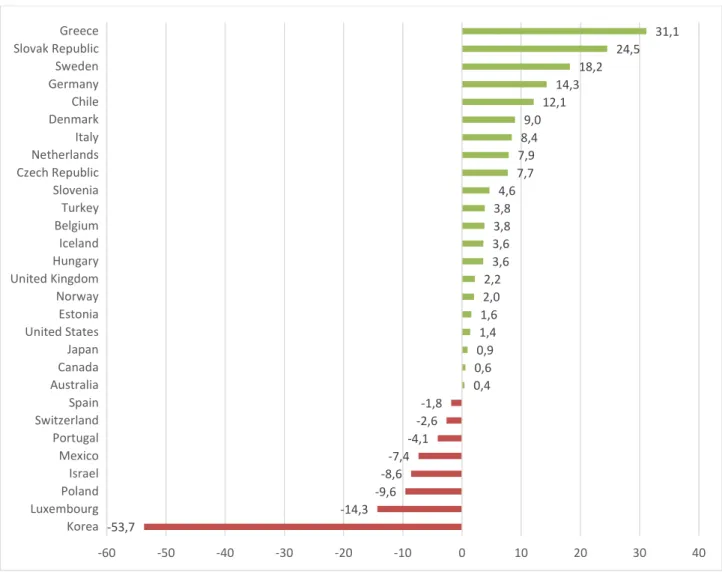
Figure 8. Variations in Government and Corporate bonds allocations between 2007 and 2013 in selected OECD countries. Source: Pension Markets in Focus 2014.
At the same time in figure 8, it is possible to observe the variations in government and corporate bonds into portfolios asset for selected OECD countries. Twenty-one of them increased investments for bonds and bills during the 2007-2013 period. Greece had the most growth for this asset class (+31,1%), followed by the Slovak Republic (+24,5%) and Sweden (+18,2%). As it was observed before, it is reasonable to say that these growths compensate for the decrease of shares. In the end, it is important to see the huge reduction in bonds and bills for the Korea, not followed by a progress in shares. -53,7 -14,3 -9,6 -8,6 -7,4 -4,1 -2,6 -1,8 0,4 0,6 0,9 1,4 1,6 2,0 2,2 3,6 3,6 3,8 3,8 4,6 7,7 7,9 8,4 9,0 12,1 14,3 18,2 24,5 31,1 -60 -50 -40 -30 -20 -10 0 10 20 30 40 Korea Luxembourg Poland Israel Mexico Portugal Switzerland Spain Australia Canada Japan United States Estonia Norway United Kingdom Hungary Iceland Belgium Turkey Slovenia Czech Republic Netherlands Italy Denmark Chile Germany Sweden Slovak Republic Greece
28
3 PENSION FUNDS AND REAL ESTATE
Real estate represents the most important alternative asset class in portfolio of institutional investors. In accordance with Andonov et al., (2012), which analysed 884 U.S., Canadian, European and Australian/New Zealand pension funds real estate investors for the period 1990-2009, they document that around 75% of the pension funds in the survey invest in real estate - the most important asset class after equity and bonds - and represents, on average, 5,36 percent of fund assets.
Apart from the evidence of data, however, there is no doubt that the real estate investment represents an alternative for pension fund real estate investors. This was certainly the case in the past for many pension funds in different countries, for which a high percentage of its assets were in real estate, as an oldest and solid tradition. It might probably be the same in the future, with different methodologies and tools that finance offers (Bocchialini, 2013).
It is also important to note that real estate investment can be mainly divided into direct and indirect investments. As IAS 40 explains, an Investment Property “applies to the accounting for property
(land and/or buildings) held to earn rentals or for capital appreciation (or both). Investment properties are initially measured at cost and, with some exceptions. May be subsequently measured using a cost model or fair value model, with changes in the fair value under the fair value model being recognised in profit or loss.”
Even if direct investments in property are a good degree of protection against unexpected changes in the value of money (Dallocchio & Viani, 2001), they are characterized by some peculiarities with respect to investments firm.
Since real estate is not directly traded on a centralized exchange, the physical real estate market is characterized by relative lack of liquidity, large lot size, and high transactions costs with properties that are fixed at a location and heterogeneous. The low transparency of the real estate marketplace also results in potential asymmetric information. This provides a source of relatively high risk-adjusted returns to those individuals who can obtain costless “quality” information (Georgiev, et al., 2003).
Also, according to Dallocchio & Viani (2001) on direct investments estate weigh the political context and regulation, as well as the role played by investors of public law, likely to make investments for purposes other than profit maximization. While in respect of the issues considered, the Authors emphasized, however, the importance of investment property direct, especially in view of the long
29 term investor, identifying among the reasons that have made over time consolidation of its huge success:
• inflation protection;
• decrease in the overall risk of the portfolio asset; • greater diversification and expected returns of interest.
Diametrically opposed, but sometimes complementary, the direct real estate investments are differing real estate investment fund.
Following a common definition, real estate investment funds are mutual funds that buy, develop and sell property and share profits with investors/unitholders from any capital appreciation on the sale of property. Apart from sale of property, real estate funds also make money from rentals on property owned by them.
The advantages of investing in real estate funds can be summarized in: • Securitization of the investment;
• Spreading risk across multiple properties of different types (residential, office, commercial, industrial, etc.);
• Distribution of investments in different geographical areas with different characteristics; • Creating a portfolio characterized by the best combination of profitability and growth
potential;
• Professional management as a ramp to the investor by the paperwork and tax related to the direct management of the investment property;
Foo (2000) argues that the real estate securitization creates a new way for property owners/developers to directly access to the source of funds from the investors/borrowers via a secondary market for real estate. With the securitization, special purchase vehicle takes over the roles of the traditional deposit-oriented financial intermediary, like banks and finance companies, to facilitate the matching and the exchange of cash flows between investors and property owners/developers. By transferring the property off-the-balance-sheet, it injects liquidity back to the company and also indirectly reduces the gearing of a company with heavy borrowing liability. This is also an effective way by which property developers/owners can diversify their financing risks. They are “insulated” against the floating interest rate risks by diverting from the traditional source of funds in the financial market.
30 The real estate securitization is also functional for diversification infra sector, as participation in a real estate fund ensures, pro rata and broad diversification geographically and typologically (Bocchialini, 2013).
In terms of professional management, the minor paperwork and tax for the investors, it is guaranteed by higher overall capacity of real estate portfolio management recognized funds than that achievable by non-professional, because of their knowledge of the industry and their degree of specialization (Biasin, 2003).
The difference between direct or indirect investment in real estate is argument of historical debate among scientific literature.
Andonov, et al. (2012), regarding performance, calculated that larger funds, with direct access to real estate markets, obtain higher returns and the management costs are significantly lower due the strong economies of scale. On the other hand, greater external management and allocation to fund-of-funds considerably not only increase the overall investment costs, but also leads to underperformance. Also Georgiev, et al. (2003) investigating the benefits and advantages of investing in real estate, conclude that direct investment leads to positive effects of diversification in a portfolio of stocks and bonds. In contrast, it is demonstrated that indirect investments, as holders of a higher correlation to the market, are not able to allow an effective range effect.
Concluding, the literature also focuses on the risk and return between portfolios of non-real estate mutual funds and the portfolios of real estate funds. Again, Andonov, et al., (2012), examining the impact of combining real estate funds with non-real estate funds categorized according to the stated objective in the fund’s prospectus, found that including real estate mutual funds in a portfolio of mutual funds reduces the systematic risk of the portfolio, regardless of the returns performance of the real estate mutual funds. Additionally, during periods of positive returns for real estate mutual funds, their inclusion will also increase the portfolio return.
This dissertation, analysing the twenty biggest pension funds in United Kingdom in the 2014 and ten Italian pension funds, during the 2009-2013 period, will attempt to demonstrate the differences between the systems in the real estate asset allocation. Where possible, the geographical and typological diversification of real estate investment will be analysed, as well as the nature of the direct and indirect investment.
31
4 RESEARCH OBJECTIVES AND METHODOLOGY
Following the issues discussed above, the analysis conducted in this dissertation aims to highlight and understand the differences and characteristics that exist between two samples of pension funds in the United Kingdom and Italy, in the allocation of real estate asset class of their investment portfolio.
Specifically the analysis aims to answer these questions:
• What is the space of real estate asset allocation in portfolio investment, in United Kingdom and Italy pension fund, during 2009-2013 period? An analysis of its evolution.
• What are the different real estate investment instruments used between the two samples analysed? How much do they use direct investment? What is the allocation for REITs and real estate funds? An analysis of its evolution.
• What are the typological and geographical differences in real estate investments? Which kind of property is preferred? Where?
In order to achieve the objectives described, the work involves the construction of two separate samples, one for the United Kingdom and the other for Italy.
The UK sample takes into account the first largest twenty pension funds ranked by total assets, in millions of pounds, as of June 30, 2014 by Pension&Investments. They represent approximately £ 381 billions in 2013, more than 23% of all pension funds (£1.625 billions) in United Kingdom in the same year (OECD, 2014).
Specifically for UK pension funds are analysed: Universities Superannuation Scheme, BT Pension
Scheme, Lloyds TSB Group pension scheme, Royal Bank of Scotland scheme, Barclays Bank pension scheme, Railways Pensions Trustee, British Petroleum, HSBC Bank pension scheme, British Airways pension scheme, BAE Systems pension scheme, National Grid pension scheme, Shell International pension scheme, Strathclyde Pension Fund, Greater Manchester Pension Fund, Tata Steel UK pension scheme, Mineworkers' Pension Scheme, Aviva pension scheme, GlaxoSmithKline pension scheme, British Broadcasting Corporation pension scheme, West Yorkshire Pension Fund.
On the other hand, the Italian sample takes into account ten “existing” pension funds, the only ones allowed to invest both directly and indirectly in properties and with a substantial real estate component in their portfolio asset. This kind of “pre-existing” pension funds are supplementary pension schemes already operating the entry into force of the legislation (Decree 124/1993) that, for the first time in Italy, has governed in an organic system of complementary pensions (Bocchialini,
32 2013). They are roughly 14,25 billion € in 2013, more than 50,5% of all “pre-existing” pension funds (28,2 billions €) and more than 14,8% of all pension funds (95,83 billions €).
Particularly for Italian pension funds this study analysed: Fondo pensione per il personale Cariplo,
Fondo pensioni per il personale BNL, Fondo pensione per gli agenti di assicurazione, Fondo pensione di previdenza Bipiemme, Fondo Pensione Nazionale per il personale delle Banche di Credito Coperativo e Casse Rurali e Artigiane, Cassa di previdenza integrativa per il personale dell’Istituto Bancario San Paolo di Torino, Fondo di previdenza per i dirigenti di aziende commerciali e di spedizione e trasporto “Mario Negri”, Fondo pensione per il personale della Banca di Roma, Fondo pensione per il personale delle aziende del Gruppo Unicredit, Cassa di previdenza del personale della Cassa Risparmio di Parma e Rovigo.
Both samples analysed refer to the five-year period, from 2009 to 2013. The work done, is based on annual reports available from various websites of pension funds. In detail, data was elaborated from asset sheets, budgets and other relevant source in reports. Obviously, due to the many differences in the reports, the items have been reclassified and regrouped in macro entries, to exemplify the objectives of comparison. The macro entries considered are: Fixed income, Equity, Cash and Other, Alternatives and Property (See table 2). Furthermore, the items in the financial statements “pooled investment vehicles” are separated, according to the different types of investment, and re-categorised into the macro entries showed before.
Macro entries Items
Fixed income Fixed interest, inflation linked, index linked gilts, non-government and government
bonds, corporate bond funds, Index-linked pooled fund, commodities pooled fund.
Equity National equities, overseas equities, emerging market equities, equity investment
funds, private equity, global equity pooled fund.
Cash and Other Cash, liquidity funds, cash instruments, cash pooled funds, accrued incomes, rothesay life buy-in, outstanding settlements. Including all other marginal.
Alternatives Alternative assets, hedge funds, reinsurance (OEICs) vehicles, multi strategy
alternative credit funds, asset-backed pension contribution schemes, derivatives, avc & similar, joint venture, investments held through. Including other alternative activities.
Property Direct property investment, pooled investment vehicles which invest in property,
investments or shares of REITs, property companies, limited property partnership.
33 As for the study of asset allocation estate, however, under the macro-item “property” are identified of further subcategories. The subdivision runs into two different levels: one economic-financial and one typological-geographical. Where possible, for the first level, are modelled three categories: direct property investment, indirect property investment and other property activities (See table 3).
Property Description
Direct property Investment owned property
Indirect property investment shares of property companies, pooled investment
vehicles’ property investments, limited property partnership, investments or shares of REITs;
Other property activities Other marginal property activities
Table 3. Property economical-financial items.
For the second level, on the other hand, where reports and budgets permitted it, are extrapolated data about typology (commercial, residential, offices, etc.) and geographic (overseas, national, city, address) property. Consequently, for the Italian side, the availability of reasonable number of data for the direct investment properties has made possible to map, via PowerMap, more than 2 billions € of buildings for five years.
In the next few chapters this study will present the two analyses of pension funds taken into account in the United Kingdom and Italy. It will then compare the two systems through macro indicators and finally offer a conclusion of the research. In conclusion, it will then present a development scenario for Italian pension funds.