Physics, Mechanics & Astronomy
p r i n t - c r o s s m a r k October 2019 Vol. 62 No. 10: 107008 https://doi.org/10.1007/s11433-018-9408-2c
⃝Science China Press and Springer-Verlag GmbH Germany, part of Springer Nature 2019 phys.scichina.com link.springer.com
.
Article
.
Special topic: New advances in water and water systems
The onset of the tetrabonded structure in liquid water
Carla Andreani
1,2, Carmelo Corsaro
3, Domenico Mallamace
3,
Giovanni Romanelli
4*, Roberto Senesi
1,2, and Francesco Mallamace
5,61Dipartimento di Fisica and NAST Center, Universit`a degli Studi di Roma Tor Vergata, Rome 00133, Italy; 2CNR-IPCF, Istituto per i Processi Chimico-Fisici del CNR di Messina, Messina 98158, Italy;
3Dipartimento MIFT, Universit`a di Messina, Messina 98166, Italy;
4ISIS Facility, Rutherford Appleton Laboratory, Chilton, Didcot, Oxfordshire OX11 0QX, UK; 5Istituto dei Sistemi Complessi (ISC) – CNR, Rome 00185, Italy;
6Center for Polymer Studies and Department of Physics, Boston University, Boston 02215, USA
Received December 18, 2018; accepted April 3, 2019; published online May 27, 2019
Water properties are dominated by the hydrogen bond interaction that gives rise in the stable liquid phase to the formation of a dynamical network. The latter drives the water thermodynamics and is at the origin of its well known anomalies. The HB structural geometry and its changes remain uncertain and still are challenging research subjects. A key question is the role and effects of the HB tetrahedral structure on the local arrangement of neighboring molecules in water. Here the hydrogen dynamics in bulk water is studied through the combined use of Neutron Compton Scattering and NMR techniques. Results are discussed in the framework of previous studies performed in a wide temperature range, in the liquid, solid, and amorphous states. For the first time this combined studies provide an experimental evidence of the onset of the water tetrahedral network at T∼315 K, originally proposed in previous studies of transport coefficients and thermodynamical data; below this temperature the local order in water changes and the lifetime of local hydrogen bond network becomes long enough to gradually develop the characteristic tetrahedral network of water.
water, neutron compton scattering, NMR PACS number(s): 29.30.Hs, 82.56.b, 05.70.Fh
Citation: C. Andreani, C. Corsaro, D. Mallamace, G. Romanelli, R. Senesi, and F. Mallamace, The onset of the tetrabonded structure in liquid water, Sci. China-Phys. Mech. Astron. 62, 107008 (2019),https://doi.org/10.1007/s11433-018-9408-2
1 Introduction
Water, essential to life, is still a challenging research sub-ject [1,2]. If compared with other materials, water is, in the thermodynamical sense, a very complex system with many anomalies characterizing its phase diagram, particu-larly in the liquid phase [3]. Such anomalies are at the origin of the many open questions regarding both dynam-ical and structural water behaviors [4-9]. For these rea-sons, water has been, and still is extensively studied using
*Corresponding author (email:[email protected])
a variety of experimental and theoretical models [10-14]. Experiments range from classical collective thermodynamic techniques (such as dielectric constant or specific heat), to investigations probing the microscopic order (such as X-ray and neutron diffraction and nuclear magnetic reso-nance (NMR) spectroscopy [15]), and from vibrational spec-troscopy (such as Raman, infrared and inelastic X-ray [16-18] and neutron scattering) to the study of single-particle dynam-ics using neutron compton scattering (NCS) [19-22]. Despite these efforts, a thorough understanding of the structure of liq-uid water in the whole pressure-temperature (P-T ) diagram is
still matter of debate within the scientific community. Current results from experiments, simulations, and models converge on the fact that the intermolecular hydrogen bond (HB) interactions determine the chemical physics of bulk wa-ter and its solutions [23], and that the HB structure in liquid water is temperature dependent [2].
Upon cooling, the HB interaction in water orders the near-est neighbor molecules, that gradually assume the charac-teristic tetrahedral ice-like geometry: each water molecule having four nearest neighbors, a hydrogen receptor to two of them and a hydrogen donor from the other two. As opposed to the permanent four-coordinated network held together by HB in ice, the network in the liquid phase is local and tran-sient. Areas of local tetrahedral order possess a larger spe-cific volume than the overall average; the entropy, on the other hand, always decreases upon cooling because the spe-cific heat is, of necessity, positive. Thus, as T decreases, for the progressive increase in tetrahedral order, the local specific volume increases. Recent studies on the thermodynamical re-sponse functions suggest that the onset of these tetrahedral water “patches” occurs at T∗ ≃ 315 K, whereas at higher temperatures the water behavior is the same of a simple liq-uid [24]. The situation is illustrated in Figure1, where the thermal expansion coefficient, αP(T, P), is shown as a func-tion of temperature for several different pressures in the range 1 bar-8 kbar.
Taking into account that αP(T, P) represents the cross-correlations of the volume (V) and entropy (S ) fluctuations αP∼ ⟨∆S ∆V⟩, one can note the existence of a universal tem-perature where all curves cross each other, i.e., a crossover for the water behavior from simple to anomalous liquid [24,25]. In particular, in the high-temperature regime (right side of the picture with respect to T∗), water behaves as a normal liquid,
1.5 1.0 0.5 0.0 −0.5 −1.0 200 250 300 350 400 450 T (K) 8 kbar 7 6 5 4 3 2 1.6 1.4 1 0.6 1 bar T *~315 K α P~ δSδV! αP (mK − 1)
Figure 1 (Color online) The temperature dependence of the thermal ex-pansion coefficient at several different pressures in the range 1 bar-8 kbar. The universal expansivity point, where all curves cross, is well evident and indicated by the arrow. Figure adapted from refs. [24,25].
whereas all water anomalies belong in the left side of the pic-ture. An example can be found in the self-diffusion coeffi-cient of water studied by Simpson and Carr [26] using NMR experiments. The latter shows that, at the same crossover temperature, a change in the behavior of the transport pa-rameter occurs, from an Arrhenius at T> 315 K to a super-Arrhenius at T< 315 K, accompanied by the violation of the Stokes-Einstein relation.
In a recent work, from αP(T, P) cross-correlations, KT(T, P) isothermal compressibility, and NMR self-diffusion coefficients, it has been suggested that T∗represents the on-set of the HB network, thus of the water anomalous behav-ior in the supercooled regime, such as the negative value in αP(T, P). This suggests that in water two “phases” coexist, one of which is composed by the transient HB network and the other by the remaining molecules, i.e., water is polymor-phic for T<T∗ [27], a situation like the one experimentally observed in amorphous ice [28-30]. Ice polymorphism is at the origin of special scenarios proposed to reproduce the chemical and physical properties of water, and especially to explain the thermodynamics of the liquid phase based on the HB interaction [27,31]. Currently, three are the hypothe-ses of main interest: the stability limit conjecture (SLC), the singularity-free scenario (SF), and the liquid-liquid phase transition (LLPT). The latter two assume that water prop-erties are the result of HBs creating local transient struc-tures composed of many molecules, increasing in number as temperature decreases [2]. These local “patches”, or HB sub-domains [32,33], enhance the thermodynamical fluctua-tions (specific volume and entropy and their negative cross-correlations) with anomalies that closely resemble those ob-served experimentally. The two obob-served amorphous states are the corresponding vitreous forms of low-density liquid (LDL) and high-density liquid (HDL) water. The difference between the SF and the LLPT is that, upon supercooling, the response functions increase sharply yet remaining finite in the first case, as opposed to a transition with critical fluctu-ations in the case of LLPT. The latter model also defines a special locus in the P-T plane, the Widom line, where the HB network is fully realized, with the LDL phase dominat-ing the HDL, and the water thermodynamics is character-ized by maxima in the response-function fluctuations. The corresponding temperature is referred to as TL, and at am-bient pressure TL ≃ 225 K [34]. Such a picture is con-firmed by experiments in confined water and simulations in the bulk [35-38]. By decreasing T (and increasing P) the Widom line converges to a critical point (the liquid-liquid critical point, LLCP) where fluctuations diverge and the LDL phase dominates the liquid structure. In this context, the de-scription of the T -dependent structure of water in terms of the HB properties (life-time, strength, length and angular
distri-butions) represents an interesting challenge.
This paper presents a combined NCS and NMR study of the local order in water in a broad temperature inter-val from the critical region to the deep supercooled phase. New NCS measurements have been performed in a T range around T∗ ≃ 315 K. NCS, also known as deep inelastic neu-tron scattering (DINS), is a unique technique to measure the ground-state dynamics of atomic nuclei [39], routinely used to derive the hydrogen momentum distribution, n(p), and hy-drogen mean kinetic energy, ⟨EK⟩ in liquid water [40] and
ice [41,42], heavy water [43], and water confined in porous materials [44,45]. These physical quantities provide infor-mation on the local environment of the H nucleus in the HB network [46]. NCS operates in a scattering regime of high momentum,~q, and energy, ~ω, transfers i.e., ~q up to hun-dreds of Å−1and~ω up to hundreds of eV [39]. As far as NMR is concerned, the magnetic shielding tensor σ mea-sured by this technique relates the applied magnetic field to the local field experienced by the magnetic moment of the studied hydrogen proton (i.e.,1H NMR). The sensitivity of
the shielding tensor to the local electronic environment makes NMR a powerful probe of the local environment [47-49]. Re-sults from NMR and NCS complement those obtained from the diffraction studies. Both NMR and NCS provide mass-resolved experimental spectra. In the case of NCS, individual nuclei appear as independent peaks Doppler broadened by the motion of the nucleus in the surrounding local potential due to nuclear zero-point and thermal energies [39].
By combining results from present NCS and NMR mea-surements with those obtained in previous investigations, we have been able to mirror the water structural changes, and show the onset of the HB tetrahedral structure as well as its growth by decreasing temperature. The onset occurs around T∗≃ 315 K. These results show the thermal evolution of the local dynamics of HB “patches” in water, confirming the ex-istence of two states in liquid water inside the stable phase.
2 Methods
2.1 Neutron compton scattering
NCS measurements on water around T∗ ≃ 315 K were per-formed to determine the hydrogen n(p) and mean kinetic en-ergy⟨EK⟩ [50]. NCS measurements were carried out on the
VESUVIO beamline at the ISIS pulsed neutron and muon source (Rutherford Appleton Laboratory, Chilton, Didcot, UK) [51,52]. Liquid water was contained in a flat alu-minium container with sample thickness of 0.5 mm and in-ner contaiin-ner surfaces coated with a 0.01-mm-thick Poly-tetrafluoroethylene (PTFE) layer. NCS measurements were
performed at four temperatures, 300, 315, 320, 325 K and at atmospheric pressure. Temperature was controlled with the precision of 0.1 K. Details of the experimental apparatus and measurement technique are reported in previous papers [22,53,54]. NCS is described within the framework of the impulse approximation (IA) [20,55], valid at high energy and momentum transfers [21,56,57], with the scattering intensi-ties centred along the atomic recoil lines [21]. In the present experiment, the momentum and energy transfer were in the ranges 27 Å−1< }q < 230 Å−1and 2.5 eV < }ω < 800 eV, respectively. From each l-th detector, we obtained a hydro-gen neutron compton profile, Fl(y, q). These functions repre-sent the hydrogen longitudinal momentum distribution along the direction of q. Full details on the NCS formalism, the experimental set up, measurements, and data analysis are re-ported in theSupporting informationonline. The average of individual Fl(y, q) functions, namely F(ey), is a useful quan-tity to appreciate the quality of the data and fits. For each sample, a global fit over individual spectra was accomplished using a parametric model for the n(p), i.e., a three dimen-sional anisotropic Gaussian line-shape derived from a quasi-harmonic model [58]. The latter has been employed in previ-ous NCS investigations to reveal the local environment of hy-drogen in polycrystalline ice [42,54], amorphous ice [59] and heavy water [43]. Within this framework, the experimental n(p) of an amorphous sample, such as a liquid, can be mod-elled by spherically-averaging a multivariate Gaussian func-tion according to the following equafunc-tion [42]:
4πp2n(p)= ⟨ δ(p − |p|) √ 8π3σ xσyσz exp − p 2 x 2σ2 x − p 2 y 2σ2 y − p 2 z 2σ2 z ⟩ . (1) The set of parameters σα (α = x, y, z), determines the anisotropy in the momentum distribution, with the z direc-tion usually assumed along the direcdirec-tion of the OH covalent bond, and x and y in the perpendicular plane.
In the case of a nucleus in a harmonic and isotropic po-tential, n(p) depends only on the momentum modulus p = (px, py, pz) , and it can be expressed as an univariate Gaus-sian function of the form:
n(p)= (1/√2πσNCP) exp(−p2/2σ2NCP), (2)
whereσ2 NCP =
∑
ασ2α/3 [39]. In these terms, σNCP is
re-lated to the ground-state nuclear mean kinetic energy as: ⟨EK⟩ = 3~2σ2NCP/2M. We notice that in a liquid or
amor-phous material molecules are randomly oriented with respect to the laboratory reference of frame, thus requiring the angu-lar average in eq. (1). However, the average of a multivari-ate Gaussian function still differs from a univariate Gaussian
function of widthσNCP. The difference between the two
func-tions can be generally expressed as a series of Hermite poly-nomials with each coefficient being a function of σα [53]. Therefore, the local anisotropy in the local potential affecting hydrogen is an accessible observable in DINS experiments even for liquid or amorphous samples.
2.2 Nuclear magnetic resonance
NMR experiments were performed at ambient pressure in the temperature interval 265 K< T < 335 K (with steps of 1 K) using a Bruker AVANCE NMR spectrometer (Germany) op-erating at 700 MHz proton resonance frequency. The temper-ature was controlled with a stability of 0.05 K. We measured the chemical shift bδ according to standard procedures de-scribed elsewhere [60]. In addition, literature data for ice and water were also considered. The experiment was performed on bulk water in a thermodynamic region previously explored with apparati of different sensitivity, providing a new set of data with denser T sampling and better resolution [61-63].
In NMR experiments, one measures the chemical shift bδ as the change of resonance frequency of a nucleus with respect to a given standard, and the magnetic shielding tensorbσNMR is then obtained from the relation:
bδ= 1σNMR iso − bσ
NMR, (3)
where 1 is the unit matrix andσNMRiso is the isotropic value or trace (σNMR
iso ≡ Tr(bσ
NMR/3)) of the shielding tensor of
the standard reference used in the NMR experiments. It is assumed thatδ corresponds to a linear response of the elec-tronic structure of the system under investigation to an exter-nal magnetic field B0, as B( j) = (1 − δj)B0, where j is an
index identifying the chemical environment [47,48]. Both bδ andbσNMRcan be measured by the free induction decay (FID)
that contains information about the set of all nuclear species in the studied sample whose resonance frequencies lie within the harmonic content of the NMR radio frequency (RF) pulse [63].
For a molecular liquid (like water)bσNMR is nearly
axi-ally symmetric, and it is obtained by the isotropic average σNMR
iso and the anisotropy∆σ
NMR= σNMR 33 −(σ NMR 11 +σ NMR 22 )/2 (σNMR 11 ,σ NMR 22 , andσ NMR
33 are the three principal components
ofbσNMR). σNMR
iso is given by the measured proton chemical
shift relative to a reference state through the relation [64,65] δ = σNMR,ref iso − σ NMR iso + ( A−1 3 ) (χref− χ), (4)
whereχ is the magnetic susceptibility and A depends on the sample shape and orientation (for a sphere A = 1/3). If the isotropic shielding reference value,σNMRiso ,ref, is obtained in an
absolute scale, the value ofσNMR
iso can be directly obtained by
the measured chemical shift [63].
The shielding tensor was used for the ice HB struc-ture [65]; and in the stable liquid phase and near its criti-cal point (and thusσNMR
iso ) it is affected by the HB depletion
of the electron density around the proton [15,66], whereas the induced magnetic field by the acceptor oxygen electrons perturbs the anisotropy [67]. This stresses the primary role of HB and of the corresponding tetrahedral network in wa-ter systems. More precisely, the HB geometry can be de-termined by combining protonbσNMR measurements and ab
initio density functional theory (DFT) calculations. In such a way the moments of the distributions of HB length (RHO) and angle (β) measures the thermal disorder of the HB net-work, whereas the chemical shift is related to the average HB number [15,61].
For water in the stable liquid phase, the fast molecular tum-bling isotropically averages its shielding anisotropy. Well dif-ferent is, instead, the situation in the deep supercooled regime and for amorphous water (LDA and HDA) for the effects of the growing HB network. While in the liquid water stable phase the HB life-time is of the order of some picoseconds, on going toward the amorphous phase via the supercooling, such a time grows of many orders of magnitude by increasing not only the HB network stability but also its size. In such a situation a certain influence in the NMR tensors (δ and σ) is detectable. These structural effects can be determined as asymmetries in the NMR line-shapes or from its contribution to the proton spin relaxation rate (see e.g., ref. [66]).
3 Results and discussion
Despite the different radiation-matter interaction underpin-ning compton scattering (CS) and NMR, the scattering ma-trix involved in the process is essentially the same. Hence, one can assume that both the shielding tensor and the mo-mentum distribution mirror the same anisotropy of the H potential [18]. In general terms, CS techniques are unique probes of the ground-state momentum density of electrons (X-ray CS, XCS) or nuclei (NCS) in materials [17]. Both XCS and NCS, when benchmarked with computer simula-tions [18,42,54,68], have emerged as important techniques to interpret the local molecular structure of water and the ef-fects of changes in the HB network on the local coordina-tion. As far as the electron momentum density is concerned, a study of liquid water based on NMR and XCS was pre-sented in ref. [18]. The XCS measurements were performed at T = 273.5, 277, 288, 298, 323, and 363 K, with data at 298 K used as a reference (an analogous study was also re-ported from D2O [69]). In that work, changes in the
X-ray compton profile (XCP) were observed upon increasing T within the stable liquid phase, and related to the HB weaken-ing. By combining DFT and the NMR data on the distribution function of the HB geometries [66], the XCPs have been re-lated to the angle and OH distance of HBs. Results from the XCS study of liquid water [18] showed significant difference for T above 320 K with respect to T below 320 K. In particu-lar, XCS results showed a change in the HB behaviors at T< 320 K, for q≃ 1 and q ≃ 1.8 (atomic units) where the XCPs are sensitive to the correlation between the intramolecular bond length and the HB geometry [18,69].
One should notice that CS is sensitive to the local HB structure, as it involves high values of the momentum trans-fer, whereas NMR provides a spatial average over the HB network for, in this case, q ≃ 0. To enforce this point, we show in the following discussion how NCS data are sensitive to a clear HB rearrangement near T∗, and by comparison to NMR results in the same temperature range, they support the idea of the onset of the local tetrabonded structure in liquid water.
Figure2shows the hydrogen chemical shift in liquid water, δ, as a function of the temperature from the critical region to the deep supercooled regime [61,63]. Data in the case of wa-ter confined in emulsions [70] and in nanotubes [60] are also considered. The enlarged region around 315 K, shown in the inset, allows a more precise observation of the change in the chemical shift strictly related with that in the local order of
6 5 4 3 2 50 100 150 200 250 300 350 400 450 500 550 600 T (K) δ (ppm) 250 300 350 5 4 T *~315 K
Figure 2 (Color online) The water chemical shift,δ, measured in bulk water (blue triangles, actual data), from the critical region to the deep super-cooled regime (blue circles) [61,63]. In the latter regime, the corresponding values ofδ are measured for water inside large capillary (empty red circles), and emulsions with radius of the order of 10 µm (green diamonds) [70]. The δ(T) chemical shift data of water confined in nanotubes of the Å size (black squares) [60] and ice (red circle) [71], polycrystalline ice (red square) [62] are also reported. The dotted red and blue lines are the data fitting in the regions 330–370 K and 390–580 K, respectively. The inset shows a zoomed region around 315 K in order to highlight the changes of the local order reflected in the change of the NMR chemical shift.
the system. It can be observed that theδ(T) chemical shift increases by decreasing T , up to a maximum at about T ∼ 220 K, then decreases down to the values of polycrystalline ice (large red squares). The several studies carried out on δ(T) suggest that this physical quantity provides a direct mea-surement of the number of HBs in water. Thus, from Fig-ure2, near the critical region and in the gas phase one ob-serves only water monomers and dimers, whereas in the liq-uid phase at ambient condition water trimers and tetramers are formed [46,61,63]; the slope of theδ(T) chemical shift crossover at about 370 K marks the distinction between these two regions.
Figure3 shows the experimental averaged F(ey) for H as a function of the y (black circle) at 300 K from our new NCS measurements, and its best fit (continuous line); the in-sert shows the radial momentum distribution, 4πp2n(p), as a
function of p [21,22,53], withσNCP being the variance. In
the case of water at T=300 K, the resulting parameters ob-tained from the fit using eq. (2) are:σNCP=(4.85 ± 0.03) Å−1
and⟨EK⟩ = (146 ± 2) meV, and additional details on the
fit-ting procedure and results are provided in theSupporting
in-formation. Results of similar statistical accuracy have been
obtained for the NCS data sets at the other temperatures of the experiment.
Figure4shows the H mean kinetic energy⟨EK⟩ obtained
from the present and previous experiments at different tem-peratures in the liquid and supercritical phases together with several forms of ices. In particular, the figure reports NCS data from: ice Ih at T=5, 71 [54] and 271 K [72]; amorphous ices at T= 80 K [59]; and liquid and supercritical water at T = 300, 423, 523, 573, and 673 K [73]. We observe that the ⟨EK⟩ value decreases from ⟨EK⟩ = 178 meV, in the
supercrit-ical region at T = 673 K, down to about ⟨EK⟩ = 148 meV, at
T=315 K, then significantly increasing to ⟨EK⟩ = 155 meV
0.09 0.08 0.07 0.06 0.05 0.04 0.03 0.02 0.01 0.00 −20 −10 0 10 20 30 y (Å−1) ~ p (Å−1) F ( y) (Å) ~ 0 10 20 0.12 0.08 0.04 0.00 4 p 2n( p) (Å)
Figure 3 (Color online) The F(ey) function for H at 300 K (black circles) and the best fit (continuous line). The insert reports the 4πp2n(p) function
when crossing the melting temperature, finally slowly de-creasing at lower temperatures. The main contribution to the nuclear ground-state energy arises from the water vibra-tional modes [22], that are sensitive to both the intramolecular structure and geometry, as well as to the changes of the local HB network. We interpret the increase in kinetic energy at T ∼ 315 K as due to the change of the molecular order, and particularly to the onset of the tetrahedral network at this tem-perature. To the best of our knowledge, so far this behavior of NCS results has been observed for liquid water only, whereas in other liquids⟨EK⟩ increases monotonically as temperature
increases. Therefore, for the first time NCS studies provide an experimental evidence of the onset of the water tetrahedral network at T∗∼ 315 K.
Refs. [74,75] report X-ray and neutron diffraction results on water and ice over a wide temperature range. One can notice that the significant changes in the O-O pair distribu-tion funcdistribu-tion between crystalline ice, amorphous ices, and liquid water are all well mapped onto measurable changes in the hydrogen⟨EK⟩ in Figure 4. On the other hand, the
same refs. [74,75] show no significant change in the di ffrac-tion observables in liquid water across T∗. Such discrepancy with our NCS results can be explained by considering that a quickly changing HB structure can be captured in NCS ex-periments, where the high-energy transfer allows the prob-ing of the system on the fs time scale. The same HB struc-tural rearrangement can elude diffraction techniques, where the time scale probed coincides with the time of the measure-ment. Moreover, it has been recently pointed out [78,79]
180 170 160 150 140 0 100 200 300 400 500 600 700 T (K) EK (meV)
Figure 4 (Color online) The H mean kinetic energy⟨EK⟩ obtained from the
NCP measured at different temperatures in the liquid and supercritical phases together with several types of ices: ice Ih (grey circles) at T=5, 71 [54] and 271 K [72]; amorphous ice (dark-blue circles: low density as empty cir-cle; high density as crossed circir-cle; and very high density as dotted circle) at 80 K [59]; and water in the stable liquid and supercritical phases (dark green circles) at T= 300, 423, 523, 573 and 673 K [73]. Dark-blue diamonds refer to data around density maximum [76]; dark blue squares at 271 and 300 K from ref. [77]; and dark-blue triangles refer to the present data.
how a certain level of discrepancy on the measured value of the O-O distance still remains in the literature.
The idea of the temperature T∗was originally proposed in previous studies of the transport coefficient and other ther-modynamic data [24,25], where it was suggested that T∗was at the origin of the anomalous behavior of liquid water and the coexistence of two distinct liquids in water. In fact, by considering old and new data of both the isothermal com-pressibility KT(T, P) and the coefficient of thermal expansion αP(T, P), it was observed that KT(T, P) showed a minimum at T∗≃ (315±5) K for all the investigated pressures. Moreover, from theαP(T, P) behavior, it was observed that the curves at different P, crossed at the same T∗. In other words, these data show a “singular and universal expansivity point” at T∗ andαP(T∗)≃ 0.44 × 10⁻³K−1(Figure1). This temperature, unlike other water singularities, is thermodynamically con-sistent, as one can consider the relationship connecting the two thermodynamic response functions [25].
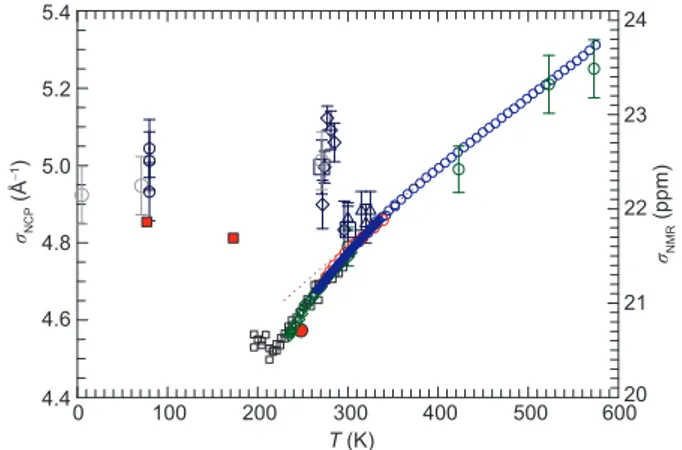
Although NCS and NMR do not provide a direct measure-ment of the HB length and angle (and their correlations) as a function of the thermodynamic variables, the two techniques are sensitive to water’s anisotropy throughσNCP andσNMRiso ,
respectively. As mentioned, NMR averages the local order and anisotropy on a more large length scale (mesoscopic) than the NCS, whereas the latter investigates the local po-tential at the atomic scale. Such a difference becomes appar-ent when looking at Figure 5, where we plot bothσNCP(T )
andσNMRiso (T ) as functions of temperature. These quantities are plotted on two different vertical scales: on the left side σNCP(T ) is expressed in Å−1, and on the right sideσNMRiso (T )
in ppm. Apart for an overall multiplicative factor, their ther-mal evolution is the same in the range 320 K< T < 600 K within the experimental error bars:σNCPand σNMRiso decrease
5.4 5.2 5.0 4.8 4.6 4.4 0 100 200 300 400 500 600 24 23 22 21 20 σNMR (ppm) σNCP (Å − 1) T (K)
Figure 5 (Color online) The temperature behaviour ofσNCP(T ) (left scale)
andσNMR
iso (T ) (right scale). σ NMR
iso is obtained from the chemical shift data
reported in Figure2whereas the NCP data are obtained from the mean ki-netic energy⟨EK(T )⟩ reported in Figure4. We have used the same symbols
practically at about the same rate as T decreases. On the other hand, a marked difference is observed in the low tempera-ture regime: on decreasing temperatempera-ture,σNMRiso decreases with continuity well inside the supercooled regime with a mini-mum at T ∼ 220 K; on the contrary, σNCP shows a sharp
increase below T∗, then again in the proximity of the density maximum at T ∼ 277 K.
The differences observed between σNCP(T ) andσNMRiso (T )
can be readily explained by considering the different scatter-ing wave-vectors correspondscatter-ing to the two techniques. On the one hand, NMR studies rely on values of the momentum transfer q≡ 0, thus probing the response of the system over an averaged macroscopic spatial scale. On the other hand, the formalism of NCS, i.e., the IA, assumes q→ ∞, exper-imentally achieved with q values around tens to hundreds of Å−1, over spatial scales of the fraction of the OH distance. Moreover, NCS also relies on large values of energy transfers, probing the system over the fs time scale. In this framework, it is possible to rationalize the different behavior of σNCP(T )
andσNMRiso (T ) by the onset of phenomena that are both tran-sient and very localised, and taking place at T∗≃ 315 K and lower temperatures. While NCS probes the single-particle dynamics, we suggest that the change in value of⟨EK⟩ also
reflects structural ordering of the system, through the depen-dence of the vibrational modes on the molecular geometry, as well as the change in shape of the nuclear momentum dis-tribution, also mirroring the effect of intramolecular interac-tions.
Thus, we identify T∗ as the temperature marking the on-set of water HB tetrahedral structure or, more precisely, the LDL phase, that increases in size and stability on decreasing the temperature, and it is at the basis of the water anomalies. The observed T -behaviour ofσNCP(T ) reflects an increase in
the correlation length of the structural fluctuations, confirm-ing the suggestion of previous experimental and theoretical studies [11,80,81]. It must also be stressed that, assuming the existence of the two liquid phases, at temperatures about T∗the HDL molecules dominate in number those of the LDL phase, whose number increases only by decreasing T . At lower temperatures, their population fraction is inverted [36], corresponding to the increase in the cooperative or tetrahedral character of HB, observed by experiments and numerical cal-culations [11,82] at temperatures near the Widom line.
On the other hand, the NMR probe, working on macro-scopic lengths, is insensitive to small sizes of the HB net-work, yet it reflects the thermal evolution of the averaged wa-ter HB length and angular distributions. Moreover, when the LDL water network dominates the HDL phase, and its char-acteristic size increases up to the mesoscopic size, the NMR sensitivity augments, presenting the observed minimum at T ≃ 220 K. At this temperature, the HB network is fully
realized, with the LDL phase dominating over the HDL one, and the water thermodynamics is characterized by maxima in the response functions fluctuations.
4 Conclusions
The local order of liquid water at different temperatures, from the supercooled regime to the superheated ones, and in dif-ferent forms of ice and glasses has been discussed in the framework of NCS and NMR measurements. In particular, the standard deviation of the nuclear momentum distribution, σNCP from NCS data, and the isotropic part of the magnetic
shielding tensorσNMRiso (T ) from NMR experiments, have been presented as providing information about the same underly-ing anisotropy of the system. While NCS, probunderly-ing the system over spatial scales of the order of the Å and timescales of the order of fs, is a sensitive probe of the local potential affecting hydrogen, NMR, working at momentum transfers q= 0, pro-vides structural and dynamical details averaged over larger scales. Despite the two spectroscopic techniques do not probe directly the structure of the system under study, previous in-vestigations have proved that they are sensitive to the rear-rangement of the hydrogen-bonding network in water. In this framework, the data discussed in this work provide evidence of the onset of a local and transient tetrabonded HB network at T∗ ≃ 315 K and at lower temperatures. Below T∗the HB lifetime becomes long enough to gradually develop the char-acteristic tetrahedral network of water. Our interpretation of the temperature dependence of NMR and NCS data in the deeply supercooled region supports the idea of the coexis-tence of LDL and HDL water phases at T < T∗, and that the size of the HB network increasing to mesoscopic scales for temperatures decreasing down to≃ 225 K, near the Widom line, where LDL water dominates over the HDL phase. This work was supported by the framework of past and present (2014-2020) agreements between the CNR and the STFC for collaborative research be-tween Italy and ISIS.
Supporting Information
The supporting information is available online at phys.scichina.comand http://link.springer.com/journal/11433. The supporting materials are pub-lished as submitted, without typesetting or editing. The responsibility for scientific accuracy and content remains entirely with the authors.
1 H. E. Stanley, Liquid Polymorphism (Wiley, New York, 2013). 2 P. G. Debenedetti, and H. E. Stanley, Phys. Today 56, 40 (2003). 3 P. Ball,Chem. Rev.108, 74 (2008).
4 P. G. Debenedetti, Metastable Liquids (Princeton University Press, Princeton, 1997), p. 407.
5 F. Mallamace, P. Baglioni, C. Corsaro, J. Spooren, H. E. Stanley, and S.-H. Chen, Riv. Nuovo Cimento 344, 253 (2011).
6 F. Mallamace, C. Corsaro, D. Mallamace, P. Baglioni, H. E. Stanley, and S. H. Chen,J. Phys. Chem. B115, 14280 (2011).
7 F. Mallamace, C. Corsaro, S.-H. Chen, and H. E. Stanley, Liquid
Poly-morphism (John Wiley & Sons, Inc., Hoboken, 2013), pp. 203-262.
8 F. Mallamace, C. Corsaro, D. Mallamace, S.-H. Chen, and H. E. Stan-ley, Liquid Polymorphism (John Wiley & Sons, Inc., Hoboken, 2013), pp. 263-308.
9 P. Kumar, and H. E. Stanley,J. Phys. Chem. B115, 14269 (2011). 10 F. Perakis, K. Amann-Winkel, F. Lehmk¨uhler, M. Sprung, D.
Mariedahl, J. A. Sellberg, H. Pathak, A. Sp¨ah, F. Cavalca, D. Schlesinger, A. Ricci, A. Jain, B. Massani, F. Aubree, C. J. Benmore, T. Loerting, G. Gr¨ubel, L. G. M. Pettersson, and A. Nilsson,Proc. Natl. Acad. Sci. USA114, 8193 (2017).
11 V. Bianco, and G. Franzese,Sci. Rep.4, 4440 (2015).
12 P. H. Poole, I. Saika-Voivod, and F. Sciortino,J. Phys.-Condens. Matter 17, L431 (2005).
13 V. Holten, J. C. Palmer, P. H. Poole, P. G. Debenedetti, and M. A. Anisimov,J. Chem. Phys.140, 104502 (2014), arXiv:1312.4871. 14 J. L. F. Abascal, and C. Vega,J. Chem. Phys.133, 234502 (2010). 15 K. Modig, B. G. Pfrommer, and B. Halle,Phys. Rev. Lett.90, 075502
(2003).
16 M. J. Cooper, P. E. Mijnarends, N. Shiotani, N. Sakai, and A. Bansil,
X-Ray Compton Scattering (Oxford University Press, Oxford, 2004).
17 M. J. Cooper,Rep. Prog. Phys.48, 415 (1985).
18 M. Hakala, K. Nyg˙ard, S. Manninen, S. Huotari, T. Buslaps, A. Nils-son, L. G. M. PettersNils-son, and K. H¨am¨al¨ainen,J. Chem. Phys. 125, 084504 (2006).
19 G. I. Watson,J. Phys.-Condens. Matter8, 5955 (1996).
20 J. M. F. Gunn, C. Andreani, and J. Mayers,J. Phys. C-Solid State Phys. 19, L835 (1986).
21 C. Andreani, D. Colognesi, J. Mayers, G. F. Reiter, and R. Senesi,Adv. Phys.54, 377 (2005).
22 C. Andreani, M. Krzystyniak, G. Romanelli, R. Senesi, and F. Fernandez-Alonso,Adv. Phys.66, 1 (2017).
23 D. Eisenberg, and W. Kauzmann, The Structure and Properties of
Wa-ter (Oxford University Press, New York, 1969).
24 F. Mallamace, C. Corsaro, and H. E. Stanley,Sci. Rep.2, 993 (2012). 25 F. Mallamace, C. Corsaro, D. Mallamace, C. Vasi, and H. E. Stanley,
Faraday Discuss.167, 95 (2014).
26 J. H. Simpson, and H. Y. Carr,Phys. Rev.111, 1201 (1958). 27 F. Mallamace,Proc. Natl. Acad. Sci. USA106, 15097 (2009). 28 O. Mishima,Nature384, 546 (1996).
29 O. Mishima, L. D. Calvert, and E. Whalley,Nature314, 76 (1985). 30 O. Mishima, L. D. Calvert, and E. Whalley,Nature310, 393 (1984). 31 H. E. Stanley, P. Kumar, G. Franzese, L. Xu, Z. Yan, M. G. Mazza, S.
V. Buldyrev, S. H. Chen, and F. Mallamace,Eur. Phys. J. Spec. Top. 161, 1 (2008).
32 A. Geiger, and H. E. Stanley,Phys. Rev. Lett.49, 1749 (1982). 33 H. Shintani, and H. Tanaka,Nat. Mater.7, 870 (2008).
34 L. Xu, P. Kumar, S. V. Buldyrev, S. H. Chen, P. H. Poole, F. Sciortino, and H. E. Stanley,Proc. Natl. Acad. Sci. USA102, 16558 (2005). 35 S.-H. Chen, F. Mallamace, C. Y. Mou, M. Broccio, C. Corsaro, A.
Faraone, and L. Liu, Proc. Natl. Acad. Sci. USA, 103, 12974 (2006). 36 F. Mallamace, M. Broccio, C. Corsaro, A. Faraone, D. Majolino, V.
Venuti, L. Liu, C. Y. Mou, and S. H. Chen,Proc. Natl. Acad. Sci. USA 104, 424 (2007).
37 S. Cerveny, F. Mallamace, J. Swenson, M. Vogel, and L. Xu,Chem. Rev.116, 7608 (2016).
38 L. Xu, F. Mallamace, Z. Yan, F. W. Starr, S. V. Buldyrev, and H. Eugene Stanley,Nat. Phys.5, 565 (2009).
39 C. Andreani, R. Senesi, M. Krzystyniak, G. Romanelli, and F. Fernandez-Alonso, Atomic quantum dynamics in materials research, in: Neutron Scattering–Applications in Biology, Chemistry, and
Mate-rials Science, edited by F. Fernandez-Alonso, and D. L. Price,
(Aca-demic Press, New York, 2017), pp. 403-457.
40 R. Senesi, G. Romanelli, M. A. Adams, and C. Andreani,Chem. Phys. 427, 111 (2013).
41 A. Parmentier, C. Andreani, G. Romanelli, J. J. Shephard, C. G. Salzmann, and R. Senesi, Front. Phys. 13, 136101 (2018), arXiv: 1709.07648.
42 D. Flammini, A. Pietropaolo, R. Senesi, C. Andreani, F. McBride, A. Hodgson, M. A. Adams, L. Lin, and R. Car,J. Chem. Phys. 136, 024504 (2012).
43 G. Romanelli, M. Ceriotti, D. E. Manolopoulos, C. Pantalei, R. Senesi, and C. Andreani,J. Phys. Chem. Lett.4, 3251 (2013).
44 G. Romanelli, A. Liscio, R. Senesi, R. Zamboni, E. Treossi, F. Liscio, G. Giambastiani, V. Palermo, F. Fernandez-Alonso, and C. Andreani, Carbon108, 199 (2016).
45 G. Romanelli, R. Senesi, X. Zhang, K. P. Loh, and C. Andreani,Phys. Chem. Chem. Phys.17, 31680 (2015).
46 A. H. Romero, P. L. Silvestrelli, and M. Parrinello,J. Chem. Phys.115, 115 (2001).
47 F. Bloch,Phys. Rev.70, 460 (1946).
48 E. M. Purcell, H. C. Torrey, and R. V. Pound,Phys. Rev.69, 37 (1946). 49 N. Bloembergen, E. M. Purcell, and R. V. Pound,Phys. Rev.73, 679
(1948).
50 C. Andreani, R. Senesi, F. Mallamace, M. Krzystyniak, L. Arcidiacono, STFC ISIS Neutron Muon Source, (2016), doi: 10.5286/ISIS.E.79114496.
51 G. Romanelli, M. Krzystyniak, R. Senesi, D. Raspino, J. Boxall, D. Pooley, S. Moorby, E. Schooneveld, N. J. Rhodes, C. Andreani, and F. Fernandez-Alonso,Meas. Sci. Technol.28, 095501 (2017).
52 G. Romanelli, G. Festa, M. Krzystyniak, C. Andreani, F. Fernandez-Alonso, and R. Senesi,J. Phys.-Conf. Ser.1055, 011001 (2018). 53 G. Romanelli, and M. Krzystyniak,Nucl. Instrum. Methods Phys. Res.
Sect. A819, 84 (2016).
54 C. Andreani, G. Romanelli, and R. Senesi,J. Phys. Chem. Lett. 7, 2216 (2016).
55 G. B. West,Phys. Rep.18, 263 (1975).
56 G. F. Reiter, J. Mayers, and J. Noreland,Phys. Rev. B65, 104305 (2002).
57 A. Pietropaolo, R. Senesi, C. Andreani, A. Botti, M. A. Ricci, and F. Bruni,Phys. Rev. Lett.100, 127802 (2008).
58 Y. Finkelstein, and R. Moreh,Chem. Phys.431-432, 58 (2014). 59 A. Parmentier, J. J. Shephard, G. Romanelli, R. Senesi, C. G.
Salz-mann, and C. Andreani,J. Phys. Chem. Lett.6, 2038 (2015). 60 F. Mallamace, C. Corsaro, M. Broccio, C. Branca, N.
Gonzalez-Segredo, J. Spooren, S. H. Chen, and H. E. Stanley,Proc. Natl. Acad. Sci. USA105, 12725 (2008).
61 N. Matubayasi, C. Wakai, and M. Nakahara,Phys. Rev. Lett.78, 2573 (1997).
62 B. G. Pfrommer, F. Mauri, and S. G. Louie,J. Am. Chem. Soc. 122, 123 (2000).
63 J. C. Hindman,J. Chem. Phys.44, 4582 (1966).
64 A. Abragram, The Principles of Nuclear Magnetism (Clarendon, Ox-ford, 1961).
65 D. M. Grant, Encyclopedia of Nuclear Magnetic Resonance (Wiley, Chichester, 1996). p. 1298.
66 K. Modig, and B. Halle,J. Am. Chem. Soc.124, 12031 (2002). 67 R. Ditchfield,J. Chem. Phys.65, 3123 (1976).
68 B. Cheng, J. Behler, and M. Ceriotti,J. Phys. Chem. Lett. 7, 2210 (2016).
69 K. Nyg˙ard, M. Hakala, T. Pylkk¨anen, S. Manninen, T. Buslaps, M. Itou, A. Andrejczuk, Y. Sakurai, M. Odelius, and K. H¨am¨al¨ainen,J. Chem. Phys.126, 154508 (2007).
70 C. A. Angell, J. Shuppert, and J. C. Tucker,J. Phys. Chem.77, 3092 (1973).
71 D. R. Kinney, I. S. Chuang, and G. E. Maciel,J. Am. Chem. Soc.115, 6786 (1993).
Andreani,J. Chem. Phys.139, 074504 (2013).
73 C. Pantalei, A. Pietropaolo, R. Senesi, S. Imberti, C. Andreani, J. May-ers, C. Burnham, and G. Reiter,Phys. Rev. Lett.100, 177801 (2008). 74 A. K. Soper, Water and ice structure in the range 220-365 K from
ra-diation total scattering experiments, in: Water: Fundamentals as the Basis for Understanding the Environment and Promoting Technology
(IOS Press, Amsterdam, 2015), pp. 151-172.
75 K. Amann-Winkel, M. C. Bellissent-Funel, L. E. Bove, T. Loerting, A. Nilsson, A. Paciaroni, D. Schlesinger, and L. Skinner,Chem. Rev.116, 7570 (2016).
76 A. Pietropaolo, R. Senesi, C. Andreani, and J. Mayers,Braz. J. Phys. 39, 318 (2009).
77 C. Andreani, G. Romanelli, and R. Senesi, Chem. Phys. 427, 106
(2013).
78 Y. Huang, X. Zhang, Z. Ma, W. Li, Y. Zhou, J. Zhou, W. Zheng, and C. Q. Sun,Sci. Rep.3, 3005 (2013).
79 N. Galamba,J. Phys.-Condens. Matter29, 015101 (2017). 80 E. B. Moore, and V. Molinero,J. Chem. Phys.130, 244505 (2009). 81 D. Majolino, F. Mallamace, P. Migliardo, F. Aliotta, N. Micali, and C.
Vasi,Phys. Rev. E47, 2669 (1993).
82 J. A. Sellberg, C. Huang, T. A. McQueen, N. D. Loh, H. Laksmono, D. Schlesinger, R. G. Sierra, D. Nordlund, C. Y. Hampton, D. Starodub, D. P. DePonte, M. Beye, C. Chen, A. V. Martin, A. Barty, K. T. Wikfeldt, T. M. Weiss, C. Caronna, J. Feldkamp, L. B. Skinner, M. M. Seibert, M. Messerschmidt, G. J. Williams, S. Boutet, L. G. M. Pettersson, M. J. Bogan, and A. Nilsson,Nature510, 381 (2014).

![Figure 2 shows the hydrogen chemical shift in liquid water, δ, as a function of the temperature from the critical region to the deep supercooled regime [61,63]](https://thumb-eu.123doks.com/thumbv2/123dokorg/7584825.112916/5.892.86.412.679.924/figure-hydrogen-chemical-liquid-function-temperature-critical-supercooled.webp)