energies
ReviewA Review of Dangerous Dust in Fusion Reactors:
from Its Creation to Its Resuspension in Case of
LOCA and LOVA
Andrea Malizia *, Luigi Antonio Poggi, Jean-François Ciparisse, Riccardo Rossi, Carlo Bellecci and Pasquale Gaudio
Department of Industrial Engineering, Associazione EUROFUSION-ENEA, University of Rome Tor Vergata, Via del Politecnico 1, 00133 Rome, Italy; [email protected] (L.A.P.); [email protected] (J.-F.C.); [email protected] (R.R.); [email protected] (C.B.); [email protected] (P.G.)
* Correspondence: [email protected]; Tel.: +39-06-7259-7202 Academic Editor: Matthew Hole
Received: 22 April 2016; Accepted: 27 June 2016; Published: 25 July 2016
Abstract:The choice of materials for the future nuclear fusion reactors is a crucial issue. In the fusion reactors, the combination of very high temperatures, high radiation levels, intense production of transmuting elements and high thermomechanical loads requires very high-performance materials. Erosion of PFCs (Plasma Facing Components) determines their lifetime and generates a source of impurities (i.e., in-vessel tritium and dust inventories), which cool down and dilute the plasma. The resuspension of dust could be a consequences of LOss of Coolant Accidents (LOCA) and LOss of Vacuum Accidents (LOVA) and it can be dangerous because of dust radioactivity, toxicity, and capable of causing an explosion. These characteristics can jeopardize the plant safety and pose a serious threat to the operators. The purpose of this work is to determine the experimental and numerical steeps to develop a numerical model to predict the dust resuspension consequences in case of accidents through a comparison between the experimental results taken from campaigns carried out with STARDUST-U and the numerical simulation developed with CFD codes. The authors in this work will analyze the candidate materials for the future nuclear plants and the consequences of the resuspension of its dust in case of accidents through the experience with STARDUST-U.
Keywords:nuclear fusion; security; dust
1. Introduction
“Fusion energy holds promise for obtaining the consent of the public, as it can provide intrinsic safety, favorable environmental characteristics and it can address global climate change concerns. In particular, fusion energy has the potential to become a CO2-free clean and inexhaustible energy source. In the world, all nuclear
power plants in operation are related to fission, which is based on the fractionation of large atomic nuclei, especially the very heavy elements uranium and plutonium. However, to release energy, an alternative approach is that of nuclear fusion. Unlike fission, nuclei of light atoms gather to create atoms of a more stable and heavy form” [1]. “Fusion is the process which powers the sun and other stars” [2]. “During the fusion of elements with low atomic numbers substantial amounts of energy are released. In the core of the sun, the huge gravitational pressure allows this to happen at temperatures of around 10 million degrees Celsius. Gas raised to these temperatures becomes a “plasma”, where the electrons are completely separated from the atomic nuclei (ions)” [2]. “The plasma is a globally neutral ionized gas, consisting of a set of electrons and positive ions. As such, the plasma is considered as the fourth state of matter, which therefore differs from the solid, the liquid and the gaseous.” “The most promising combination for power on Earth today is the fusion of a deuterium atom with a tritium one. The process, which requires temperatures of approximately 72 million degrees F (39 million degrees Celsius), produces 17.6 million electron volts of energy [3].”
Energies 2016, 9, 578 2 of 34
Nowadays the experimental nuclear facilities present worldwide are based on the deuterium-tritium technological concept. Deuterium and tritium are 2 isotopes of hydrogen, the first one can be obtained through an extraction process starting from the sea water, the second one can be obtained using lithium panel. Lithium is present in the sea rocks so it is clear that the combustible necessary to let this plant work is almost unlimited. The security levels of these plants are quite high because, in case of a malfunction, there are plasma material interaction that provokes an immediate reduction of temperature of the plasma causing its turn off. The products coming from chemical combustion are negligible as the radioactivity levels inside the facilities. Actually this is a promising alternative for the production of electricity with a reduced CO2and other gas emission, the main problem that
has to be faced is obtain a continuous production of electric energy. The International Thermonuclear Experimental Reactor (ITER, see Figure1) main goal is be the first nuclear fusion plant with a positive energetic efficiency.
Energies 2016, 9, 578
with a tritium one. The process, which requires temperatures of approximately 72 million degrees F (39 million degrees Celsius), produces 17.6 million electron volts of energy [3].”
Nowadays the experimental nuclear facilities present worldwide are based on the deuterium-tritium technological concept. Deuterium and deuterium-tritium are 2 isotopes of hydrogen, the first one can be obtained through an extraction process starting from the sea water, the second one can be obtained using lithium panel. Lithium is present in the sea rocks so it is clear that the combustible necessary to let this plant work is almost unlimited. The security levels of these plants are quite high because, in case of a malfunction, there are plasma material interaction that provokes an immediate reduction of temperature of the plasma causing its turn off. The products coming from chemical combustion are negligible as the radioactivity levels inside the facilities. Actually this is a promising alternative for the production of electricity with a reduced CO2 and other gas emission, the main problem that has to be faced is obtain a continuous production of electric energy. The International Thermonuclear Experimental Reactor (ITER, see Figure 1) main goal is be the first nuclear fusion plant with a positive energetic efficiency.
Figure 1. ITER scheme. This figure is taken from [4].
There are safety and security concerns related to several technological peculiarities of these plants, one of the most important is the creation of dust due to the plasma material interaction inside the vacuum vessel (VV) of the nuclear fusion plants [5–12] and its resuspension due to accidents like Loss of Vacuum (LOVA), Loss of Coolant (LOCA) [13,14].
Figure 1.ITER scheme. This figure is taken from [4].
There are safety and security concerns related to several technological peculiarities of these plants, one of the most important is the creation of dust due to the plasma material interaction inside the vacuum vessel (VV) of the nuclear fusion plants [5–12] and its resuspension due to accidents like Loss of Vacuum (LOVA), Loss of Coolant (LOCA) [13,14].
Energies 2016, 9, 578 3 of 34
2. Dust in Fusion Nuclear Reactors
“The combination of high temperatures, high radiation damage levels, intense production of transmuting elements (in particular, H and He) and high thermomechanical loads that produce significant primary and secondary stresses and time-dependent strains requires very high-performance materials for fusion energy systems” [15]. The materials that have direct interaction with the plasma must resist to load of energy till 14 MeV due to the neutrons. These neutrons can produce displacements and transmutation that can provokes material defects and gas atoms (like He or H). The plasma interaction temperatures are in the range of 780–3500 K causing several erosion phenomena. “The selection of plasma facing materials is mainly limited by their capability of absorbing heat and minimizing plasma contamination” [16–18].
2.1. Materials based on carbon
International Thermonuclear Experimental Reactor (ITER) and DEMO, the future nuclear fusion plants that will be build, will be characterized by PMIs (Plasma Material Interactions) but, actually, is it not possible estimate the exact numbers of these events [19–22].
Since few years ago graphite was used as PFC because of the following characteristics [18,23]:
(1) “A good compatibility with a wide variety of plasma operation conditions.”
(2) “A good thermo-mechanical properties of carbon fiber composites (CFC) and the lack of melting under transient power fluxes makes these materials compatible with high power flux plasmas.”
(3) “A high density plasmas in ITER-like regimes were obtained in the experiments with a relatively low core contamination (Zeff= 1.5–2.0).”
(4) “Due to its Low-Z, the core radiative losses associated with C in high temperature plasmas are low, while the divertor radiative losses by C, which are necessary to maintain semi-detached operation in ITER, can decrease the divertor power flux by more than a factor of „2 compared with fully attached conditions.“
The main negative aspect in using carbon material were [24–26]:
(1) High erosion trend.
(2) High tritium retention levels
During these year have been constructed database in order to analyze “yield data with respect to ion energy, target temperature and ion flux”.
“The database suggests a weak dependence of the erosion yield on ion impact energy between 10 and 200 eV and a clear tendency for the yield to decrease with increasing flux density [27], implying a „2.5-fold reduction in yield for the ITER strike-point conditions compared with previous assumptions („1%)”.
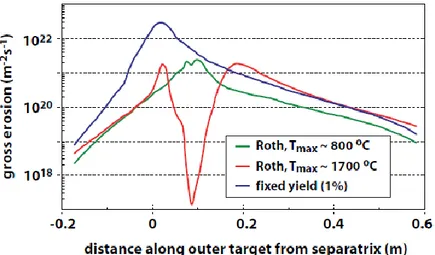
“Figure2taken from [18]” shows the variation of gross erosion expected in ITER versus the distance along outer target from separatrix.
“This figure illustrates the complex coupling of target erosion and power load and associated tritium retention which makes predictions to ITER uncertain. [18]
(a) The carbon chemical erosion yield depends strongly on the target temperature, which is determined by the incident plasma power flux.
(b) The power flux at the divertor is determined by the radiative losses and the degree of detachment, which is strongly influenced by the release of carbon into the divertor by chemical erosion. [18]”
The different projects and test actually leave uncertainties about the plasma conditions in ITER that are strongly related to the variation of event like Edge Localizated Modes (ELMs) or disruption that strongly contribute to sputtering and erosion phenomena’s. [18]
Energies 2016, 9, 578 4 of 34
Energies 2016, 9, 578
Figure 2. “Calculated chemical gross erosion of the outer ITER divertor target assuming a fixed erosion yield
of 1% or the full erosion dependence on energy, surface temperature and particle flux. Calculations are done for a high and a low surface temperature case”. This figure is taken from [18].
“This figure illustrates the complex coupling of target erosion and power load and associated tritium retention which makes predictions to ITER uncertain. [18]
(a) The carbon chemical erosion yield depends strongly on the target temperature, which is determined by the incident plasma power flux.
(b) The power flux at the divertor is determined by the radiative losses and the degree of detachment, which is strongly influenced by the release of carbon into the divertor by chemical erosion. [18]”
The different projects and test actually leave uncertainties about the plasma conditions in ITER that are strongly related to the variation of event like Edge Localizated Modes (ELMs) or disruption that strongly contribute to sputtering and erosion phenomena’s. [18]
For these reasons, actually, the Carbon is not considered as material for ITER.
2.2. Material Based on Beryllium
“Use of beryllium in fusion reactors has been considered for neutron multiplication in breeding blankets and as an oxygen getter for plasma-facing surfaces.” [28]
Beryllium has a strong cross session and a low atomic mass and this combination is ideal for its use in the neutron reflectors, placing this material as candidate for many blanket design [28].
The advantages in using Be as PFC are [18–28]: 1. Low Z material
2. Sputtering lower than carbon [27] 3. “Low radiative losses from the core plasma” [28] 4. Oxygen gathering
The experiment made at the Joint European Torus (JET) nuclear fusion plant, placed in Culham (UK), confirm the above mentioned characteristics [29,30].
The plasma material interaction of beryllium and plasma provokes the creation of beryllium oxides like BeO2 that, from one side, reduce the sputtering and from the other side enhance the H
retention [31] to levels comparable to those of carbon oxides [32,33]. The experiments made on PISCE-B facility demonstrate that the H retention depends also from other impurities [34–36].
One of the flaw of Be is its low melting temperature (1550 K) that in future plants, like ITER, can provoke extended damages of PFCs in case of PMIs [37].
Figure 2. “Calculated chemical gross erosion of the outer ITER divertor target assuming a fixed erosion yield of
1% or the full erosion dependence on energy, surface temperature and particle flux. Calculations are done for a high and a low surface temperature case”. This figure is taken from [18].
2.2. Material Based on Beryllium
“Use of beryllium in fusion reactors has been considered for neutron multiplication in breeding blankets and as an oxygen getter for plasma-facing surfaces.” [28]
Beryllium has a strong cross session and a low atomic mass and this combination is ideal for its use in the neutron reflectors, placing this material as candidate for many blanket design [28].
The advantages in using Be as PFC are [18–28]:
1. Low Z material
2. Sputtering lower than carbon [27]
3. “Low radiative losses from the core plasma” [28] 4. Oxygen gathering
The experiment made at the Joint European Torus (JET) nuclear fusion plant, placed in Culham (UK), confirm the above mentioned characteristics [29,30].
The plasma material interaction of beryllium and plasma provokes the creation of beryllium oxides like BeO2that, from one side, reduce the sputtering and from the other side enhance the H
retention [31] to levels comparable to those of carbon oxides [32,33]. The experiments made on PISCE-B facility demonstrate that the H retention depends also from other impurities [34–36].
One of the flaw of Be is its low melting temperature (1550 K) that in future plants, like ITER, can provoke extended damages of PFCs in case of PMIs [37].
“The dynamics and loss of the layers of molten Be during transients, which are subject to forces associated with plasma impact, Lorentz forces, etc., it is yet to be studied in detail. The experience with Be in JET was recently reviewed [38,39] with emphasis on the behavior and influence on the plasma of Be melting and molten Be-PFCs. In JET, a single large ELM depositing „1MJ in less than 1ms [39,40], led to substantial melting of the Be JET divertor target and terminated the high performance ELM-free phase of the discharge. However, the effects of Be melting on subsequent plasma operations were not catastrophic, due to the plasma’s high tolerance to the Low-Z Be. Therefore, the precise implications of significant Be first-wall melting on the lifetime of the wall in ITER, and on the performance of a burning plasma experiment like ITER, are still not clear and require further study.”
Another key safety issue is the toxicity of Be in case of inhalation, so it is necessary guarantee a continuous monitoring of air to prevent workers disease [28].
Energies 2016, 9, 578 5 of 34
2.3. Materials with High-Z
“The major focus of research on High-Z materials in fusion devices has been the achievement of low core plasma contamination, due to the low ‘fatal’ core concentrations (for ignition 10´3–10´4 for Mo and W, respectively) in burning plasma experiments. The core concentration of High-Z impurities is controlled by both the impurity physical sputtering source at PFCs and impurity transport. High-Z materials have been used for the majority of PFCs in several large fusion experiments recently and in the past: Frascati Tokamak Upgrade (FTU) with molybdenum toroidal limiters [41], Alcator C-Mod with a molybdenum first wall and divertor [41,42], TEXTOR with High-Z components as limiters [43] and ASDEX-Upgrade both at the divertor [44] and main chamber [45].“
“In general, High-Z core concentrations decrease with increasing density [43,46,47], as expected from the reduction of physical sputtering with edge temperature, and are lower (by factors of 2.5–10) in the divertor than in limiter geometries [47–50].”
There are several studies [51–58] that have investigated the possibility to use tungsten and its alloys for the divertor and the first wall. EFDA has runned also a program (W&WALLOYS) to analyze these applications for W [49,50,59,60].
DEMO, as ITER, will have the classic torus shape with the 85% of the inner surface that has to be covered with blanked boxes to convert the power coming from fusion reactors provoking the transmutation of Li in tritium [49].
Under normal condition an heat load of 2 MW/m2can be reasonably expected so a potential structural material can be the ferritic–martensitic 9% Cr steels with a protection layer based on W as armor material.
“Furthermore, the divertor is the highest thermally loaded components of a fusion power plant. About 15% of the total fusion power has to be removed by divertor while peak loads of 10–20 MW/m2 have to be considered. Like the protection layer of the first wall, the plasma facing divertor parts are intended to be made of tungsten or tungsten alloys. In helium cooled divertor designs tungsten materials are also considered for structural use (e.g., as pressurized pipes or thimbles) [49,50]. Since the requirements for both applications (armor or structure) are quite different, in this paper we distinguish between armor and structural materials which in both cases could be made of tungsten. In addition, all plasma facing components are exposed to fast neutrons. That means that the consequent damage, wear, and aging can reduce the durability of some divertor components significantly.”
The anisotropic microstructure of W allow its use for fabrication of pipes and plates [61]. “So far, only rhenium is known to improve the ductility of tungsten by solid solution but its use for fusion energy applications has been ruled out for reasons of cost and irradiation embrittlement.
Iridium too is sometimes mentioned in literature as having a similar effect [62], though it is even more expensive. This leaves only tantalum, vanadium, molybdenum, and titanium which also form solid solution with tungsten (Cr is excluded from this list since W–Cr alloys are known for their brittleness). Round blanks of W–1%Ta, W–5%Ta, W–5%V, W–25%Mo, and W–50%Mo have been produced by PLANSEE (sintered in hydrogen atmosphere and forged to a deformation degree of 80%). Charpy tests in the temperature range of 400–1100˝C (in vacuum) have shown that compared to pure tungsten the Ductile-Brittle Transition Temperature
(DBTT) of all alloys is higher, i.e., they are more brittle. Therefore, it is assumed that tungsten cannot be ductilised by solid solution, except with rhenium (or maybe iridium). As a last option, however, the effect of titanium has still to be investigated. [49,50]”
Experiments to test thermal shock and fatigues have been performed in Jülich and Garching [63–65] varying the power flux from 0.19 and 1.13 GW/m2and the temperature from 25˝C to 400˝C with
a load of pulsed from 100–1000 per 1 ms concluding that “the most promising material so far is W–1 vol.%Y2O3showing as yet no crack formation, while pronounced cracking is observed in W–5 vol.%Y2O3and
W–5 wt.%Ta materials under similar loadings [49,50]”
The loss of coolant accidents can provokes temperatures (in vessel) till 1200˝C that can oxide W
causing a radioactive W oxides release [66].
“The linear oxidation rate of tungsten at 1000˝C is about 1.4 ˆ 10´2mg¨cm´2¨s´1[67], which in the
Energies 2016, 9, 578 6 of 34
hour. A way of avoiding this problem is the addition to tungsten of oxide-forming alloying elements leading to the growth of a self-passivating layer at high temperature in the presence of oxygen. During normal operation, the surface of this material will consist of pure tungsten, owing to preferential sputtering of the alloying elements. In previous studies the good performance of the system W-Cr-Si manufactured via magnetron sputtering could be demonstrated [68]. Thin films of such alloys showed a strongly reduced oxidation rate compared to pure tungsten. However, the formation of brittle tungsten silicide may be disadvantageous for the powder metallurgical production of bulk W-Cr-Si alloys if a good workability is needed [49,50].”
Several oxidation tests have been made with different W-based alloys at a temperature of 1073 K for 3 hours (see Table1taken from [69]). Table1shows good results for Tungsten- Chromium- Titanium alloys. The amour of first wall needs a certain thickness (in the order of millimeters) using the above mentioned combinations (W-Cr-Si and W-Cr-Ti) obtaining a quasi-dense material [49,50,70,71].
Table 1.Composition and results of the screening oxidation tests with different tungsten-based alloys at 1073 K for 3 h. [69].
Alloy (wt.%) Oxidation Test Results
W-Cr14-Ti2 Slow oxidation
W-Cr18-Ti2 Slow oxidation
W-Cr16-Zr9 Film delamination
W-Hf17-Ta15 Film delamination
W-Hf32-Ti2 Film delamination
W-Ta12-Ti2 Film delamination
W-Ta12-Zr5 Fast oxidation
W-Zr2-Ti1 Film delamination
W-Y7-Cr3 Relatively slow oxidation
W-Y24-Cr2 Film delamination
Table2shows the main characteristics of two alloys (W-Cr10-Si10and W-Cr12-Ti2.5) [71–73].
Table 2.Characteristics of two W based alloys [49].
Material Oxidation behavior Thermal Conductivity DBTT
W-Cr10-Si10
Lower at 600˝C Higher at 1000˝C
In comparison with thin films that have the same composition
16 W/m K at 500˝C 1000–1050˝C
W-Cr12-Ti2.5
Same at 600˝C Higher at 800 & 1000˝C
In comparison with thin films that have the same composition
50 W/m K at 500–600˝C 900˝C
“So far, thin tungsten plates show the best ductility, as long as specific fabrication or machine rules are followed: (1) stress concentrators have to be avoided and (2) the anisotropic microstructure has to be aligned to the contour of the according part. Joining of tungsten materials is possible, but design routes, cost and low-activation criteria probably have to be redefined for brazing materials. A complete picture of the irradiation performance of tungsten materials is not yet available. But for further, more specific designs at least, basic irradiation damage data have to be produced. This, together with the aforementioned issues, should be at the top of the priority list of fusion material programs in general” [49].
2.4. Austenitic and Ferritic/Martensitic Steels and Other Advanced Materials
“It is impressive how the world of nuclear fusion research and the world of nuclear fission research have been in touch during these last decades exchanging ideas, new research achievements and resources.” One of the scientific discipline that has deeply strongly tapped this dual-use approach is the material science (see Figure3).
Energies 2016, 9, 578 7 of 34
Energies 2016, 9, 578
irradiation damage data have to be produced. This, together with the aforementioned issues, should be at the top of the priority list of fusion material programs in general” [49].
2.4. Austenitic and Ferritic/Martensitic Steels and Other Advanced Materials
“It is impressive how the world of nuclear fusion research and the world of nuclear fission research have been in touch during these last decades exchanging ideas, new research achievements and resources.” One of
the scientific discipline that has deeply strongly tapped this dual-use approach is the material science (see Figure 3).
One of the main fusion nuclear reactor difference if compared with the nuclear fission reactors is the high production of He and H that “require special mitigation techniques to minimize cavity swelling
and embrittlement. At low temperatures, defect cluster accumulation in the matrix can produce high hardening with accompanying embrittlement and the localized deformation phenomenon is known as dislocation channeling may create high stress concentrations at grain boundaries. At high temperatures, formation of helium cavities at grain boundaries can lead to severe inter granular embrittlement. Therefore, the matrix regions and grain boundaries must be designed to mitigate the severe neutron radiation effects. Finally, the unique requirement to restrict alloying compositions to so-called “reduced activation” elements in order for fusion to achieve its environmental “low-impact” potential produces considerable constraint on the number of options for development of improved materials” [5].
These challenges are faced by the production of advanced material with unique performances [74–78], these material include ferritic/martensitic steels, V–Cr–Ti alloys and SiC/SiC ceramic composites.
“There is an overlap between the temperatures of fusion, fission and spallation facilities as showed in Figure 2” taken from [78].
Figure 3. Overlap in temperatures for fusion, fission and spallation facilities. This figure is taken from [18].
“In Table 3 is it possible read also the main operating parameters of these three types of plants [78].”
Figure 3.Overlap in temperatures for fusion, fission and spallation facilities. This figure is taken from [18].
One of the main fusion nuclear reactor difference if compared with the nuclear fission reactors is the high production of He and H that “require special mitigation techniques to minimize cavity swelling and embrittlement. At low temperatures, defect cluster accumulation in the matrix can produce high hardening with accompanying embrittlement and the localized deformation phenomenon is known as dislocation channeling may create high stress concentrations at grain boundaries. At high temperatures, formation of helium cavities at grain boundaries can lead to severe inter granular embrittlement. Therefore, the matrix regions and grain boundaries must be designed to mitigate the severe neutron radiation effects. Finally, the unique requirement to restrict alloying compositions to so-called “reduced activation” elements in order for fusion to achieve its environmental “low-impact” potential produces considerable constraint on the number of options for development of improved
materials” [5].
These challenges are faced by the production of advanced material with unique performances [74–78], these material include ferritic/martensitic steels, V–Cr–Ti alloys and SiC/SiC ceramic composites.
“There is an overlap between the temperatures of fusion, fission and spallation facilities as showed in Figure2” taken from [78].
“In Table3is it possible read also the main operating parameters of these three types of plants [78].”
Table 3.Summary of operating parameters for fusion, fission and spallation facilities. This table is taken from [78].
Parameter Fusion Fission (Generation IV) Spallation
Working fluid H2O, He, Li, PbLi, FLiBe H2O (SC), He, Na, Pb, PbBi Hg, PbBi, H2O
Energy <14,1 MeV <1–2 MeV (most n) ď1 GeV (p and n)
He/dpa * 10 0,1–50 50–100
Stresses Moderate, slow varying ** Moderate, slow varying High pulsed
* dpa: displacement per atom. ** For normal operation. In a plasma disruption the stresses to the structure are to “high transient”. High, for both fusion and spallation, indicates stresses levels that are near the allowable maximum fraction of yield stresses under applicable engineering design rules.
“We can divide the materials into two main groups: steels (austenitic and ferritic/martensitic) and other advanced materials. Although there are very significant differences in the fusion, fission and spallation environments, there is a range of performance-limiting phenomena arising from radiation effects that are common to all nuclear environments. However, to illustrate the similarities in challenges, the operating requirements for two of the principal structural materials used in component design, austenitic stainless steels and ferritic/martensitic stainless steels, are summarized in Tables4and5taken from [78] and Table1in [79] shows a list of commercial and research steels [79–81].“
Energies 2016, 9, 578 8 of 34
Table 4.Austenitic stainless steels: spallation, fusion, and Generation IV fission applications. Asterisks indicate conditions set for removal of first target. Later targets may be subjected to higher doses and transmutation levels with experience gained in conditions specific to SNS. This table is taken from [78].
System
(Working Fluid) Component T˝C
Max dose, dpa
Maximum He,
ppm Candidate Alloys
SNSa(mercury) Spallation target module 80–150 5 200 316LN
ITER (water) First wall/Blanket 100–300 3 75 316LN
SCWRb Fuel assembly 280–620 15 200 Advanced low swelling
steels: D9, PN316, HT-UPS
SCc(water) Core support/internals 280–500 0,1–20 250
aSpallation Neutron Source is one-of-a-kind research facility that provides the most intense pulsed neutron beams
in the world for scientific research and industrial development.bSupercritical Water Reactor.cSipercritical.
Table 5. Ferritic/martensitic steels: fusion, and Generation IV fission applications. This table is taken from [77].
System
(Working Fluid) Component T
˝C Max dose,
dpa
Maximum He,
ppm Candidate Alloys
SSTRa(water) First wall/blanket 300–550 100 >1000
Low activation 8%–9%Cr ferritic-martensitic steels
HCLLb(He) First wall/blanket 270–550 100 >1000
HPBCc(He) First wall/blanket 300–550 100 >1000
SCWR (SC water) Fuel assembly 280–620 15 20 Advanced 8%–12%
ferritic-martensitic steels
Core support/internals 280–500 0,1–20 20
FRd(Pb-Bi, Pb) Fuel assembly 300–550 150 15
aSolid State Track Recorders.bHelium-Cooled Lithium–Lead.cHelium Cooled Pebble Bed.dFast Reactor. Actually the use of stainless steel has not been planned for nuclear plants like ITER because of its low thermal conductivity and He embrittlement. The worldwide research for DEMO is actually focused on 8–9 Chrome ferritic/martensitic steels [82–86].
“Several high-priority near-term potential research activities to address fusion nuclear science challenges are summarized”. General recommendations are reported in [87].
The operating temperature strongly influence the microstructural features [88–90] and the PMIs include several phenomena over different range of time and length scale reported in Figure 4
taken from [87].
Energies 2016, 9, 578
Figure 4. Overview of the coupled multi-scale phenomenon associated with plasma-materials
interactions. This figure is taken from [87].
“Regarding the materials for material structures, the overarching challenge is to maintain mechanical and structural integrity by designing highly efficient radiation self-healing nanostructures that are resistant to unprecedented levels of displacement damage and nuclear transmutation products. Atomic displacement damage in a DEMO reactor corresponds to ejecting every atom from its lattice site more than 50–150 times. The conversion of fusion power to practical electricity and the creation of fusion fuel in the blanket, tritium systems, and balance of plant regions is a complex topic involving multiple scientific phenomena. Between the PFCs, the tritium fueling, purification and recycle components and the heat exchangers, the tritium concentration and neutron flux will vary by over 10 orders of magnitude and the temperature and magnetic field will vary by several orders of magnitude, and span different regimes of physics and chemistry predominance [91]. A broad and fundamental science-based approach is needed to meet this challenge. In order to appropriately position the technological maturity of PFCs, materials, blanket, and tritium technology for potential next step devices following ITER, it is imperative to initiate or enhance modest research activities on fusion nuclear technology. Numerous opportunities for high-impact fusion research may be achievable by making modifications to existing facilities and/or moderate investment in new medium-scale facilities [87].“
In conclusion, it is possible to affirm that several research programs have been developed and are in progress to find the proper solutions to choose the right materials for the future nuclear plants like ITER or DEMO, you can read also [92–135] to go into the details of the most important research in progress. Another important conclusion is that the research programs for the materials that are used in nuclear fission plants can be a source of ideas and information for nuclear fusion research framework.
3. Materials and methods
The previous sections put in evidence that the material selection from future nuclear plans (like ITER or DEMO) is one of the most important scientific challenge to let the nuclear fusion be a real
Figure 4. Overview of the coupled multi-scale phenomenon associated with plasma-materials
Energies 2016, 9, 578 9 of 34
“Regarding the materials for material structures, the overarching challenge is to maintain mechanical and structural integrity by designing highly efficient radiation self-healing nanostructures that are resistant to unprecedented levels of displacement damage and nuclear transmutation products. Atomic displacement damage in a DEMO reactor corresponds to ejecting every atom from its lattice site more than 50–150 times. The conversion of fusion power to practical electricity and the creation of fusion fuel in the blanket, tritium systems, and balance of plant regions is a complex topic involving multiple scientific phenomena. Between the PFCs, the tritium fueling, purification and recycle components and the heat exchangers, the tritium concentration and neutron flux will vary by over 10 orders of magnitude and the temperature and magnetic field will vary by several orders of magnitude, and span different regimes of physics and chemistry predominance [91]. A broad and fundamental science-based approach is needed to meet this challenge. In order to appropriately position the technological maturity of PFCs, materials, blanket, and tritium technology for potential next step devices following ITER, it is imperative to initiate or enhance modest research activities on fusion nuclear technology. Numerous opportunities for high-impact fusion research may be achievable by making modifications to existing facilities and/or moderate investment in new medium-scale facilities [87].“
In conclusion, it is possible to affirm that several research programs have been developed and are in progress to find the proper solutions to choose the right materials for the future nuclear plants like ITER or DEMO, you can read also [92–135] to go into the details of the most important research in progress. Another important conclusion is that the research programs for the materials that are used in nuclear fission plants can be a source of ideas and information for nuclear fusion research framework.
3. Materials and Methods
The previous sections put in evidence that the material selection from future nuclear plans (like ITER or DEMO) is one of the most important scientific challenge to let the nuclear fusion be a real alternative for energy production. Another key point is that the PMIs are inevitable so as the formation of dust, flakes and composites from PFCs due to PMIs. Accidents provoking vacuum failures and coolant dispersions (LOVA or LOCA) can jeopardize the functionality of the nuclear plants provoking dust re-suspension inside the vacuum vessel, this re-suspension can damage the plants causing explosions and can be dangerous for the health of operators because of its toxicity, radioactivity and capability to chemical react. In order to face these security and safety problems the Quantum Electronic and Plasma Physics (QEP) Research Group of University of Rome Tor Vergata in collaboration with ENEA Fusion Technology of Frascati (Italy) has developed a facility, STARDUST, in order to reproduce experimental conditions comparable to those expected in ITER in case of LOVA or LOCA in order to get a mathematical model to predict dust re-suspension. STARTDUST facility showed limits and it has been upgraded, the new facility is STARDUST-U. The dimension of dust created inside the tokamaks that are used worldwide is in the range 0,1–1000 µm and the most dangerous for the respiratory system are the one in the range 0,1–1 µm that can be withheld from the lungs. These particle dimensions, in the pressurization regime used inside STARDUST and STARDUST-U, has a behaviour comparable to those of the air streamlines and this is way in this work we will analyse the thermodynamic behaviour both from an experimental and numerical point of view [136–149].
STARDUST-U (Acronyms for Small Tank for Aerosol Removal and DUST-Upgrade) is an experimental facility build in 2014 by the QEP research group in order to get experimental data necessary to run numerical simulations and validate the mathematical models necessary to predict dust resuspension. It has been obtained through a structural and mechanical upgrade of STARDUST facility. It has been build up to reproduce thermos-fluid dynamic conditions comparable to those expected in a fusion reactor vessel during vacuum failures [136–149]. The vacuum failures are replicated through the inlet of pressurized air by different ports of the facility (C-D-E-F, see Figure5).
Energies 2016, 9, 578 10 of 34
Energies 2016, 9, 578
alternative for energy production. Another key point is that the PMIs are inevitable so as the formation of dust, flakes and composites from PFCs due to PMIs. Accidents provoking vacuum failures and coolant dispersions (LOVA or LOCA) can jeopardize the functionality of the nuclear plants provoking dust re-suspension inside the vacuum vessel, this re-suspension can damage the plants causing explosions and can be dangerous for the health of operators because of its toxicity, radioactivity and capability to chemical react. In order to face these security and safety problems the Quantum Electronic and Plasma Physics (QEP) Research Group of University of Rome Tor Vergata in collaboration with ENEA Fusion Technology of Frascati (Italy) has developed a facility, STARDUST, in order to reproduce experimental conditions comparable to those expected in ITER in case of LOVA or LOCA in order to get a mathematical model to predict dust re-suspension. STARTDUST facility showed limits and it has been upgraded, the new facility is STARDUST-U. The dimension of dust created inside the tokamaks that are used worldwide is in the range 0,1–1000 m and the most dangerous for the respiratory system are the one in the range 0,1–1 m that can be withheld from the lungs. These particle dimensions, in the pressurization regime used inside STARDUST and STARDUST-U, has a behaviour comparable to those of the air streamlines and this is way in this work we will analyse the thermodynamic behaviour both from an experimental and numerical point of view [136–149].
STARDUST-U (Acronyms for Small Tank for Aerosol Removal and DUST-Upgrade) is an experimental facility build in 2014 by the QEP research group in order to get experimental data necessary to run numerical simulations and validate the mathematical models necessary to predict dust resuspension. It has been obtained through a structural and mechanical upgrade of STARDUST facility. It has been build up to reproduce thermos-fluid dynamic conditions comparable to those expected in a fusion reactor vessel during vacuum failures [136–149]. The vacuum failures are replicated through the inlet of pressurized air by different ports of the facility (C-D-E-F, see Figure 5).
Figure 5. STARDUST-Upgrade facility rendering, showing ports C, E and F used in the present campaign. The data collected inside STARDUST-U are:
static pressure inside the chamber (Pa),
average temperature of the chamber (K),
air volume flow-rate in liters per minute (L/min),
differential pressure from transducers in selected locations (Pa), local air velocity (m/s) and corresponding Mach Number (Ma).
All this data is collected by a National Instruments cards system able to store (with a frequency of 50 Hz) the information coming from the hardware placed on the facility.
Figure 5.STARDUST-Upgrade facility rendering, showing ports C, E and F used in the present campaign.
The data collected inside STARDUST-U are: ‚ static pressure inside the chamber (Pa), ‚ average temperature of the chamber (K),
‚ air volume flow-rate in liters per minute (L/min),
‚ differential pressure from transducers in selected locations (Pa), local air velocity (m/s) and corresponding Mach Number (Ma).
All this data is collected by a National Instruments cards system able to store (with a frequency of 50 Hz) the information coming from the hardware placed on the facility.
Static pressure was measured with a Pressure gauges (Alcatel AP 1004 Pirani Gauge, Alcatel Vacuum Technology, Annecy, France [135]), temperature with three J-thermocouples, flow rate with MKS flow meter (1559A Mass-Flo Controller, MKS Instruments, Andover, Ma, USA [135]) that covers the range from 20 to 200 standard L/min, differential pressure from Kulite piezo resistive transducers (XCE-093-2D High Temperature Miniature Pressure Transducers [135]). Voltage signal from transducers was converted into differential pressure (Pa) according to transducers sensitivity and allowed to calculate local air velocity and Ma in the locations where the transducers have been placed for each replication.
In order to replicate the vacuum failure accidental event expected, an integrated LabVIEW control system was developed to correctly set up the border conditions, and to control and acquire the thermofluid-dynamic variables throughout the experiment. Standard Procedures of a typical run are summarized in Figure6.
In the experimental campaign presented in this paper, LOVAs have been reproduced as air intake from three different inlet ports (ports C, E, F; Figure6), corresponding to upper, mid-plane, and lower part of the facility. Two different air flow-rates have been used (27 and 40 L/min), allowing to reproduce two different pressurization rates. A vacuum pump connected with the chamber allowed to set to 300 Pa the initial vacuum level for each replication (only for port C the experiments have been conducted also starting from 2000 Pa). Data acquisition was triggered by the on/off electro valve opening that allowed the air to enter the chamber from the selected port replicating the breach of a vacuum failure. Three replications have been performed for each experiment. Diagnostics data regarding internal static pressure, average temperature and air volume flow rate will be shown for one of the three set-ups, i.e., port C, while the two others, having the same trend, have been omitted. For the three experimental set-ups (i.e., upper, mid-plane and lower vacuum failures respectively from ports C, E, F), transducers positions inside the chamber will be shown, along with corresponding air velocity and Ma trends over time. Experimental results (presented with error tube calculated according to error analysis presented below) are compared with numerical results from simulations performed with ANSYS CFX 16.0 using SST k-ω turbulence model with γ-ϑ transitional model.
Energies 2016, 9, 578 11 of 34
Energies 2016, 9, 578
Static pressure was measured with a Pressure gauges (Alcatel AP 1004 Pirani Gauge, Alcatel Vacuum Technology, Annecy, France [135]), temperature with three J-thermocouples, flow rate with MKS flow meter (1559A Mass-Flo Controller, MKS Instruments, Andover, Ma, USA [135]) that covers the range from 20 to 200 standard L/min, differential pressure from Kulite piezo resistive transducers (XCE-093-2D High Temperature Miniature Pressure Transducers [135]). Voltage signal from transducers was converted into differential pressure (Pa) according to transducers sensitivity and allowed to calculate local air velocity and Ma in the locations where the transducers have been placed for each replication.
In order to replicate the vacuum failure accidental event expected, an integrated LabVIEW control system was developed to correctly set up the border conditions, and to control and acquire the thermofluid-dynamic variables throughout the experiment. Standard Procedures of a typical run are summarized in Figure 6.
Figure 6. STARDUST-Upgrade facility standard procedures flowchart.
In the experimental campaign presented in this paper, LOVAs have been reproduced as air intake from three different inlet ports (ports C, E, F; Figure 6), corresponding to upper, mid-plane,
Figure 6.STARDUST-Upgrade facility standard procedures flowchart.
Acquisition system for each replication provides a data files where the following quantities are listed: observation no., actual internal static pressure (Pa), j-thermocouples temperatures (˝C),
air volume flow rate (L/min), differential pressure voltage signal from transducers (mV).
The replications were elaborated to calculate the average local air velocity and Ma average for each experiment using a script developed with Matlab.
According to the First Law of Thermodynamics for an open system, assuming steady state operations, altitude term negligible, isentropic process (no heat transfer), no work done, and considering compressible air as a perfect gas, its local velocity and Ma can be determined as in the Equation (1):
v “ g f f e 2k k ´ 1 RT M « ˆ P∆ PS `1 ˙k´1k ´1 ff , (1) where:
- k “ cp{cvRatio of the fluid specific heat at constant pressure cpto the fluid specific heat at constant volume
cv(it is approximately equal to 1.4 for air at standard condition);
- R “ 8.314 JK´1mol´1Universal gas constant;
- M “ 0.028968 kg{mol Dry air molecular mass at standard conditions. - T “ N1 řN
i“1TiMean temperature in the transducer’s positions from i thermocouples (K);
- PS(Pa) Static pressure (measured by Pirani pressure gauge);
- P∆“PT´PS(Pa) Differential pressure (measured by pressure transducers as difference between its head
pressure and its reference tube pressure);
Energies 2016, 9, 578 12 of 34
“However, experimental measurements are affected by direct errors and propagation of uncertainty in case of indirect measurements, like in this case velocity and Ma. If the three uncertainties∆x1,∆x2,∆x3on the
variables of the velocity function v “ f px1, x2, x3qare not likely of the same sign, and if variables correlations
are neglected, and if this applies also to the Ma function Ma “ g py1, y2q, it is possible to use the following
Equations 2 and 3 [135–145] respectively for total uncertainty∆v of velocity and ∆Ma of Ma.“ ∆v “ d „ˆ Bf Bx1 ˙ ∆x1 2 ` „ˆ Bf Bx2 ˙ ∆x2 2 ` „ˆ Bf Bx3 ˙ ∆x3 2 , and (2) ∆Ma “ d „ˆ Bg By1 ˙ ∆y1 2 ` „ˆ Bg By2 ˙ ∆y2 2 , (3)
where x1“T (mean temperature from J-thermocouples), x2“PS(static pressure from Pirani pressure gauge),
x3“P∆(differential pressure from Kulite pressure transducers), y1“x1, y2“v (local air velocity).
Bf Bx1 “ 1 2T g f f e 2k k ´ 1 RT M « ˆ P∆ PS `1 ˙k´1k ´1 ff ; (4) Bf Bx2 “ P∆RT´P∆ PS `1 ¯´1k MP2S g f f e 2k k´1RTM « ´ P∆ PS `1 ¯k´1k ´1 ff; (5) Bf Bx3 “ RT ´ P∆ PS `1 ¯´k1 MPS g f f e 2k k´1RTM « ´ P∆ PS `1 ¯k´1k ´1 ff; (6) Bg By1 “ ´ v 2T1.5akR{M; (7) Bg By2 “ b 1 kRT{M . (8)
Uncertainties ∆x1, ∆x2, ∆x3, ∆y1, ∆y2 (direct errors) on the corresponding variables are [23]:
∆x1 “ 0.0031∆T ptq, ∆x2“0.1∆PSptq (Pirani pressure range: from 0.0005 to 1000 mbar),∆x3“0.1∆P∆ptq,
∆y1 “ ∆x1, ∆y2 “ ∆v, where T ptq, PSptq and P∆ptq are functions of time, acquired throughout the
experiments.” [134–149].
4. Results and Discussion
4.1. Experimental Campaign
The experimental set-up (see Section4) allow to reproduce different LOVA and LOCA accidents by flowing compressed air inside the experimental facility (STARDUST-U) in order to get the data that allow a thermo-fluid dynamics analysis of those accidents inside the facility.
The values measured and collected are:
‚ Flow rate measures (through the flow meters) ‚ Pressure rates (through pressure gauges) ‚ Temperatures rates (through thermocouples)
Energies 2016, 9, 578 13 of 34
These values are collected and stored with a frequency of 50 Hz and have a dual function: give the proper boundary conditions to run the simulation and be used as comparison data to validate the output of the simulation that means validate the mathematical model to predict the consequences of a LOVA or LOCA accidents on dust resuspension.
The experimental campaign discussion will be divided into two sub-section:
‚ Experimental results get reproducing the LOCA accident through an air injection from valve C and D ‚ Experimental results get reproducing the LOVA accident through an air injection from valve E and F The boundary conditions used to experimentally reproduce the accidents (from Valve C, D, E, F) are: ‚ Initial pressure of the compressed air that has to be flowed in the facility: 2,8 bar
‚ Initial pressure inside the chamber: 200 Pa ‚ Final pressure inside the chamber: 95000 Pa ‚ Environmental temperature: 25˝C
‚ Three different inlet air flow rates:
1. 8 L/min (to reproduce a pressurization rate of 100 Pa/s inside STARDUST-U)
2. 27 L/min (to reproduce a pressurization rate of 300 Pa/s inside STARDUST-U as suggested by the GSSR)
3. 40 L/min (to reproduce a pressurization rate of 500 Pa/s inside STARDUST-U)
For each combination, three replications were made. The results showed the average of the three replication.
4.2. Experiments from Valve C and D (LOCA Accidents Reproduction)
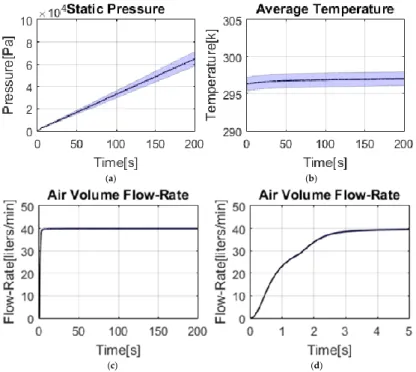
Figures7–9shown the variations of internal pressure, temperature and flow rate during the accident replication (with the calculated error bar).
Energies 2016, 9, 578
2. 27 L/min (to reproduce a pressurization rate of 300 Pa/s inside STARDUST-U as suggested by the GSSR)
3. 40 L/min (to reproduce a pressurization rate of 500 Pa/s inside STARDUST-U) For each combination, three replications were made. The results showed the average of the three replication.
4.2. Experiments from Valve C and D (LOCA accidents reproduction)
Figures 7–9 shown the variations of internal pressure, temperature and flow rate during the accident replication (with the calculated error bar).
(a) (b)
(c) (d)
Figure 7. (a) Description of the pressure increase inside STARDUST-U during the air flow inlet at 8
L/min. (b) Description of the temperature variations measured during the experiment. (c) Description of the flow rate variation in the time. (d) Flow rate increase in the early stage from the accident experimental simulation.
Figure 7. (a) Description of the pressure increase inside STARDUST-U during the air flow inlet at
8 L/min. (b) Description of the temperature variations measured during the experiment. (c) Description of the flow rate variation in the time. (d) Flow rate increase in the early stage from the accident experimental simulation.
Energies 2016, 9, 578 14 of 34
Energies 2016, 9, 578
(a) (b)
(c) (d)
Figure 8. (a) Description of the pressure increase inside STARDUST-U during the air flow inlet at 27
L/min. (b) Description of the temperature variations measured during the experiment. (c) Description of the flow rate variation in the time. (d) Flow rate increase in the early stage from the accident experimental simulation.
(a) (b)
Figure 8. (a) Description of the pressure increase inside STARDUST-U during the air flow inlet
at 27 L/min. (b) Description of the temperature variations measured during the experiment. (c) Description of the flow rate variation in the time. (d) Flow rate increase in the early stage from the accident experimental simulation.
Energies 2016, 9, 578
(a) (b)
(c) (d)
Figure 8. (a) Description of the pressure increase inside STARDUST-U during the air flow inlet at 27
L/min. (b) Description of the temperature variations measured during the experiment. (c) Description of the flow rate variation in the time. (d) Flow rate increase in the early stage from the accident experimental simulation.
(a) (b)
Energies 2016, 9, 578
(c) (d)
Figure 9. (a) Description of the pressure increase inside STARDUST-U during the air flow inlet at 40 L/min.
(b) Description of the temperature variations measured during the experiment. (c) Description of the flow rate variation in the time. (d) Flow rate increase in the early stage from the accident experimental simulation.
The results of pressure variations, flow rate variations and temperature variation obtained for vale D are comparable to those obtained for valve C.
For the three different conditions (8 L/min, 27 L/min and 40 L/min) the first diagram shows the internal pressure trend of the chamber from the initial pressure of 200 Pa to atmospheric pressure. The blue line is the value detected by the measuring instruments (Edward or Pirani). The red line represents the minimum error value, while the green line is the maximum error value. The internal pressure has a linear trend and reaches the fixed boundary conditions in about 1200 s for flow rate of 8 L/min, 400 s for flow rate of 27 L/min and 250 for flow rate of 40 L/min. It is very interesting see how the slop of the pressure diagram increase with the increasing of the flow rate from 8 L/min to 27 L/min with a percentage of almost 100% and from 27 L/min to 40 L/min with a percentage of almost 60%. It means that it is not possible to go over the 1000 Pa/s as accident simulation with this facility because the maximum flow rate achievable is 100 L/min. (see Figure 10).
Figure 10. Comparison of the three pressure diagrams, 8 L/min (blue diagram), at 27 L/min (red
diagram) and 40 L/min (red diagram).
Figure 9. (a) Description of the pressure increase inside STARDUST-U during the air flow inlet
at 40 L/min. (b) Description of the temperature variations measured during the experiment. (c) Description of the flow rate variation in the time. (d) Flow rate increase in the early stage from the accident experimental simulation.
Energies 2016, 9, 578 15 of 34
The results of pressure variations, flow rate variations and temperature variation obtained for vale D are comparable to those obtained for valve C.
For the three different conditions (8 L/min, 27 L/min and 40 L/min) the first diagram shows the internal pressure trend of the chamber from the initial pressure of 200 Pa to atmospheric pressure. The blue line is the value detected by the measuring instruments (Edward or Pirani). The red line represents the minimum error value, while the green line is the maximum error value. The internal pressure has a linear trend and reaches the fixed boundary conditions in about 1200 s for flow rate of 8 L/min, 400 s for flow rate of 27 L/min and 250 for flow rate of 40 L/min. It is very interesting see how the slop of the pressure diagram increase with the increasing of the flow rate from 8 L/min to 27 L/min with a percentage of almost 100% and from 27 L/min to 40 L/min with a percentage of almost 60%. It means that it is not possible to go over the 1000 Pa/s as accident simulation with this facility because the maximum flow rate achievable is 100 L/min. (see Figure10).
Energies 2016, 9, 578
(c) (d)
Figure 9. (a) Description of the pressure increase inside STARDUST-U during the air flow inlet at 40 L/min.
(b) Description of the temperature variations measured during the experiment. (c) Description of the flow rate variation in the time. (d) Flow rate increase in the early stage from the accident experimental simulation.
The results of pressure variations, flow rate variations and temperature variation obtained for vale D are comparable to those obtained for valve C.
For the three different conditions (8 L/min, 27 L/min and 40 L/min) the first diagram shows the internal pressure trend of the chamber from the initial pressure of 200 Pa to atmospheric pressure. The blue line is the value detected by the measuring instruments (Edward or Pirani). The red line represents the minimum error value, while the green line is the maximum error value. The internal pressure has a linear trend and reaches the fixed boundary conditions in about 1200 s for flow rate of 8 L/min, 400 s for flow rate of 27 L/min and 250 for flow rate of 40 L/min. It is very interesting see how the slop of the pressure diagram increase with the increasing of the flow rate from 8 L/min to 27 L/min with a percentage of almost 100% and from 27 L/min to 40 L/min with a percentage of almost 60%. It means that it is not possible to go over the 1000 Pa/s as accident simulation with this facility because the maximum flow rate achievable is 100 L/min. (see Figure 10).
Figure 10. Comparison of the three pressure diagrams, 8 L/min (blue diagram), at 27 L/min (red
diagram) and 40 L/min (red diagram).
Figure 10. Comparison of the three pressure diagrams, 8 L/min (blue diagram), at 27 L/min
(red diagram) and 40 L/min (red diagram).
In the second graphic the mean temperature, evaluated by thermocouples, is shown. In the same way, the blue line is the value detected by the measuring instruments, the red line represents the minimum error value, while the green line is the maximum error value. It is possible see that the measured error is very low for this measure. For the two graphs, error bars are used with temporal spacing of 80 s for flow rate of 8 L/min, 30 s for flow rate of 27 L/min, 16 s for flow rate of 40 L/min, to make legible graphics.
The third graph shows the flow rate trend, while the last diagram shows the flow rate trend for the first 6 second of the experiment. The flow rate reaches the fixed value around 6 s.
Figure11shows the variation of velocity measure by pressure transducer placed at 1 cm from valve C with the air flowed from valve C at 8 L/min (blue diagram), at 27 L/min (red diagram) and 40 L/min (red diagram) with the related error reference tube.
Energies 2016, 9, 578 16 of 34 Energies 2016, 9, 578
In the second graphic the mean temperature, evaluated by thermocouples, is shown. In the same way, the blue line is the value detected by the measuring instruments, the red line represents the minimum error value, while the green line is the maximum error value. It is possible see that the measured error is very low for this measure. For the two graphs, error bars are used with temporal spacing of 80 s for flow rate of 8 L/min, 30 s for flow rate of 27 L/min, 16 s for flow rate of 40 L/min, to make legible graphics.
The third graph shows the flow rate trend, while the last diagram shows the flow rate trend for the first 6 second of the experiment. The flow rate reaches the fixed value around 6 s.
Figure 11 shows the variation of velocity measure by pressure transducer placed at 1 cm from valve C with the air flowed from valve C at 8 L/min (blue diagram), at 27 L/min (red diagram) and 40 L/min (red diagram) with the related error reference tube.
(a) (b)
Figure 11. (a) Description of the velocities variation during the whole experiments. (b) A detail of the velocities variation in the first 10 s.
Figure 12 shows the variation of velocity measure by pressure transducer placed at 1 cm from valve D with the air flowed from valve D at 8 L/min (blue diagram), at 27 L/min (red diagram) and 40 L/min (red diagram) with the related error reference tube.
Figure 11.(a) Description of the velocities variation during the whole experiments. (b) A detail of the velocities variation in the first 10 s.
Figure12shows the variation of velocity measure by pressure transducer placed at 1 cm from valve D with the air flowed from valve D at 8 L/min (blue diagram), at 27 L/min (red diagram) and 40 L/min (red diagram) with the related error reference tube.Energies 2016, 9, 578
(a) (b)
Figure 12. (a) Description of the velocities variation during the whole experiments. (b) A detail of the velocities variation in the first 10 s.
“The velocities are evaluated through the transducer #461 [135]. The trend has a peak for each velocity in the first s, that varies according to the flow rate. It stabilizes in the first 50 s and then follows an asymptotic behavior that tends to zero.“
It is clear from this results that the most important experimental evidence is condensed in the first 5-6 s from the beginning of the accidents (that is the required quantity of time to get mobilized the 90% of the dust [136–141]).
Experiments from Valve E and F (LOVA accidents reproduction)
Figures 13 and 14 shown the variations of internal pressure, temperature and flow rate during the accident replication (with the calculated error bar). The experiments have been conducted only at 27 L/min and 40 L/min to reproduce the worst condition (300 Pa/s and 500 Pa/s).
(a) (b)
Figure 12.(a) Description of the velocities variation during the whole experiments. (b) A detail of the velocities variation in the first 10 s.
Energies 2016, 9, 578 17 of 34
“The velocities are evaluated through the transducer #461 [135]. The trend has a peak for each velocity in the first s, that varies according to the flow rate. It stabilizes in the first 50 s and then follows an asymptotic behavior that tends to zero.“
It is clear from this results that the most important experimental evidence is condensed in the first 5–6 s from the beginning of the accidents (that is the required quantity of time to get mobilized the 90% of the dust [136–141]).
Experiments from Valve E and F (LOVA Accidents Reproduction)
Figures13and14shown the variations of internal pressure, temperature and flow rate during the accident replication (with the calculated error bar). The experiments have been conducted only at 27 L/min and 40 L/min to reproduce the worst condition (300 Pa/s and 500 Pa/s).
Energies 2016, 9, 578
(a) (b)
Figure 12. (a) Description of the velocities variation during the whole experiments. (b) A detail of the
velocities variation in the first 10 s.
“The velocities are evaluated through the transducer #461 [135]. The trend has a peak for each velocity in the first s, that varies according to the flow rate. It stabilizes in the first 50 s and then follows an asymptotic behavior that tends to zero.“
It is clear from this results that the most important experimental evidence is condensed in the first 5-6 s from the beginning of the accidents (that is the required quantity of time to get mobilized the 90% of the dust [136–141]).
Experiments from Valve E and F (LOVA accidents reproduction)
Figures 13 and 14 shown the variations of internal pressure, temperature and flow rate during the accident replication (with the calculated error bar). The experiments have been conducted only at 27 L/min and 40 L/min to reproduce the worst condition (300 Pa/s and 500 Pa/s).
(a) (b)
Energies 2016, 9, 578
(c) (d)
Figure 13. (a) Description of the pressure increase inside STARDUST-U during the air flow inlet at 27
L/min. (b) Description of the temperature variations measured during the experiment. (c) Description of the flow rate variation in the time. (d) Flow rate increase in the early stage from the accident experimental simulation.
(a) (b)
(c) (d)
Figure 14. (a) Description of the pressure increase inside STARDUST-U during the air flow inlet at 40
L/min. (b) Description of the temperature variations measured during the experiment. (c) Description of the flow rate variation in the time. (d) Flow rate increase in the early stage from the accident experimental simulation.
The results of pressure variations, flow rate variations and temperature variation obtained for vale F are comparable to those obtained for valve E.
Figure 13. (a) Description of the pressure increase inside STARDUST-U during the air flow inlet
at 27 L/min. (b) Description of the temperature variations measured during the experiment. (c) Description of the flow rate variation in the time. (d) Flow rate increase in the early stage from the accident experimental simulation.
The results of pressure variations, flow rate variations and temperature variation obtained for vale F are comparable to those obtained for valve E.
Figure14shows velocity with initially growing trend. The peak value is about 200 m/s for a flow rate of 40 L/min and about 180 m/s for a flow rate of 27 L/min, achieved around 5 s of the experiment. Then velocity decreased.
Figure15shows the variation of velocity measure by pressure transducer placed at 24,5 cm from valve E with the air flowed from valve E at 27 L/min (red diagram) and 40 L/min (blue diagram) with the related error reference tube.
Energies 2016, 9, 578 18 of 34
Energies 2016, 9, 578
(c) (d)
Figure 13. (a) Description of the pressure increase inside STARDUST-U during the air flow inlet at 27
L/min. (b) Description of the temperature variations measured during the experiment. (c) Description of the flow rate variation in the time. (d) Flow rate increase in the early stage from the accident experimental simulation.
(a) (b)
(c) (d)
Figure 14. (a) Description of the pressure increase inside STARDUST-U during the air flow inlet at 40
L/min. (b) Description of the temperature variations measured during the experiment. (c) Description of the flow rate variation in the time. (d) Flow rate increase in the early stage from the accident experimental simulation.
The results of pressure variations, flow rate variations and temperature variation obtained for vale F are comparable to those obtained for valve E.
Figure 14. (a) Description of the pressure increase inside STARDUST-U during the air flow inlet
at 40 L/min. (b) Description of the temperature variations measured during the experiment. (c) Description of the flow rate variation in the time. (d) Flow rate increase in the early stage from the accident experimental simulation.
Energies 2016, 9, 578
Figure 14 shows velocity with initially growing trend. The peak value is about 200 m/s for a flow rate of 40 L/min and about 180 m/s for a flow rate of 27 L/min, achieved around 5 s of the experiment. Then velocity decreased.
Figure 15 shows the variation of velocity measure by pressure transducer placed at 24,5 cm from valve E with the air flowed from valve E at 27 L/min (red diagram) and 40 L/min (blue diagram) with the related error reference tube.
The graphs in Figures 13 and 14 show the internal pressure (Pa), the mean temperature (K) (calculated as arithmetic mean of the temperatures), the flow rate and the flow rate during first 6 s. Graphs include error bars calculated according to error analysis described in ‘‘Error Analysis’’ section. The results showed an increasing monotone linear trends of static pressure, from the initial value fixed at 200 Pa up to the ambient pressure fixed at about 95000 Pa; average temperature trend measured by the thermocouples with almost constant error range of about 2 K; trend of the constant flow rate after approximately 6 s from the start of the experiment. The trend in the first s is parabolic and represents that the flow meter takes about 6 s to open fully.
(a) (b)
Figure 15. (a) Description of the velocities variation during the whole experiments. (b) A detail of the
velocities variation in the first 10 s.
Figure 15 shows velocity with initially growing trends. The peak value is about 270 m/s for a flow rate of 40 L/min and about 200 m/s for a flow rate of 27 L/min, achieved around 2 s of the experiment. After the peak velocity decreased up to asymptotically to zero for different times depending on the flow rate. The graphics have been reported for 10 s because the first moments are crucial to study the phenomenon of dust mobilization.
Figure 14 shows the variation of velocity measure by pressure transducer placed at 10 cm from valve F with the air flowed from valve F at 27 L/min (red diagram) and 40 L/min (blue diagram) with the related error reference tube.
Figure 16 shows velocity with an initially growing trend. The peak value is about 200 m/s for a flow rate of 40 L/min and about 180 m/s for a flow rate of 27 L/min, achieved around 5 s of the Figure 15.(a) Description of the velocities variation during the whole experiments. (b) A detail of the velocities variation in the first 10 s.
The graphs in Figures 13and14 show the internal pressure (Pa), the mean temperature (K) (calculated as arithmetic mean of the temperatures), the flow rate and the flow rate during first 6 s. Graphs include error bars calculated according to error analysis described in “Error Analysis” section. The results showed an increasing monotone linear trends of static pressure, from the initial value fixed
![Figure 1. ITER scheme. This figure is taken from [4].](https://thumb-eu.123doks.com/thumbv2/123dokorg/7583890.112813/2.892.130.764.395.958/figure-iter-scheme-figure-taken.webp)
![Table 2 shows the main characteristics of two alloys (W-Cr 10 -Si 10 and W-Cr 12 -Ti 2.5 ) [71–73].](https://thumb-eu.123doks.com/thumbv2/123dokorg/7583890.112813/6.892.114.781.720.839/table-shows-main-characteristics-alloys-cr-si-cr.webp)
![Figure 3. Overlap in temperatures for fusion, fission and spallation facilities. This figure is taken from [18]](https://thumb-eu.123doks.com/thumbv2/123dokorg/7583890.112813/7.892.229.668.132.420/figure-overlap-temperatures-fusion-fission-spallation-facilities-figure.webp)
![Table 5. Ferritic/martensitic steels: fusion, and Generation IV fission applications. This table is taken from [77].](https://thumb-eu.123doks.com/thumbv2/123dokorg/7583890.112813/8.892.115.781.413.543/table-ferritic-martensitic-steels-fusion-generation-fission-applications.webp)