2250
|
wileyonlinelibrary.com/journal/ejn © 2019 Federation of European Neuroscience Societies Eur J Neurosci. 2020;51:2250–2269. and John Wiley & Sons LtdR E S E A R C H R E P O R T
Musical prediction error responses similarly reduced by
predictive uncertainty in musicians and non-musicians
David R. Quiroga-Martinez
1|
Niels C. Hansen
2|
Andreas Højlund
3|
Marcus Pearce
1,4|
Elvira Brattico
1|
Peter Vuust
1The peer review history for this article is available at https ://publo ns.com/publo n/10.1111/EJN.14667 Edited by Edmund Lalor.
Abbreviations: AIC, Akaike information criterion; BEM, Boundary element method; c, Criterion scores; d’, d-prime scores; dB, Decibel; EEG, Electroencephalography; ERF, Event-related field; F0, Fundamental frequency; GMSI, Goldsmiths musical sophistication index; HE, High entropy; Hz, Hertz; IDyOM, Information dynamics of music; IE, Intermediate entropy; LE, Low entropy; M, Musicians; MEG, Magnetoencephalography; MET, Musical ear test; MGA, Mean gradient amplitude; MMN, Mismatch negativity; MNI, Montreal Neurological Institute; MRI, Magnetic resonance imaging; Ms, Milliseconds; NM, Non-musicians; T, Tesla.
1Center for Music in the Brain, Aarhus University & The Royal Academy of music, Aarhus, Denmark
2The MARCS Institute for Brain, Behaviour, and Development, Western Sydney University, Sydney, NSW, Australia 3Center for Functionally Integrative Neuroscience, Aarhus University, Aarhus, Denmark
4School of Electronic Engineering and Computer Science, Queen Mary University of London, London, UK
Correspondence
David R. Quiroga-Martinez, Nørrebrogade 44 – Building 1A – 8000 Aarhus C., Denmark.
Email: [email protected] Funding information
Danmarks Grundforskningsfond, Grant/ Award Number: DNRF 117
Abstract
Auditory prediction error responses elicited by surprising sounds can be reliably re-corded with musical stimuli that are more complex and realistic than those typically employed in EEG or MEG oddball paradigms. However, these responses are reduced as the predictive uncertainty of the stimuli increases. In this study, we investigate whether this effect is modulated by musical expertise. Magnetic mismatch negativity (MMNm) responses were recorded from 26 musicians and 24 non-musicians while they listened to low- and high-uncertainty melodic sequences in a musical multi-feature paradigm that included pitch, slide, intensity and timbre deviants. When com-pared to non-musicians, musically trained participants had significantly larger pitch and slide MMNm responses. However, both groups showed comparable reductions in pitch and slide MMNm amplitudes in the high-uncertainty condition compared with the low-uncertainty condition. In a separate, behavioural deviance detection experiment, musicians were more accurate and confident about their responses than non-musicians, but deviance detection in both groups was similarly affected by the uncertainty of the melodies. In both experiments, the interaction between uncertainty and expertise was not significant, suggesting that the effect is comparable in both groups. Consequently, our results replicate the modulatory effect of predictive un-certainty on prediction error; show that it is present across different types of listen-ers; and suggest that expertise-related and stimulus-driven modulations of predictive precision are dissociable and independent.
K E Y W O R D S
1
|
INTRODUCTION
Prediction is fundamental for the perception of auditory se-quences. When listening to a series of sounds, the brain gen-erates expectations about future events partly based on the statistical regularities of the context and long-term knowl-edge of acoustic signals (Huron, 2006; Pearce, 2018). The violation of these expectations generates neural prediction error responses (den Ouden, Kok, & de Lange, 2012). So far, most research in this area has focused on very simple and artificial auditory contexts such as sequences of repeated tones or short-tone patterns (Heilbron & Chait, 2018). As a consequence, little is known about how auditory prediction operates in more complex, real-world settings.
In a previous study, we addressed this issue by measuring prediction error responses to surprising sounds embedded in auditory stimuli that resembled real music (Quiroga-Martinez et al., 2019). As a marker of prediction error, we re-corded the magnetic counterpart of the mismatch negativity (MMNm), which is a well-studied brain response to sounds that violate auditory regularities (Garrido, Kilner, Stephan, & Friston, 2009; Näätänen, Gaillard, & Mäntysalo, 1978). We compared a low-uncertainty condition—referred to as low entropy or LE—which consisted of a simple and repetitive pitch pattern, with a high-uncertainty condition—referred to as high entropy or HE—which consisted of more realistic and less predictable non-repetitive melodies. Note that en-tropy was used as a measure of uncertainty. Pitch, intensity, timbre and slide (i.e. pitch glide) violations were introduced. We found reliable MMNm responses to the violations in both conditions, thus demonstrating that low-level prediction error responses could be elicited in a constantly changing and more ecologically valid auditory stream.
Interestingly, even though MMNm responses were reli-able, their amplitudes were reduced in the HE context com-pared with the LE context, for pitch and slide deviants. This is consistent with predictive processing theories which pro-pose that prediction error responses are reduced in contexts with high as compared to low uncertainty or, equivalently, low as compared to high precision (Clark, 2016; Feldman & Friston, 2010; Hohwy, 2013; Ross & Hansen, 2016; Vuust, Dietz, Witek, & Kringelbach, 2018). The ensuing preci-sion-weighted prediction error would ensure that primar-ily reliable sensory signals drive learning and behaviour. While a growing body of research already provides evidence for this phenomenon in the auditory modality (Garrido, Sahani, & Dolan, 2013; Hsu, Bars, Hämäläinen, & Waszak, 2015; Lumaca, Haumann, Brattico, Grube, & Vuust, 2019; Sedley et al., 2016; Sohoglu & Chait, 2016; Southwell & Chait, 2018), our study was the first to show its presence in a more ecologically valid setting such as music listening. Furthermore, the findings also pointed to a feature-selective effect in which only prediction error responses related to the
manipulated auditory feature—pitch, in our case—are modu-lated by uncertainty.
In the present work, we elaborate on this finding and in-vestigate whether the effect of uncertainty on auditory predic-tion error is modulated by musical expertise. This quespredic-tion is motivated by research showing that musicians tend to exhibit stronger auditory prediction error responses than non-musi-cians. For example, larger MMN responses are often found for musically trained subjects, especially for pitch-related de-viants (Brattico et al., 2009; Fujioka, Trainor, Ross, Kakigi, & Pantev, 2004; Koelsch, Schröger, & Tervaniemi, 1999; Putkinen, Tervaniemi, Saarikivi, Ojala, & Huotilainen, 2014; Tervaniemi, Huotilainen, & Brattico, 2014; Vuust, Brattico, Seppänen, Näätänen, & Tervaniemi, 2012; Vuust et al., 2005). This has led some to propose that musical training en-hances the precision of auditory predictive models (Hansen & Pearce, 2014; Hansen, Vuust, & Pearce, 2016; Vuust et al., 2018), as more precise representations of musically rele-vant regularities would facilitate the detection of unexpected sounds.
Crucially, a distinction can be made between exper-tise-driven and stimulus-driven precision or uncertainty. The former corresponds to the fine-tuning of predictive models by musical training, whereas the latter refers to the uncer-tainty inferred from the stimulus currently being listened to. Note that stimulus-driven uncertainty was the one manipu-lated in Quiroga-Martinez et al. (2019). Consequently, our goal here is to address whether its effect on prediction error is modulated by expertise-driven precision. Thus, we conjec-tured that when musical sequences are predictable, long-term knowledge of music would only have a moderate impact on the processing of sounds. Conversely, when musical stimuli become more unpredictable, listeners would need to rely more on their musical knowledge, which would provide a greater processing advantage to musically trained participants. Therefore, we hypothesized an interaction effect in which the modulation of prediction error by uncertainty would be less pronounced for musicians than for non-musicians.
In this study, we used magnetoencephalography (MEG) and behavioural measures to test this hypothesis, employing the same stimuli and experimental designs as in Quiroga-Martinez et al. (2019). To this purpose, we compared a group of musicians with the group of non-musicians re-ported in the previous study. In the MEG experiment, participants passively listened to high- and low-entropy melodic sequences where pitch, intensity, timbre and slide deviants were introduced. In the behavioural experiment, participants were asked to detect pitch deviants embedded in different melodies and report the subjective confidence in their responses. In this case, five levels of context uncer-tainty were employed in order to detect fine-grained effects of predictive precision and dissociate pitch-alphabet size— the number of pitch categories used in the melodies—and
repetitiveness as sources of uncertainty. We expected mu-sicians to exhibit smaller reductions in MMNm responses, deviance detection scores and confidence ratings than non-musicians, as the uncertainty of auditory contexts in-creased. Finally, we performed source reconstruction on the MMNm responses and the difference in MMNm am-plitude between HE and LE conditions in order to further our understanding of the neural underpinnings of the preci-sion-weighting effect.
2
|
METHOD
For a more detailed description of the methods, see Quiroga-Martinez et al. (2019). The data, code and materials neces-sary to reproduce these experiments and results are openly available at https ://osf.io/my6te/ ; https ://doi.org/10.17605/ OSF.IO/MY6TE .
2.1
|
MEG experiment
2.1.1
|
Participants
Twenty-six musicians and twenty-four non-musicians par-ticipated in the experiment (see Table 1 for demograph-ics). The non-musicians’ group was the same as the one reported in Quiroga-Martinez et al. (2019). All participants were right-handed with no history of neurological condi-tions and did not possess absolute pitch. For recruitment purposes, participants who considered themselves musi-cians and had considerable experience playing an instru-ment were included in the musicians’ group. The musical training subscale of the Goldsmiths Musical Sophistication Index (GMSI) was used as a self-report measure of musical expertise (Müllensiefen, Gingras, Musil, & Stewart, 2014), and both the melody and rhythm parts of the Musical Ear Test (MET) were used as objective measures of musical
skills (Wallentin, Nielsen, Friis-Olivarius, Vuust, & Vuust, 2010). Note that the GMSI musical training subscale is composed of seven items that measure years of formal training on a musical instrument, years of daily practice on a musical instrument, music theory training, hours of daily practice, number of instruments played, self-percep-tion as a musician and social acknowledgement as a musi-cian. These items are rated on a seven-point scale, rather than with truly continuous measures of, for example, years of training. The total score of the subscale is the sum of the individual items, thus allowing a minimum of 7 and a maximum of 49. Individual ratings are shown in Appendix S4, arranged by group and item. GMSI values (t = 16.55,
p < .001) and MET total values (t = 5.2, p < .001) were
sig-nificantly higher for musicians than for non-musicians. All non-musicians’ scores lay in the 37 percentile of the norm of the subscale, whereas all musicians’ scores lay above the 45 percentile of the norm.
Participants were recruited through an online database and agreed to take part in the experiment voluntarily. All participants gave informed consent and were paid 300 Danish kroner (approximately 40 euro) as compensation. Data from two musicians (not included in the reported de-mographics) were excluded from the analysis due to arte-facts related to dental implants. The study was approved by the Central Denmark Regional Ethics Committee (De Videnskabsetiske Komitéer for Region Midtjylland in Denmark) and conducted in accordance with the Helsinki declaration.
2.1.2
|
Stimuli
Low-entropy (LE) and high-entropy (HE) conditions were included in the experiment. LE stimuli corresponded to a simple four-note repeated pitch pattern (low–high–me-dium–high) known as the Alberti bass, which has previ-ously been used in musical MMNm paradigms (Vuust et
MEG experiment Behavioral experiment
M NM M NM Sample size 26 24 24 21 Female 10 13 14 16 Age 24.15 (±2.89) 26.54 (±3.4) 22.75 (±4.42) 21.9 (±5.18) GMSI 35.96 (±6.57) 10.67 (±4.03) 35.42 (±5.69) 12.76 (±5.88) MET (melody) 41.5 (±4.43) 33.17 (±5.39) MET (rhythm) 40.77 (±4.55) 35.79 (±5.33) MET (Total) 82.27 (±8.35) 69.12 (±9.44)
Note: Mean and standard deviation values are reported.
Abbreviations: M, musicians; NM, non-musicians.
TABLE 1 Participants’ demographic and musical expertise information in the two experiments
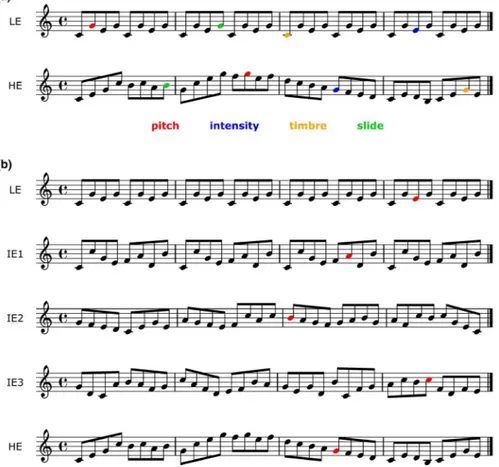
al., 2011; Vuust, Liikala, Näätänen, Brattico, & Brattico, 2016). In contrast, HE stimuli consisted of a set of major and minor versions of six novel melodies which did not have a repetitive internal structure and spanned a broader local pitch range than LE stimuli (Figure 1; see Appendix S1 in Quiroga-Martinez et al., 2019 for the full stimulus set). Individual HE and LE melodies were 32-note long, lasted eight seconds and were pseudorandomly transposed from 0 to 5 semitones upwards. The order of appearance of the melodies was pseudorandom. After transposi-tion during stimulatransposi-tion, the pitch range of the HE condi-tion spanned 31 semitones from B3 (F0 ≈ 247 Hz) to F6
(F0 ≈ 1,397 Hz). LE melodies were transposed to two
dif-ferent octaves to cover approximately the same pitch range as HE melodies. The uncertainty of the stimuli along the pitch dimension was estimated with Information Dynamics of Music (IDyOM), a variable-order Markov model of auditory expectation (Pearce, 2005, 2018). When predict-ing pitch continuations based on scale-degree and pitch-interval transition probabilities, and a training corpus of Western tonal hymns and folk songs, this model confirmed higher mean entropy (which is a measure of uncertainty) and information content (which is a measure of surprise) for HE as compared to LE melodies (see Quiroga-Martinez et al., 2019 for more details).
For stimulus delivery, a pool of 31 standard piano tones was created with the “Warm-grand” sample in Cubase
(Steinberg Media Technology, version 8). Each tone was 250 ms long, was peak-amplitude-normalized and had 3-ms-long fade-in and fade-out to prevent clicking. No gaps be-tween tones were introduced. For the creation of deviants, the standards were modified as follows: pitch: +50 cents; intensity: −20 dB; timbre: band-pass filter (1–4 kHz); slide: continuous pitch glide from −2 semitones. Deviants were created with Audition (Adobe Systems Incorporated, version 8).
Each condition was presented in a separate group of three consecutive blocks. Within each block, melodies were played one after the other without pauses. At the beginning of each block, a melody with no deviants was added to en-sure a certain level of auditory regularity at the outset. One deviant per feature was introduced in each melody. There were 144 deviants per feature in each condition. The posi-tion of each deviant was defined by segmenting the melody in groups of four notes, selecting some of these groups and choosing randomly any of the four places within a group, with equal probability. The order of appearance of the different types of deviants was pseudorandom, so that no deviant followed another deviant of the same feature. The selection of four-note groups was counterbalanced among trials attending to the constraints of a combined condition included to assess the predictive processing of simultane-ous musical streams (see Quiroga-Martinez et al., 2019 for further details). The analysis of the combined condition is
FIGURE 1 Examples of the individual melodies employed in (a) the MEG and (b) the behavioural experiment. Coloured notes represent deviants (see online version for colour display). LE = low entropy, IE = intermediate entropy, HE = high entropy. For the full stimulus set, see Quiroga-Martinez et al. (2019) and the online repository [Colour figure can be viewed at wileyonlinelibrary.com]
beyond the scope of this article and will be presented else-where. HE and LE conditions were counterbalanced across participants and always came after the combined condition.
2.1.3
|
Procedures
Participants gave their consent after receiving oral and writ-ten information, and then completed the MET, filled out the GMSI questionnaire and put on MEG-compatible clothes. Electrodes and HPI coils were attached to their skin, and their heads were digitized. During the recording, partici-pants were sitting upright in the MEG scanner looking at a screen. Before presenting the musical stimuli, their individ-ual hearing threshold was measured through a staircase pro-cedure and the sound level was set at 60 dB above threshold. Participants were instructed to watch a silent movie of their choice, ignore the sounds and move as little as possible. They were told there would be musical sequences play-ing in the background interrupted by short pauses so that they could take a break and adjust their posture. Sounds were presented through isolated MEG-compatible ear tubes (Etymotic ER•30). The recording lasted approximately 90 min, and the whole experimental session took between 2.5 and 3 hr including consent, musical expertise tests, preparation, instructions, breaks and debriefing.
2.1.4
|
MEG recording and analyses
Brain magnetic fields were recorded with an Elekta Neuromag MEG TRIUX system with 306 channels (204 planar gradiometers and 102 magnetometers) and a sam-pling rate of 1,000 Hz. Continuous head position informa-tion (cHPI) was obtained with four coils attached to the forehead and the mastoids. Offline, the temporal extension of the signal source separation (tSSS) technique (Taulu & Simola, 2006) was used to isolate signals coming from inside the skull employing Elekta's MaxFilter software (Version 2.2.15). This procedure included movement com-pensation for all participants except two non-musicians, for whom continuous head position information was not reli-able due to suboptimal placement of the coils. These partic-ipants, however, exhibited reliable auditory event-related fields (ERFs), as successfully verified by visually inspect-ing the amplitude and polarity of the P50(m) component. Electrocardiography, electrooculography and independ-ent componindepend-ent analysis were used to correct for eye-blink and heartbeat artefacts, employing a semi-automatic rou-tine (FastICA algorithm and functions “find_bads_eog” and “find_bads_ecg” in MNE-Python) (Gramfort, 2013). Visual inspection of the rejected components served as a quality check.
Using the Fieldtrip toolbox (version r9093) (Oostenveld, Fries, Maris, & Schoffelen, 2011) in MATLAB (R2016a, The MathWorks Inc.), epochs comprising a time window of 400 ms after sound onset were extracted and baseline-cor-rected with a pre-stimulus baseline of 100 ms. Epochs were then low-pass-filtered with a cut-off frequency of 35 Hz and down-sampled to a resolution of 256 Hz. For each par-ticipant, ERFs were computed by averaging the responses for all deviants for each feature and averaging a selection of an equal number of standards. These were selected by finding, for each single deviant, a standard tone that was not preceded by a deviant and was in the same position of the same HE or LE melody—although not necessarily the same transposition—in a different trial. This ruled out artefacts related to the difference in noise between condi-tions—as there are many more standards than deviants— and the position of the deviant within the melody. After averaging, planar gradiometers were combined by com-puting root mean square values. Finally, a new baseline correction was applied and MMNm difference waves were computed by subtracting the ERFs of standards from the ERFs of deviants.
Statistical analyses were performed on combined gradiom-eter data. For the main analyses, a mass univariate approach was used in combination with cluster-based permutations (Maris & Oostenveld, 2007) for family-wise error correction. Two-sided paired- and independent-samples t tests were used for within- and between-subjects contrasts, respectively. The cluster-forming alpha level was 0.05, the cluster-level statistic was the maximum sum of t-values (maxsum) and the number of permutations was set to 10,000. All tests were conducted for each feature separately in a time window between 100 and 250 ms, which covers the typical latency of the MMN (Näätänen, Paavilainen, Rinne, & Alho, 2007). To assess the elicitation of the MMNm, we compared the ERFs of standards with the ERFs of deviants for each group independently. The main effect of entropy was assessed by comparing, for each feature, the MMNm responses of all participants for LE and HE conditions. The main effect of expertise was assessed by comparing the average of LE and HE responses between groups. The entropy-by-expertise interaction was tested by subtracting HE from LE MMNm responses for each partici-pant and comparing the resulting differences between groups. Post hoc, exploratory tests of simple effects were performed for the effect of entropy and expertise for each group and con-dition, respectively.
To assess the relative evidence for the null and alternative hypotheses, a secondary Bayesian analysis was performed on mean gradient amplitudes (MGAs). The assessment of evidence was not possible under classical null hypothesis testing where we could only infer the probability of the data assuming the null hypothesis was true. Therefore, a Bayesian analysis allowed us to quantify the evidence in favour of and
against the entropy-by-expertise interaction and measure its conclusiveness. Furthermore, Bayesian estimation allowed the inclusion of prior knowledge, thus providing informed constraints that typically improve inference (Wagenmakers et al., 2018).
MGAs were obtained as the mean activity ± 25 ms around the MMNm peak, defined as the highest local maxima of the ERF between 100 and 250 ms after sound onset. This average was obtained from the four tempo-ral-combined gradiometers in each hemisphere with the largest P50(m) response (right channels: 1342–1343, 1312–1313, 1322–1323 and 1332–1333; left channels: 0222–0223, 0212–0213, 0232–0233 and 0242–0243). Using R (R Core Team, 2019), the differences between HE and LE MMNm amplitudes were computed for each par-ticipant and used as the dependent variable in a Bayesian mixed-effects model including parameters for the effects of feature, hemisphere and group and their interactions (brms package, Bürkner, 2017). Participants were in-cluded as a random effect with respect to the intercept and the slopes of feature and hemisphere. Priors were taken from our previous work with the non-musicians’ group (see the analysis scripts and saved model fits in the online repository for a full description of priors and parameters). For the effect of expertise and the interactions with hemi-sphere and feature, a conservative prior was set with a mean of 0 and a standard deviation of 3 fT/cm, which is around half of the effect of entropy for the pitch MMNm in non-musicians. This prior assumes that small effect modulations are most likely and that situations in which the effect of entropy in musicians disappears, changes direction or is at least twice the effect in non-musicians are unlikely. Inference was based on 95% credible inter-vals, Bayes factors (BFs) and posterior probabilities, as estimated for each feature and hemisphere (“hypothesis” function, brms package).
2.1.5
|
Source reconstruction
Source reconstruction was performed with the multiple sparse priors (MSP) method (Friston et al., 2008) imple-mented in SPM12 (version 7478). Only data from twenty musicians and twenty non-musicians were included, as individual anatomical magnetic resonance images (MRI) were available for these participants only. For one of the excluded musicians and one of the excluded non-musi-cians, the images were corrupted by artefacts, whereas the remaining excluded participants did not attend the MRI session. Brain scans were obtained with a magnetization-prepared two rapid gradient echo (MP2RAGE) sequence (Marques et al., 2010) in a Siemens Magnetom Skyra 3T scanner, which produced two images that were combined
and motion-corrected to form unified brain volumes. These volumes were segmented, projected into MNI co-ordinates and automatically coregistered with the MEG sensor positions using digitized head shapes and preau-ricular and nasion landmarks. Coregistration outputs were visually inspected. Lead fields were constructed using a single-shell BEM model with 20.484 dipoles (fine grid). A volume of the inverse solution was created for each participant feature and condition, in the following time windows: 175–215 ms for pitch, 110–150 ms for timbre and intensity, and 275–315 ms for slide. These time win-dows were chosen based on the peak MMNm amplitudes for each feature. Source reconstruction was also con-ducted for the differences between HE and LE conditions for pitch and slide MMNm amplitudes, with the aim to reveal the neural substrates of the entropy effect. To this end, individual volumes of the inverse solution were ob-tained for a time window between 150 and 200 ms. Note that the case of the slide deviant is somewhat particular as the peak MMNm response occurred later than expected, whereas the effect of entropy was restricted to an ear-lier time window. For greater detail and an interpretation of this result, see Quiroga-Martinez et al. (2019). The volumes for each feature and condition, as well as the volumes for the entropy effect, were submitted to a one-sample t test to reveal the sources consistently identified across all participants. The error rate of voxel-wise mul-tiple tests was corrected with random field theory with a cluster-level alpha threshold of 0.05 (Worsley, 2007).
2.2
|
Behavioural experiment
2.2.1
|
Participants
Twenty-four musicians and twenty-one non-musicians participated in the behavioural experiment (Table 1). The non-musicians’ group is the same as the one reported in Quiroga-Martinez et al. (2019). Musical expertise was measured with the GMSI musical training subscale which yielded significantly higher scores for musicians than for non-musicians (t = 13.08, p < .001). All non-musicians’ scores lay in the 42 percentile of the norm of the subscale, whereas all musicians’ scores lay above the 45 percentile of the norm. Individual ratings are shown in Appendix S1, arranged by group and subscale item. Participants were re-cruited through an online database for experiment partici-pation, agreed to take part voluntarily, gave their informed consent and received 100 Danish kroner (approximately 13.5 euro) as compensation. The data from all participants were analysed, as above-chance deviance detection was verified in all cases. The sample size was chosen to be comparable to that of the MEG experiment. Two musicians
and two non-musicians had previously participated in the MEG experiment.
2.2.2
|
Experimental design
Five conditions were included (Figure 1). Two of them cor-respond to the HE and LE conditions of the MEG experi-ment and employ a selection of the respective melodies. Three additional conditions with intermediate levels of entropy (IE1, IE2 and IE3) were included to investigate whether more fine-grained manipulations of uncertainty modulate prediction error responses in musicians, as was previously shown in non-musicians. The pitch alphabet of these conditions spanned eight tones and was always the same, comprising a major diatonic scale from C4 to C5. Note that, in the MEG experiment, HE stimuli were not only less repetitive but also had a larger pitch alphabet than LE (at least before transposition during the experiment). In contrast, in the IE conditions we manipulated uncertainty by changing repetitiveness only. Thus, IE1 consisted of a repeated eight-note pattern, IE2 consisted of proper melo-dies with less constrained repetition, and IE3 consisted of pseudorandom orderings of the tones. Note that the con-trast LE > IE1 would reveal whether the pitch-alphabet size alone is sufficient to modulate prediction error, whereas the comparisons IE1 > IE3, IE1 > IE2 and IE2 > IE3 would reveal the same with regard to repetitiveness.
For each single melody in the experiment, a target version was created by raising the pitch of a tone by 25 cents. This deviation was smaller than in the MEG experiment to avoid ceiling effects observed for non-musicians during piloting. The target tone was located in a random position in the sec-ond half of each melody. Only pitch deviants were included because we manipulated uncertainty along the pitch dimen-sion and because this was the feature showing the largest uncertainty effect in the MEG results. All melodies were 32-note long and were played with the same sound pool as the MEG experiment. There were ten target melodies and ten foil melodies (with no deviants) per condition. Participants were instructed to listen to the melodies, decide after each of them whether an out-of-tune note was present or not, and report how certain they were about their answer on a scale from 1 (not certain at all) to 7 (completely certain). The experimen-tal session lasted around 30 min.
2.2.3
|
Statistical analyses
We used signal detection theory to analyse accuracy (Macmillan, 2004), based on the assumption that larger predic-tion error responses would enhance the ability to distinguish target from non-target stimuli. For each condition, d-prime (d’)
scores were computed as a measure of sensitivity and criterion (c) scores was computed as a measure of response bias. In the few cases where participants achieved 100% or 0% of hits or false alarms, values were adjusted to 95% and 5%, respectively, to avoid infinite values in the estimations (Macmillan, 2004).
Statistical analyses were run in R. For d’ scores, different mixed-effects models were estimated using maximum likeli-hood (“lmer” function, lme4 package, Bates, Mächler, Bolker, & Walker, 2015) and compared using likelihood ratio tests and Akaike information criteria (AIC). Model d0 included only an intercept as a fixed effect, whereas two alternative models added categorical (d1) or continuous (d2) terms for the entropy conditions. For model d2, we assigned values 1, 2, 3, 4 and 5 to the conditions according to their estimated uncertainty and treated them as a continuous linear predictor. This allowed us to assess the extent to which a linear decreasing trend was present in the data, as was done previously with non-musicians (Quiroga-Martinez et al., 2019). Building on these models, in
d1e and d2e a term for musical expertise was added, and in d1i
and d2i a term for the entropy-by-expertise interaction was fur-ther included. Random intercepts for participants were included in all models. Random slopes were not added, as the number of data points per participant was not sufficient to avoid over-fitting. For c scores, mixed-effects models were similarly com-pared, including an intercept-only model (cr0), a model with a categorical effect of entropy (cr1), a model with an additional effect of expertise (cr1e) and a model with an additional term for the entropy-by-expertise interaction (cr1i). Random inter-cepts for participants were added.
Regarding confidence ratings, ordinal logistic regression was employed in the form of a cumulative-link mixed model (“clmm” function, ordinal package; Christensen, 2019) using logit (log-odds) as link. Models with an intercept only (co0), categorical (co1s) terms for entropy and additional terms for expertise (co1se) and the entropy-by-expertise interaction (co1si) were estimated and compared. These models included random intercepts and slopes for participants. Unlike with d’ scores, no model included continuous terms for entropy, as categorical models were previously shown to explain the data significantly better for non-musicians. Moreover, note that the cumulative-link model estimates an intercept for each cut point between adjacent categories in the response variable. Post hoc, Bonferroni-corrected pairwise contrasts for the ef-fect of entropy on confidence ratings, d’ scores and c scores were conducted with the function “emmeans” (emmeans package; Lenth, Singmann, Love, Buerkner, & Herve, 2019) for musicians and non-musicians separately.
Bayesian estimation was used to assess the evidence for the entropy-by-expertise interaction. Models d1i, d2i and co1i were re-estimated and labelled as d1ib, d2ib and
co1ib. Priors were defined based on our previous work
with non-musicians (see corresponding analyses scripts in the online repository for a full description of priors
and parameters). For the continuous model of d’ scores (d2ib), the prior for the entropy-by-expertise interac-tion was Gaussian with mean 0 and standard deviainterac-tion 0.1, which corresponds to half of the slope for the ef-fect of entropy previously estimated for non-musicians. This prior is conservative and implies that small effect modulations are deemed most likely and that a complete absence, change in direction or excessive enhancement of the effect is considered unlikely. For the categorical model of d’ scores (d1ib), a Gaussian prior with mean 0 and standard deviation 0.4 was used for each of the en-tropy conditions. This prior corresponds to about half of the difference between the LE and HE conditions and, as with the continuous model, is conservative and deems extreme modifications of the effect unlikely. Regarding confidence ratings, a similar conservative Gaussian prior was set for the interaction term, with mean 0 and stan-dard deviation 0.35. This prior deems small effects as the most likely and odds modifications larger than twice
(e2×0.35=2) or smaller than half (
e2×−0.35=0.5) of the
orig-inal effect as unlikely. Inference was based on 95% cred-ible intervals, Bayes factors and posterior probabilities, estimated for each feature and hemisphere (“hypothesis” function, brms package).
3
|
RESULTS
3.1
|
Presence of the MMNm
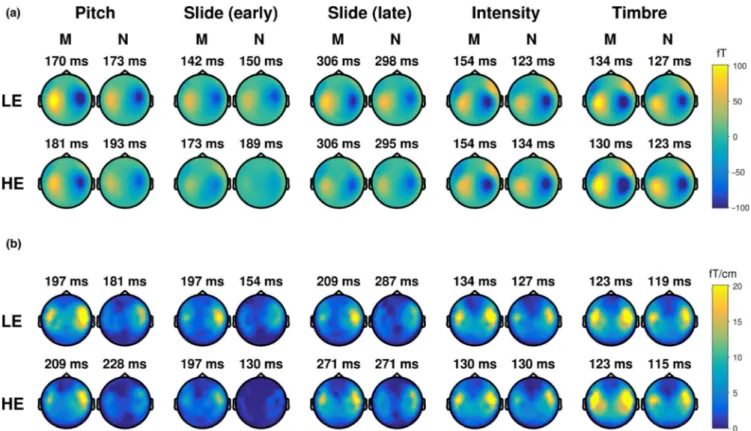
As previously reported for the non-musicians (Quiroga-Martinez et al., 2019), we also found a difference between standards and deviants for each feature in the musicians’ group (all p < .001, Appendix S1). This difference had virtually the same topography and polarity as previously reported, thus confirming the presence of the MMNm (Figure 2).
3.2
|
Effects of entropy, expertise and
interaction
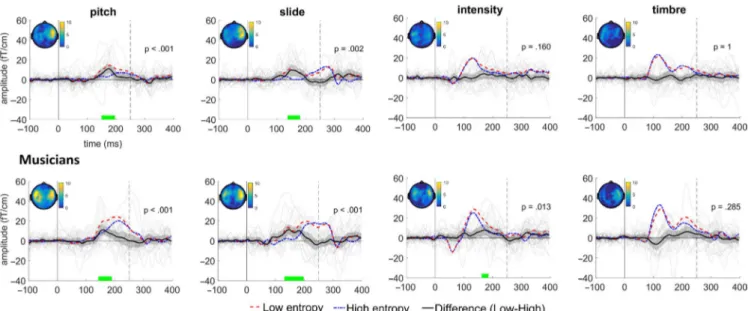
There was a significant main effect of entropy for pitch (p < .001), slide (p < .001) and intensity (p < .001), but not for timbre (p = .068), in the MMNm responses. Analyses of simple effects revealed significant differences for pitch and slide in both groups and for intensity in musicians only (Figure 3). A significant main effect of expertise was observed for pitch and slide, but not intensity or timbre, in the MMNm responses (Figure 4). The same pattern
FIGURE 2 Topographic maps of the MMNm for all features, groups and conditions in (a) magnetometers and (b) gradiometers. The activity corresponds to an average of ±25 ms around the peak latency, which is shown above each plot. The slide MMNm is displayed in both early and late time windows (see Quiroga-Martinez et al. (2019) for an explanation of early and late effects in the slide MMNm). LE = low entropy, HE = high entropy, M = musicians, N = non-musicians [Colour figure can be viewed at wileyonlinelibrary.com]
FIGURE 3 MMNm amplitudes for low-entropy (LE) and high-entropy (HE) conditions and the difference between conditions in both groups. The displayed activity corresponds to the average of the four right temporal-combined gradiometers with the largest amplitude (channels 1342–1343, 1312–1313, 1322–1323 and 1332–1333). Grey lines depict individual MMNm responses. Shaded grey areas indicate 95% confidence intervals. Dashed vertical lines mark the onset of the next tone. Topographic maps show activity ±25 ms around the peak difference. For descriptive purposes, green horizontal lines indicate when this difference was significant, according to the permutation tests (see online version for colour display). Note, however, that this is not an accurate estimate of the true extent of the effect (Sassenhagen & Draschkow, 2019) [Colour figure can be viewed at wileyonlinelibrary.com]
FIGURE 4 Activity related to the main effect of expertise and the entropy-by-expertise interaction—that is difference between low-entropy and high-low-entropy MMNm amplitudes for musicians and non-musicians. The displayed activity corresponds to the average of the four right temporal-combined gradiometers with the largest amplitude (channels 1342–1343, 1312–1313, 1322–1323 and 1332–1333). Shaded areas indicate 95% confidence intervals. Dashed vertical lines mark the onset of the next tone. Topographic maps show activity ±25 ms around the peak difference. For descriptive purposes, green horizontal lines indicate when this difference was significant (see online version for colour display). Note, however, that this is not an accurate estimate of the true extent of the effect (Sassenhagen & Draschkow, 2019) [Colour figure can be viewed at wileyonlinelibrary.com]
emerged when LE (pitch: p = .01; slide: p = .018; inten-sity: p = .99; timbre: p = .68) and HE (pitch: p = .005; slide: p = .014; intensity: p = .3; timbre: p = .89) condi-tions were analysed separately. The entropy-by-expertise interaction was not significant for any of the four features (Figure 4).
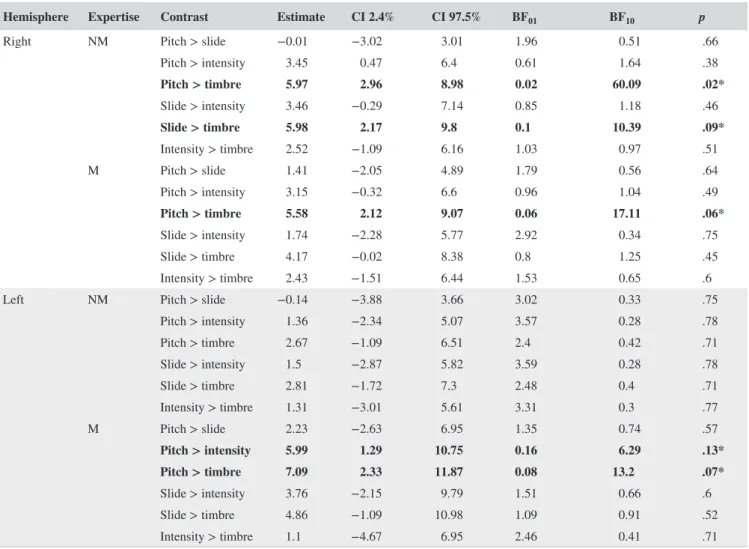
Regarding secondary Bayesian analyses, the posterior distributions of the differences between musicians and non-musicians for each hemisphere and feature are shown in Figure 5b. 95% credible intervals included zero in all cases. Bayes factors suggested that the null hypothesis was between 1.18 and 3.06 times more likely than the alternative, and the posterior probability of a null effect varied between 0.62 and 0.75, depending on the feature and hemisphere. We regard this as anecdotal/inconclu-sive evidence for the null hypothesis. Moreover, Bayesian pairwise contrasts between features reproduced the pat-terns observed in the maximum-likelihood estimates pre-viously reported for non-musicians (Quiroga-Martinez et al., 2019), in which pitch and slide tended to have larger entropy-related reductions in MMNm amplitude than intensity and timbre, in the right but not the left hemi-sphere. For musicians, this pattern was different, with conclusive evidence for a difference between pitch and timbre in both hemispheres, and moderate evidence for a difference between pitch and intensity in the left hemi-sphere (Table 2).
3.3
|
Source reconstruction
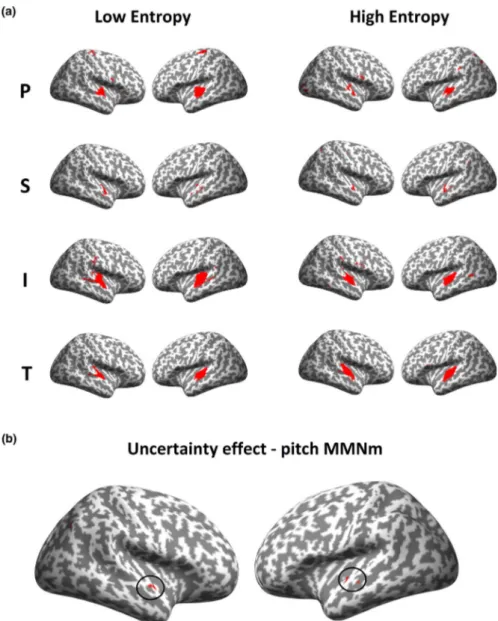
Neural generators of the MMNm were located in the sur-roundings of right and left auditory cortices, including both the posteromedial and anterolateral portions of Heschl's gyrus (Figure 6). No prefrontal generators were observed, with the exception of the pitch MMNm for which there was a small source in the ventral part of the premotor cortex (BA6). Small clusters were also found for pitch in the so-matosensory and parietal cortices, and for intensity in the parietal lobe around the perisylvian region. Regarding the entropy effect, the neural generators for pitch were located in the superior temporal gyrus anterior to the generator of the MMNm, whereas for slide a significant cluster was found in the right fusiform gyrus—an area involved in higher-order visual processing—which could be related to spurious visual activity arising from watching the movie. For this reason, uncorrected values thresholded at 0.001 are shown for the entropy effect on the slide MMNm in the Appendix S2, which includes clusters in the anterior part of the superior temporal gyrus.
3.4
|
Behavioural experiment
Parameter estimates and data from the behavioural experi-ment are shown in Figure 7. Analyses of d’ scores revealed
FIGURE 5 (a) Bayesian estimates of the mean gradient MMNm amplitude differences between high-entropy (HE) and low-entropy (LE) conditions for each group. Error bars represent 95% credible intervals. (b) Posterior probability densities of the differences in the entropy effect between musicians and non-musicians (i.e. entropy-by-expertise interaction) for each hemisphere and feature. Shaded areas depict 95% credible intervals. NM = non-musicians, M = musicians, BF01 = Bayes factor in favour of the null, p = posterior probability of the null [Colour figure can be viewed at wileyonlinelibrary.com]
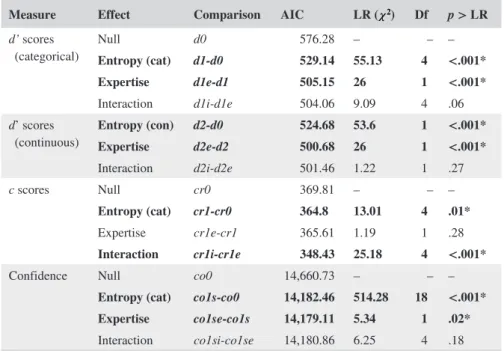
that adding entropy as a categorical (d1) or continuous (d2) factor explained the data significantly better than an inter-cept-only (d0) model (Table 3). Furthermore, the compari-sons d1e-d1 and d2e-d2 revealed a significant main effect of expertise, whereas the comparisons d1i-d1e and d2i-d2e were non-significant, thus failing to provide evidence for an entropy-by-expertise interaction. A contrast between the continuous (d2e) and the categorical model (d1e) was not significant (𝜒2=1.53,p = .67). The residuals of these two
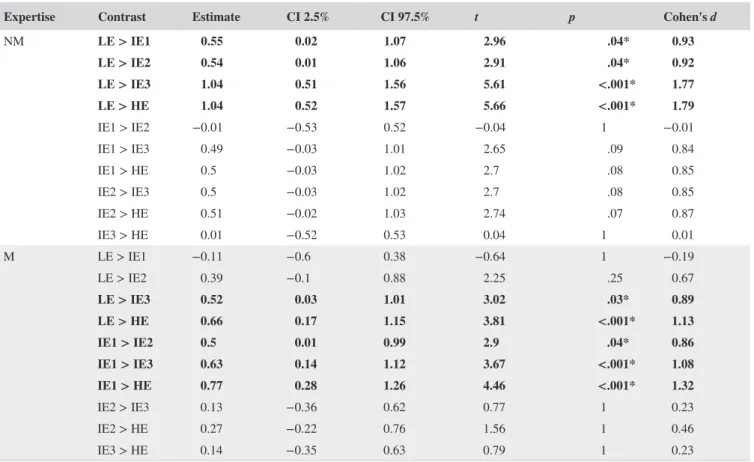
models were normally distributed. AIC values revealed a similar picture and slightly favoured d2e over d1e as the winning model (Table 3). Bonferroni-corrected pairwise comparisons for the full model (d1i) showed significant differences between LE and the other four conditions for non-musicians. For musicians, however, the comparisons LE > IE1 and LE > IE2 were non-significant, whereas the contrasts LE > IE3, LE > HE, IE1 > IE2, IE1 > IE3 and IE1 > HE were significant. Finally, other compari-sons such as IE1 > IE3, IE2 > HE and IE2 > HE, although
non-significant, resulted in large effect sizes in both groups (Table 4).
Regarding Bayesian analyses, there was anecdotal/in-conclusive evidence that the interaction terms were not dif-ferent from zero, for both the d1ib and d2ib models (Figure 8). The only exception was the parameter for LE > IE1 in model d1ib, for which zero was located slightly to the left of the credible interval. An interaction in this case was about three times more likely than a null effect. This is in agreement with the likelihood ratio test between d1i and
d1e, for which the p-value was close to the alpha threshold
(Table 3).
An analysis of c scores revealed a main effect of en-tropy and an interaction between enen-tropy and expertise (Table 3). The mean c score for both groups was positive, thus indicating a mild bias towards missing the targets. The bias changed between conditions following different pat-terns for each group, as revealed in the pairwise contrasts. Concretely, for non-musicians there was a significant
TABLE 2 Pairwise Bayesian contrasts between features for entropy-related MMNm amplitude differences in each group and hemisphere
Hemisphere Expertise Contrast Estimate CI 2.4% CI 97.5% BF01 BF10 p
Right NM Pitch > slide −0.01 −3.02 3.01 1.96 0.51 .66 Pitch > intensity 3.45 0.47 6.4 0.61 1.64 .38 Pitch > timbre 5.97 2.96 8.98 0.02 60.09 .02* Slide > intensity 3.46 −0.29 7.14 0.85 1.18 .46 Slide > timbre 5.98 2.17 9.8 0.1 10.39 .09* Intensity > timbre 2.52 −1.09 6.16 1.03 0.97 .51 M Pitch > slide 1.41 −2.05 4.89 1.79 0.56 .64 Pitch > intensity 3.15 −0.32 6.6 0.96 1.04 .49 Pitch > timbre 5.58 2.12 9.07 0.06 17.11 .06* Slide > intensity 1.74 −2.28 5.77 2.92 0.34 .75 Slide > timbre 4.17 −0.02 8.38 0.8 1.25 .45 Intensity > timbre 2.43 −1.51 6.44 1.53 0.65 .6 Left NM Pitch > slide −0.14 −3.88 3.66 3.02 0.33 .75 Pitch > intensity 1.36 −2.34 5.07 3.57 0.28 .78 Pitch > timbre 2.67 −1.09 6.51 2.4 0.42 .71 Slide > intensity 1.5 −2.87 5.82 3.59 0.28 .78 Slide > timbre 2.81 −1.72 7.3 2.48 0.4 .71 Intensity > timbre 1.31 −3.01 5.61 3.31 0.3 .77 M Pitch > slide 2.23 −2.63 6.95 1.35 0.74 .57 Pitch > intensity 5.99 1.29 10.75 0.16 6.29 .13* Pitch > timbre 7.09 2.33 11.87 0.08 13.2 .07* Slide > intensity 3.76 −2.15 9.79 1.51 0.66 .6 Slide > timbre 4.86 −1.09 10.98 1.09 0.91 .52 Intensity > timbre 1.1 −4.67 6.95 2.46 0.41 .71 Abbreviations: BF01, Bayes factor in favour of the null; BF10, Bayes factor in favour of the alternative; CI, credible interval; M, musicians; NM, non-musicians; P,
posterior probability of the null.
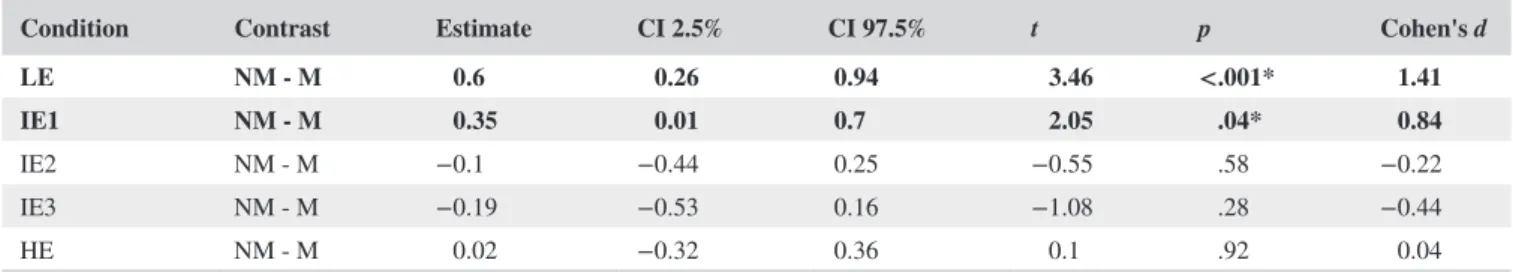
difference in the contrasts LE > IE3 and IE1 > IE3, whereas for musicians c scores were significantly higher for LE than the other four conditions (Appendix S3). When contrasting musicians and non-musicians for each condi-tion separately, the nature of the interaccondi-tion was clearer. For LE and IE1, the bias was significantly lower for musi-cians than non-musimusi-cians and even became negative in the case of LE (Table 5, Figure 7).
Regarding classical linear mixed-effects models of confi-dence ratings, there were main effects of entropy and exper-tise, as revealed by the contrasts co1s-co0 and co1se-co1s, respectively (Table 3). Adding an interaction term (co1si) did not explain the data significantly better. AIC values suggested co1se as the winning model. Pairwise compar-isons revealed significant differences between LE and the other four conditions and the contrast IE1 > IE3 for non- musicians (Table 6). For musicians, there was not a significant difference for the contrast LE > IE1 but for contrasts IE1 > LE2, IE1 > LE3, IE > HE, IE1 > IE3,
IE1 > HE and IE2 > IE3. Finally, Bayesian analyses sug-gested moderate evidence for an interaction in the case of the LE-IE1 and LE-IE2 slopes and inconclusive evidence in favour of the null for the LE-IE3 and LE-HE parameters (Figure 8).
4
|
DISCUSSION
In the present work, we show that the reduction in predic-tion error responses by predictive uncertainty (Quiroga-Martinez et al., 2019) is also found in musically trained participants. This indicates that the effect is robust and is present across listeners with different levels of musical expertise. Moreover, while musicians had larger MMNm responses to pitch and slide deviants, there was no evi-dence for an entropy-by-expertise interaction that would indicate a less pronounced effect of uncertainty for musi-cal experts.
FIGURE 6 Statistical maps of the source reconstruction for (a) the MMNm for each feature and condition and (b) the effect of entropy on pitch MMNm responses. Clusters are thresholded at p < .05 after multiple-comparisons correction. Clusters for the entropy effect are marked with a circle. Participants from both groups (musicians and non-musicians) were included in the statistical tests. P = pitch, S = slide, I = intensity, T = timbre [Colour figure can be viewed at wileyonlinelibrary. com]
4.1
|
Expertise-related effects
Across different degrees of melodic entropy, musicians were more accurate and confident in detecting pitch deviations, and had larger pitch and slide MMNm responses in the MEG exper-iment. This extends previous findings showing larger MMNm responses—especially for pitch-related deviants—in musicians than non-musicians (Brattico et al., 2009; Fujioka et al., 2004;
Koelsch et al., 1999; Putkinen et al., 2014; Tervaniemi et al., 2014; Vuust et al., 2012, 2005). As this indicates an enhance-ment of auditory discrimination skills and could be framed as an increase in predictive precision, it is rather surprising that the effect of contextual uncertainty on prediction error is not significantly different between the two groups.
What these results suggest is that expertise-driven and stim-ulus-driven changes in predictive precision are dissociable and
FIGURE 7 (a) d’ scores, (b) c scores and (c) confidence ratings—expressed as the probability of response for each confidence category. Note how the number of higher ratings (e.g. 7) tended to decrease, and the number of lower ratings (e.g. 1) tended to increase, with increasing entropy levels. Also, note how musicians were more confident or certain overall. All parameter values were taken from maximum-likelihood estimates. For d’ scores, the slopes of the continuous (d2i) model are also plotted as dashed lines. Error bars and shaded areas represent 95% confidence intervals. M = musicians, NM = non-musicians, LE = low entropy, IE = intermediate entropy, HE = high entropy [Colour figure can be viewed at wileyonlinelibrary.com]
independent. Thus, intensive musical training might sharpen the long-term representation of in-tune musical pitch catego-ries and therefore facilitate the detection of pitch deviants. This would result in higher baseline levels of deviance detection and confidence as well as larger baseline MMNm amplitudes for musicians. In contrast, the uncertainty of the current stim-ulus would be inferred dynamically from its local statistics, leading to a short-term modulation of prediction error that is independent from long-term expertise, hence explaining the additive effects observed in both the MEG and behavioural experiments.
The observed pattern of results is surprising also with regard to behavioural studies in which musicians gave sig-nificantly higher unexpectedness ratings to melodic continu-ations than non-musicians, in contexts with low but not high entropy (Hansen & Pearce, 2014; Hansen et al., 2016). This finding has been taken to reflect a better ability of musicians to distinguish between low- and high-entropy contexts. Note that these results would predict a larger effect of entropy in musical experts, which is the opposite of what we hypothe-sized, but for which there was no evidence in our data either. It has to be noted, though, that the type of unexpected tones that we used was different from the one reported in those experiments. Here, surprising tones corresponded to out-of-tune deviants, whereas in the behavioural studies unexpect-edness judgements were made on plausible in-tune melodic continuations. Furthermore, the effect of entropy was re-ported for expected and unexpected tones combined, whereas here we only employed tones that were highly unexpected. These discrepancies point to future research addressing the
effect of entropy on the neural responses to in-tune compared with out-of-tune surprising tones, and to expected and unex-pected tones separately.
Bayesian estimation allowed us to evaluate the relative evidence for the null and alternative hypotheses. For the change in MMNm amplitude between conditions, the param-eter estimates of the difference between groups generally had small mean values (Figure 5b), indicating a rather small or absent modulation of expertise. However, while all credible intervals contained zero, they were also uncertain, spanning a rather broad amplitude range. This is reflected in Bayes fac-tors, which were inconclusive, and therefore not much can be said about the null hypothesis.
In the behavioural experiment, the picture was slightly different. For d’ scores, there was moderate evidence that the difference between LE and IE1 was reduced in musical experts. Evidence for other interaction terms, including LE-IE3, LE-HE and the slope for the continuous model, although inconclusive, suggested that the effect of entropy was slightly less pronounced for musicians. A similar pattern was ob-served for the confidence ratings. Therefore, although like-lihood ratio tests were non-significant for the interactions, Bayesian analyses provided some evidence for a group differ-ence, at least for some interaction parameters.
Based on this, it would be tempting to conclude that there is evidence for our hypothesis at the behavioural level. However, these results might as well arise from a ceiling effect in musicians’ d’ scores and confidence rat-ings that would reduce differences between LE and IE1 or LE and IE2, compared with the non-musicians’ noticeable
Measure Effect Comparison AIC LR (𝝌2) Df p > LR
d’ scores
(categorical) NullEntropy (cat) d0d1-d0 576.28529.14 –55.13 4– –<.001*
Expertise d1e-d1 505.15 26 1 <.001*
Interaction d1i-d1e 504.06 9.09 4 .06
d’ scores
(continuous) Entropy (con)Expertise d2-d0d2e-d2 524.68500.68 53.626 11 <.001*<.001* Interaction d2i-d2e 501.46 1.22 1 .27
c scores Null cr0 369.81 – – –
Entropy (cat) cr1-cr0 364.8 13.01 4 .01* Expertise cr1e-cr1 365.61 1.19 1 .28 Interaction cr1i-cr1e 348.43 25.18 4 <.001* Confidence Null co0 14,660.73 – – –
Entropy (cat) co1s-co0 14,182.46 514.28 18 <.001* Expertise co1se-co1s 14,179.11 5.34 1 .02* Interaction co1si-co1se 14,180.86 6.25 4 .18 Abbreviations: AIC, Akaike information criterion; cat, categorical; con, continuous; Df, difference in degrees of freedom; LR, likelihood ratio.
Significant contrasts are highlighted in bold and marked with a star (*).
TABLE 3 Likelihood ratio tests for all models in the behavioural experiment
differences between these conditions. The distribution of individual data points in Figure 7 suggests that this might be the case. Taking into consideration the results of the MEG experiment, the generally inconclusive Bayes factors and the possibility of a ceiling effect, it is fair to remain sceptical about the presence of an entropy-by-expertise in-teraction when the two experiments are considered together.
4.2
|
Feature-specific effects
One intriguing finding in Quiroga-Martinez et al. (2019) was that the effect of predictive uncertainty on prediction error was restricted to pitch-related deviants (out-of-tune tones and pitch glides). This was interpreted as suggest-ing a feature-selective effect, given that uncertainty was manipulated in the pitch dimension only, while uncertainty in other dimensions such as timbre and intensity was kept constant. In the current work, this result was replicated in musicians, although with a slightly different pattern of differences. In non-musicians, larger entropy effects were observed for pitch and slide deviants, compared with inten-sity and timbre deviants, in the right but not the left hemi-sphere. For musicians, larger entropy effects were found for pitch deviants when compared with timbre deviants in
both hemispheres, and when compared with intensity devi-ants in the left hemisphere.
Care should be taken not to overinterpret these potential expertise-related differences, until they have been shown in direct group comparisons. However, attention should be paid to the intensity MMNm because, for musicians, a small yet significant difference between LE and HE contexts was found in the cluster-based permutation analyses, which in turn resulted in a significant main effect of entropy for this feature. Note that, for non-musicians, there was already a hint of such a difference. Therefore, it seems that intensity prediction errors are also somewhat affected by the pitch entropy of the melodies, something that challenges the pro-posed feature selectivity.
These results suggest that uncertainty is mainly fea-ture-selective, but has a residual effect on predictive pro-cessing in other features as well. However, there might be two confounding factors here. First, the perception of loud-ness changes with pitch height (Suzuki, Møller, Ozawa, & Takeshima, 2003). In that case, the slightly different pitch distributions in HE and LE conditions (see Figure S1 in Quiroga-Martinez et al., 2019) might have made the loudness violation slightly more or less salient for different conditions. The second confound could be the baseline salience of the deviants, which might have differed between features. For
TABLE 4 Bonferroni-corrected pairwise comparisons for d’ scores
Expertise Contrast Estimate CI 2.5% CI 97.5% t p Cohen's d
NM LE > IE1 0.55 0.02 1.07 2.96 .04* 0.93 LE > IE2 0.54 0.01 1.06 2.91 .04* 0.92 LE > IE3 1.04 0.51 1.56 5.61 <.001* 1.77 LE > HE 1.04 0.52 1.57 5.66 <.001* 1.79 IE1 > IE2 −0.01 −0.53 0.52 −0.04 1 −0.01 IE1 > IE3 0.49 −0.03 1.01 2.65 .09 0.84 IE1 > HE 0.5 −0.03 1.02 2.7 .08 0.85 IE2 > IE3 0.5 −0.03 1.02 2.7 .08 0.85 IE2 > HE 0.51 −0.02 1.03 2.74 .07 0.87 IE3 > HE 0.01 −0.52 0.53 0.04 1 0.01 M LE > IE1 −0.11 −0.6 0.38 −0.64 1 −0.19 LE > IE2 0.39 −0.1 0.88 2.25 .25 0.67 LE > IE3 0.52 0.03 1.01 3.02 .03* 0.89 LE > HE 0.66 0.17 1.15 3.81 <.001* 1.13 IE1 > IE2 0.5 0.01 0.99 2.9 .04* 0.86 IE1 > IE3 0.63 0.14 1.12 3.67 <.001* 1.08 IE1 > HE 0.77 0.28 1.26 4.46 <.001* 1.32 IE2 > IE3 0.13 −0.36 0.62 0.77 1 0.23 IE2 > HE 0.27 −0.22 0.76 1.56 1 0.46 IE3 > HE 0.14 −0.35 0.63 0.79 1 0.23
Abbreviations: CI, confidence interval; HE, high entropy; IE, intermediate entropy; LE, low entropy; M, musicians; NM, non-musicians. Significant contrasts are highlighted in bold and marked with a star (*).
example, a very strong timbre violation might have been less affected by entropy than a less strong intensity violation or an even weaker pitch violation, thus yielding the observed feature-specific patterns.
Another interesting feature-wise finding is that musicians had larger MMNm amplitudes for pitch and slide but not tim-bre or intensity compared with non-musicians. This is consis-tent with the literature, in which larger amplitudes have been consistently found for pitch-related deviants in musicians but less so for other features (Putkinen et al., 2014; Tervaniemi et al., 2014). This might reflect a focus on pitch discrimination as a core ability for musical experts and the fact that musi-cal pitch is organized in rich multidimensional cognitive sys-tems (Krumhansl, 1990), which is not the case for intensity or timbre.
4.3
|
Source reconstruction
As expected from the literature (Deouell, 2007), neural gen-erators of the MMNm were located in primary and secondary bilateral auditory cortices. No prefrontal generators were ob-served, with the exception of the pitch MMNm for which there seemed to be a small source in the ventral part of BA6. This, however, could be caused by leakage of the temporal source. The location of the entropy effect for the pitch MMNm, which was anterior to the primary source, suggests that entropy af-fected the passing of prediction error responses from primary auditory cortex to secondary auditory cortex. This is consist-ent with predictive processing theories (Clark, 2016; Feldman & Friston, 2010; Hohwy, 2013) that suggest an uncertainty-driven reduction in the gain of prediction error responses,
FIGURE 8 Bayesian posterior probability densities for the entropy-by-expertise interaction parameters—that is expertise-related modulation of the comparisons LE-IE1, LE-IE2, LE-IE3, LE-HE and the slope of the continuous model. Densities for (a) categorical and (c) continuous mixed models of d’ scores, as well as (b) a cumulative-link mixed model of confidence ratings, are displayed. Shaded areas represent 95% credible intervals. As accuracy and confidence generally decreased with higher entropy levels, positive parameter values indicate smaller differences between conditions for musicians compared with non-musicians. BF01 = Bayes factor in favour of the null, p = posterior probability of the null, LE = low entropy, IE = intermediate entropy, HE = high entropy
TABLE 5 Bonferroni-corrected contrasts of c scores between musicians and non-musicians for each condition
Condition Contrast Estimate CI 2.5% CI 97.5% t p Cohen's d
LE NM - M 0.6 0.26 0.94 3.46 <.001* 1.41
IE1 NM - M 0.35 0.01 0.7 2.05 .04* 0.84
IE2 NM - M −0.1 −0.44 0.25 −0.55 .58 −0.22
IE3 NM - M −0.19 −0.53 0.16 −1.08 .28 −0.44
HE NM - M 0.02 −0.32 0.36 0.1 .92 0.04
Abbreviations: CI, confidence interval; HE, high entropy; IE, intermediate entropy; LE, low entropy; M, musicians; NM, non-musicians. Significant contrasts are highlighted in bold and marked with a star (*).
which prevents them from driving inference and learning at higher levels of the cortical hierarchy (Griffiths & Warren, 2002). Moreover, this is partly consistent with results reported by Southwell and Chait (2018), who found reduced anterior temporal responses to deviant sounds in contexts with high as compared to low uncertainty. Note that other prefrontal sources were also found in that study which was not detected here. However, their results were based on EEG source reconstruc-tions with no individual anatomical images, which may explain the differences in the sources found in the two studies.
4.4
|
Behavioural experiment
As mentioned above, the effect of entropy on accuracy and confidence scores was present in musicians as well. There was also a main effect of expertise in which musicians were better and more confident at discriminating the deviants, but there was no conclusive evidence for an entropy-by-exper-tise interaction. Thus, behavioural measures were in agree-ment with the outcomes of the MEG experiagree-ment. Apart from these findings, two results deserve attention. First, pairwise differences were found between HE and IE1, and between intermediate conditions (e.g. IE1 and IE3) in both groups. This corroborates the finding that any of the two sources of
uncertainty manipulated in the experiment, namely pitch-al-phabet size and stimulus repetitiveness, can modulate predic-tion error separately. Second, c scores revealed a reduced bias in musicians for LE and IE1 conditions, indicating a higher rate of hits only for categories with the highest precision. Interestingly, for LE stimuli, some musicians systematically reported deviants when there were none, which suggests that the expectancy of a deviation might have occasionally in-duced the illusion of a mistuning.
4.5
|
Limitations and future directions
As we used the same methods as in Quiroga-Martinez et al. (2019), the limitations already discussed in that work also apply to the current report. Briefly, these include the impossibility of disentangling the contribution of pitch-alphabet size and tiveness to the modulation of the MMNm; the different repeti-tion rates of individual melodies in different condirepeti-tions, which might have created different veridical expectations during stim-ulation; the difference in the distribution of pitches between conditions in the MEG experiment and its possible implica-tions for the pitch MMNm; the measurement of uncertainty at the context level rather than on a note-by-note basis; the unu-sual listening situation—that is participants listening passively
TABLE 6 Bonferroni-corrected pairwise comparisons for confidence ratings
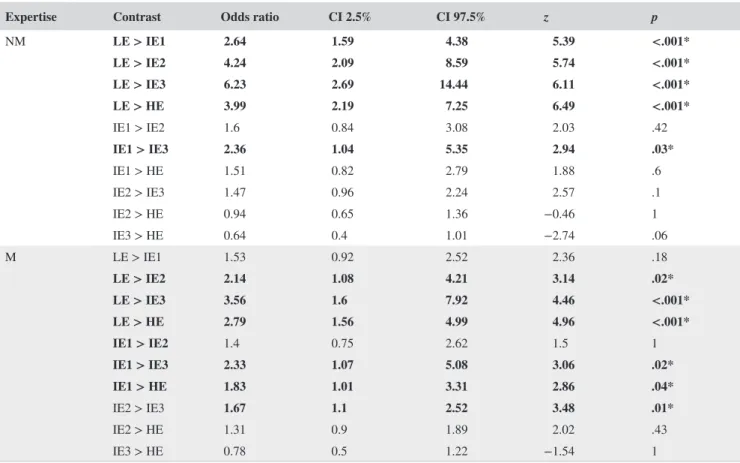
Expertise Contrast Odds ratio CI 2.5% CI 97.5% z p
NM LE > IE1 2.64 1.59 4.38 5.39 <.001* LE > IE2 4.24 2.09 8.59 5.74 <.001* LE > IE3 6.23 2.69 14.44 6.11 <.001* LE > HE 3.99 2.19 7.25 6.49 <.001* IE1 > IE2 1.6 0.84 3.08 2.03 .42 IE1 > IE3 2.36 1.04 5.35 2.94 .03* IE1 > HE 1.51 0.82 2.79 1.88 .6 IE2 > IE3 1.47 0.96 2.24 2.57 .1 IE2 > HE 0.94 0.65 1.36 −0.46 1 IE3 > HE 0.64 0.4 1.01 −2.74 .06 M LE > IE1 1.53 0.92 2.52 2.36 .18 LE > IE2 2.14 1.08 4.21 3.14 .02* LE > IE3 3.56 1.6 7.92 4.46 <.001* LE > HE 2.79 1.56 4.99 4.96 <.001* IE1 > IE2 1.4 0.75 2.62 1.5 1 IE1 > IE3 2.33 1.07 5.08 3.06 .02* IE1 > HE 1.83 1.01 3.31 2.86 .04* IE2 > IE3 1.67 1.1 2.52 3.48 .01* IE2 > HE 1.31 0.9 1.89 2.02 .43 IE3 > HE 0.78 0.5 1.22 −1.54 1
Abbreviations: CI, confidence interval; HE, high entropy; IE, intermediate entropy; LE, low entropy; M, musicians; NM, non-musicians. Significant contrasts are highlighted in bold and marked with a star (*).
while watching a silent movie—which limits the generality of the findings; the rather artificial auditory context—even though our stimuli are much more realistic than in most MMN re-search; and the lack of a preregistration of our hypothesis and analysis plan—something that is partly overcome by the fact that we have now replicated our main findings and have openly shared materials, code and data.
Despite these limitations, our work provides further evidence for the effect of uncertainty—or precision—on prediction error, which is consistent with an increasing number of empirical findings (Garrido et al., 2013; Hsu et al., 2015; Lumaca et al., 2019; Sedley et al., 2016; Sohoglu & Chait, 2016; Southwell & Chait, 2018), theories of pre-dictive processing and models of music perception (Clark, 2016; Feldman & Friston, 2010; Hohwy, 2013; Ross & Hansen, 2016; Vuust et al., 2018). Furthermore, our find-ings confirm that MMNm responses can be reliably re-corded in realistic paradigms where sounds constantly change, which constitutes a methodological improvement on existing approaches.
Consequently, we hereby open the possibility of address-ing questions about predictive processaddress-ing and predictive uncertainty in more realistic and complex auditory environ-ments. One possible future direction in this regard would be to elucidate where and how the modulation of prediction error takes place in the auditory frontotemporal network. Specifically, it would be interesting to address whether the precision-weighting effect arises from top-down or intrin-sic connectivity, and whether neuromodulation plays a role (Auksztulewicz et al., 2018). Paradigms similar to the one presented here could be used in combination with connec-tivity measures, such as dynamic causal modelling (Moran, Pinotsis, & Friston, 2013), and intracranial recordings (e.g. Omigie et al., 2019) to address these questions. Moreover, for music research, methods such as these could be very infor-mative about the nature of musical knowledge and musical expectations and how these are represented in the cortical hi-erarchy. Relatedly, this line of research could inform musical aesthetics, given that some musical styles exploit uncertainty as an artistic resource (Mencke, Omigie, Wald-Fuhrmann, & Brattico, 2019). Finally, the use of more realistic stimuli could help us understand how different types of musical stim-uli (e.g. different styles) are processed by listeners of differ-ent backgrounds, something that we have started to address here with musical experts, but that could be extended, for example, to listeners from different cultures or with instru-ment-specific expertise.
5
|
CONCLUSION
In the present study, we have shown that pitch prediction error responses in musical experts—as indexed by MMNm
responses, accuracy scores and confidence ratings—are re-duced by pitch predictive uncertainty when listening to rela-tively complex and realistic musical stimuli. This suggests that our previous findings in non-musicians are robust and repli-cable and provides further support for theories of predictive processing which propose that neural responses to surprising stimuli are modulated by predictive uncertainty. Furthermore, our results show that, while musicians have generally larger prediction error responses, the uncertainty effect does not substantially change with expertise, thus pointing to separate long-term and short-term mechanisms of precision modula-tion. Overall, our work demonstrates that music, as a rich and multifaceted auditory signal, is an ideal means to improve our understanding of uncertainty and predictive processing in the brain.
ACKNOWLEDGEMENTS
We wish to thank the project initiation group, namely Christopher Bailey, Torben Lund and Dora Grauballe, for their help with setting up the experiments. We also thank Nader Sedghi, Massimo Lumaca, Giulia Donati, Ulrika Varankaite, Giulio Carraturo, Riccardo Proietti and Claudia Iorio for assistance during MEG recordings. We are indebted as well to the group of Italian trainees from IISS Simone-Morea, Conversano, who helped with the behavioural ex-periment. Finally, we thank Hella Kastbjerg for checking the English language of this manuscript. The Center for Music in the Brain is funded by the Danish National Research Foundation (DNRF 117), which did not have any influence on the scientific content of this article.
CONFLICT OF INTERESTS
None.
AUTHOR CONTRIBUTIONS
David R. Quiroga-Martinez conceptualized the study, in-volved in methodology, provided software, performed formal analysis, curated the data, wrote the original draft, visualized the data and investigated the study. Niels Chr. Hansen con-ceptualized the study, involved in methodology and wrote the original draft. Andreas Højlund conceptualized the study, involved in methodology, provided software, wrote the origi-nal draft and supervised the data. Marcus T. Pearce provided software, performed formal analysis and wrote the original draft. Elvira Brattico conceptualized and supervised the study and wrote the original draft. Peter Vuust conceptual-ized the study, performed methodology, supervised the data and wrote the original draft.
DATA AVAILABILITY STATEMENT
The data, code and materials necessary to reproduce these ex-periments and results can be found at: https ://osf.io/my6te/ ; https ://doi.org/10.17605/ OSF.IO/MY6TE .